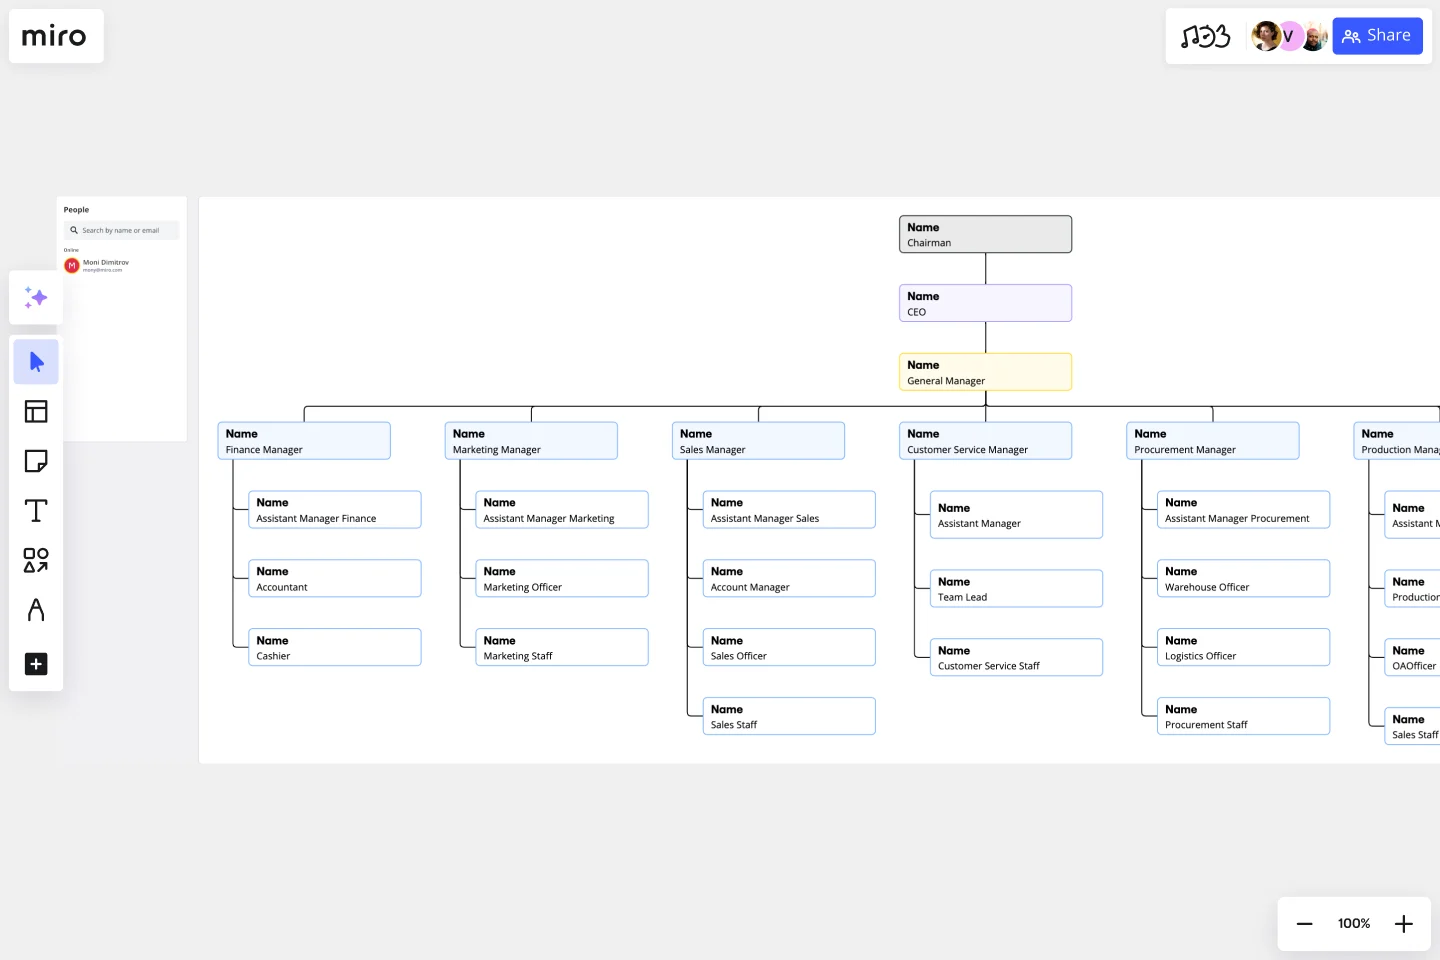
Vertical Organizational Chart
Illustrate hierarchies top-down with the vertical org chart template. Promote clear communication and avoid misunderstandings inside your organization.
About the Vertical Org Chart Template
A well-defined organizational structure is crucial for effective communication and a clear understanding of roles and responsibilities within an entity. The Vertical Org Chart Template is a valuable tool that enables teams to visualize the hierarchical relationships and team dynamics in a top-down manner.
This template provides a structured representation of people and their roles within an organization, with the highest authority at the top and the hierarchy branching downwards. Each section of the template represents a tier of the hierarchy. By mapping out these relationships, one can easily understand the flow of responsibilities and communication channels within an organization.
How to use the vertical org chart template
Add your data: Begin at the topmost tier, representing the highest authority, and work your way down. Fill in each section with the appropriate title or individual's name by double-clicking the shapes.
Customize with ease: Adjust the size, color, and design of each block to match your organization's branding or to differentiate between departments. Use the context-menu bar to edit your vertical org chart features.
Expand as needed: Need to add more tiers or members? Use the automated diagramming features to add additional shapes and connector lines seamlessly.
Give more context: Beyond names and titles, you can attach any artifact to your chart, like photos, documents, or notes, to provide additional context.
Why should you use a vertical org chart template?
Visualizing the hierarchy of an organization can have several benefits, including clear communication, efficient onboarding, strategic planning, transparency, and enhanced collaboration.
Clear communication: By visualizing the hierarchy, organizations can ensure clear communication channels, reducing misunderstandings and potential conflicts.
Efficient onboarding: New members can quickly understand the organization's structure, facilitating faster integration and orientation.
Strategic planning: Decision-makers can use the chart to identify gaps, redundancies, or potential areas for expansion or consolidation.
Transparency: Employees gain clarity on reporting lines and understand their position within the broader organizational context.
Enhanced collaboration: Recognizing interconnected roles can foster collaboration between departments or teams, driving synergies and improved outcomes.
Miro is the perfect org chart creator to help visualize and understand your organization's hierarchical structure and reporting lines between roles. If you're interested in learning more about organizational charts you can read our in-depth guide.
Can the template be customized to fit large organizations?
Absolutely. The template is scalable, allowing for the addition of more tiers and entities. The automated diagramming features ensure that expanding the template remains a smooth process.
Is it possible to link external documents or websites to the chart?
Yes. Artifacts, such as documents or URLs, can be attached to any part of the chart, offering a richer context and acting as a quick reference point.
How can I differentiate between departments or teams in the chart?
The template is highly customizable. You can change colors, shapes, and designs to demarcate different departments or teams, making the visualization more intuitive.
Can the Vertical Org Chart be shared and edited collaboratively?
Indeed. Like other templates, the Vertical Org Chart allows real-time collaboration, enabling teams to jointly input, edit, and finish the organizational structure.
Get started with this template right now.
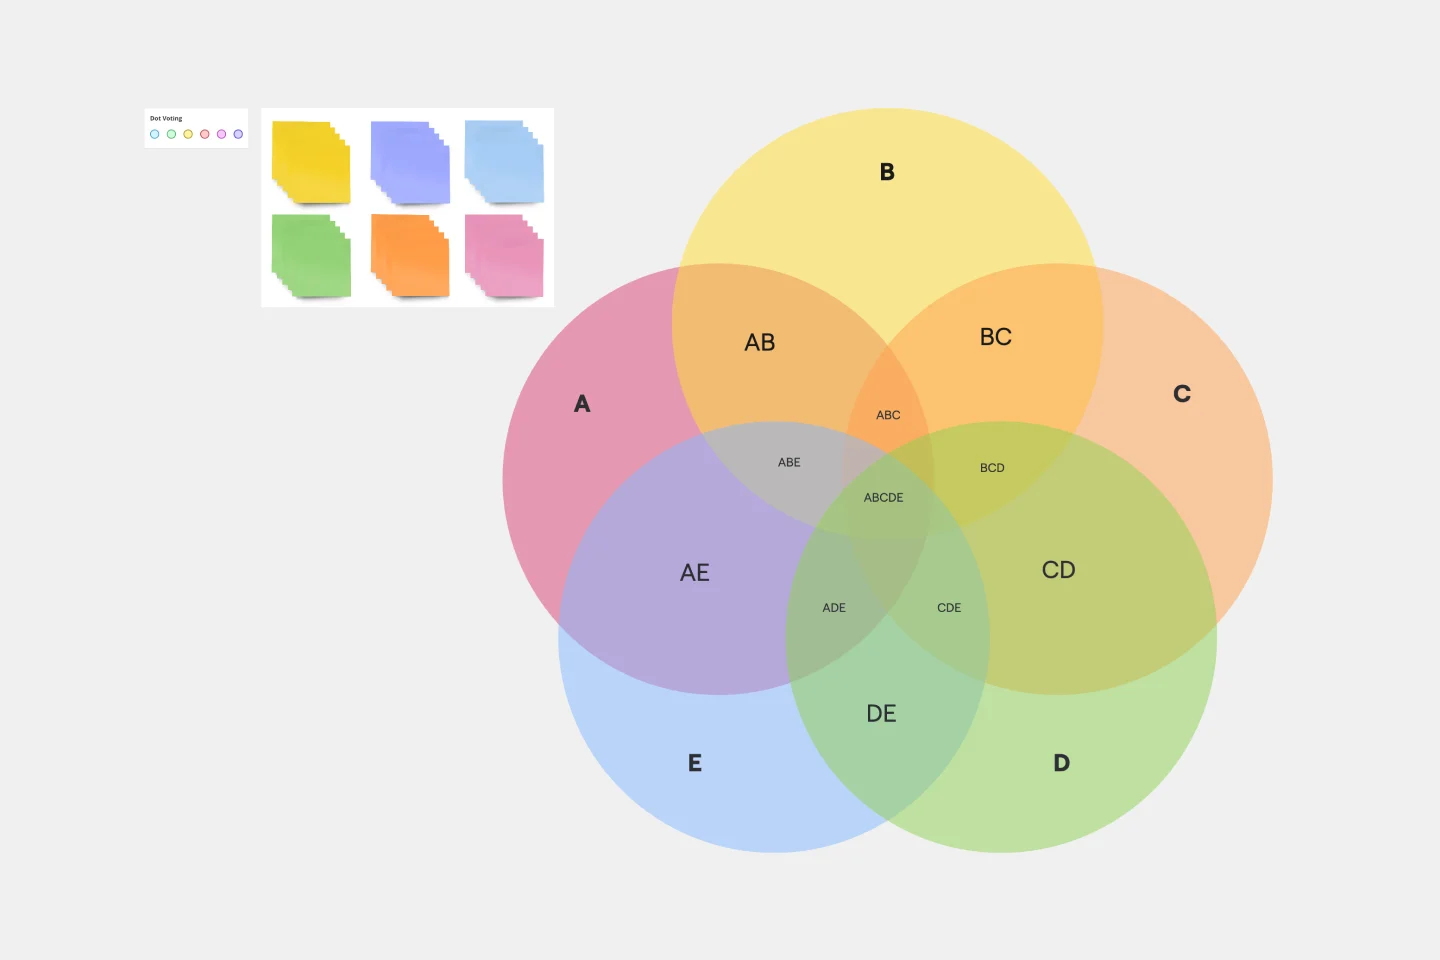
5-Circle Venn Diagram Template
Works best for:
Diagramming, Mapping, Brainstorming
Discover how Miro's 5 Circle Venn Diagram Template can simplify complex decision-making processes. Learn how to create, customize, and share your diagrams for effective visual collaboration. Transform brainstorming sessions with real time, remote teamwork.
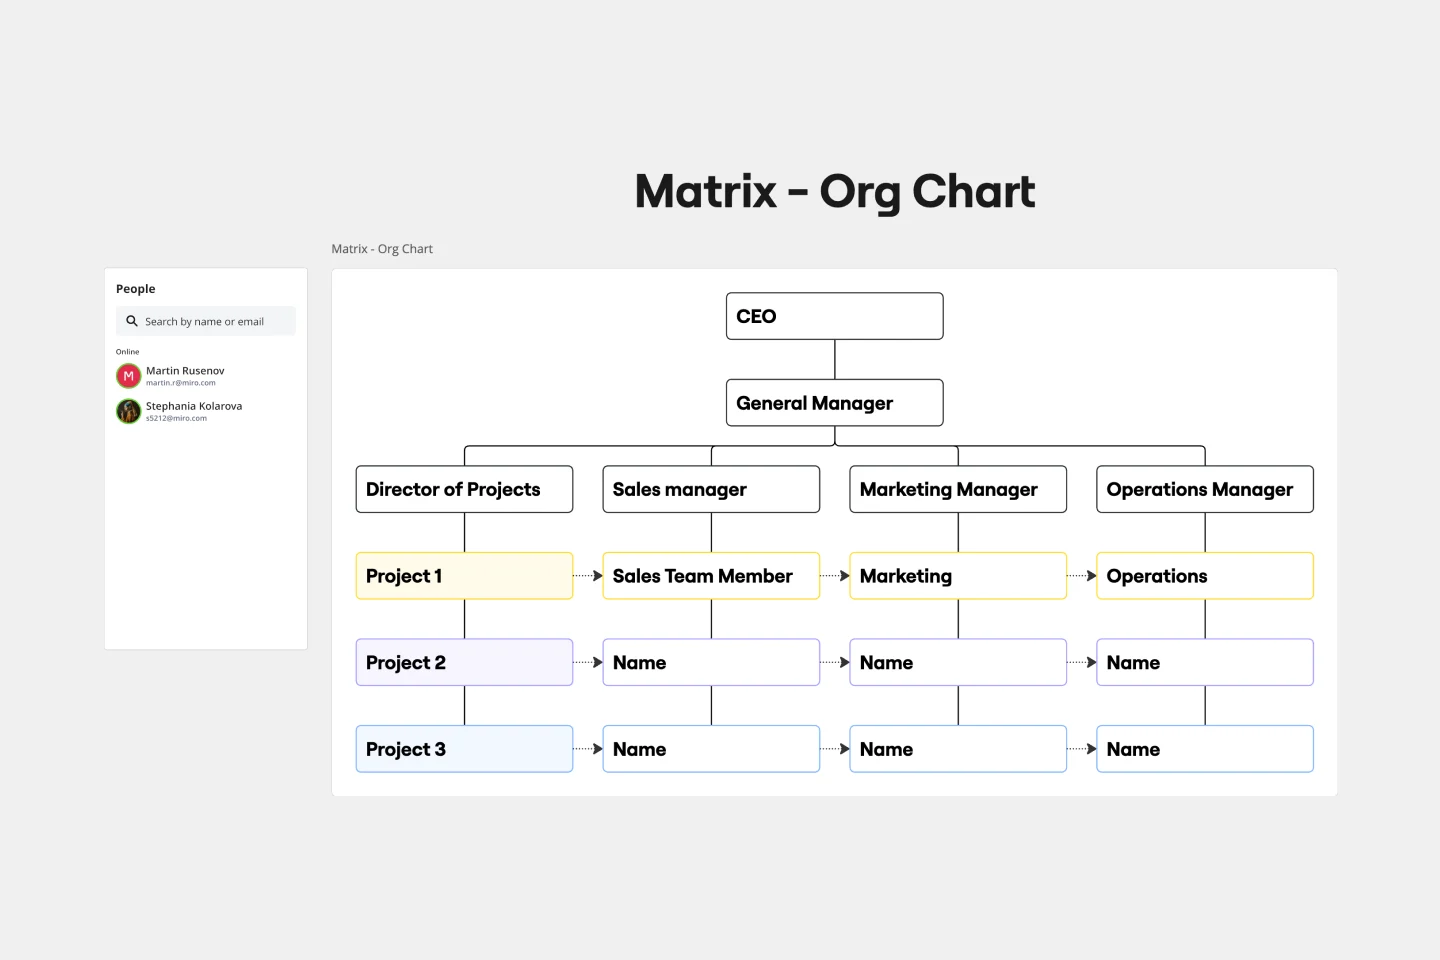
Matrix Org Chart
Works best for:
Organizational Charts, Diagramming
The matrix org chart template organizes teams efficiently and promotes effective communication. It is an essential tool for businesses that require complex decision-making capabilities and rapid response times. With this template, people can easily visualize their roles, responsibilities, and relationships within the organization, leading to improved alignment and performance.
Circular Org Chart Template
Works best for:
Organizational Chart
The Circular Org Chart Template is an innovative solution that helps represent and visualize complex organizational structures with ease. The key advantage of this template is its ability to present complex hierarchies in a visually appealing and easy-to-understand format. By adopting a circular arrangement, the template provides a comprehensive and holistic view of the organization, making it effortless for teams to comprehend reporting relationships at a glance. The visual clarity offered by this template fosters efficient communication and decision-making, offering a seamless experience for teams to understand their organizational structure. The template's intuitive design and emphasis on visual representation significantly enhance transparency, promoting a deeper understanding of organizational roles and relationships.
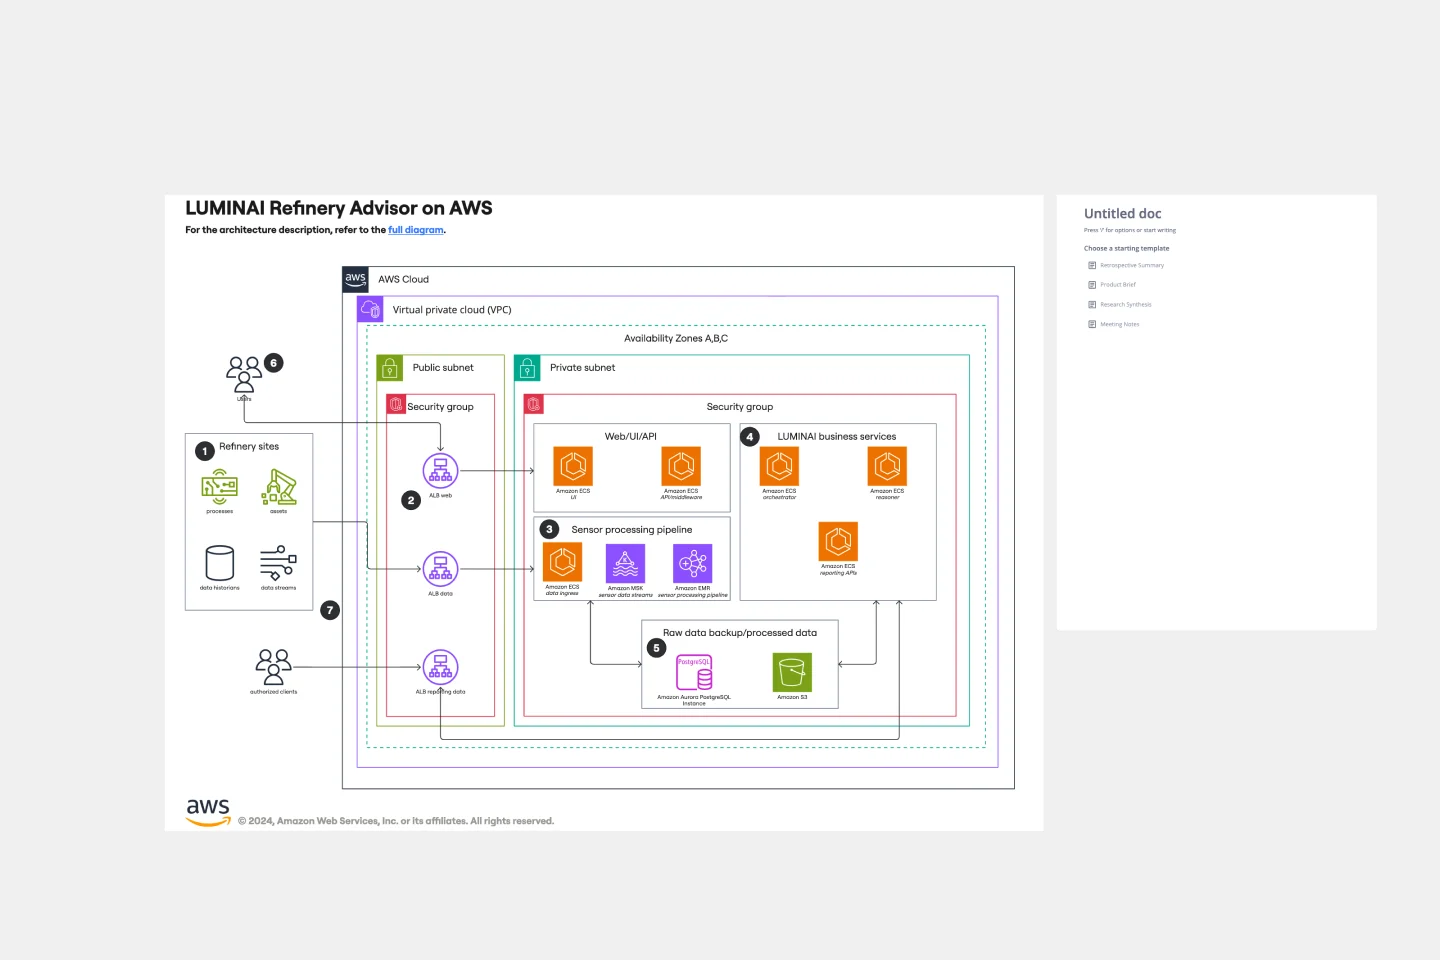
LUMINAI Refinery Advisor on AWS Template
Works best for:
AWS
The LUMINAI Refinery Advisor on AWS template streamlines and optimizes refinery operations through AWS. It provides a structured approach to setting up and managing AWS services, tailored specifically for engineers, developers, and data scientists in the refinery sector. This template not only saves time and effort by offering a predefined structure and best practices but also allows for customization to meet specific operational needs. With its focus on enhancing data processing capabilities, the LUMINAI Refinery Advisor on AWS template is an invaluable resource for improving the efficiency, effectiveness, and optimization of refinery processes on the AWS platform.
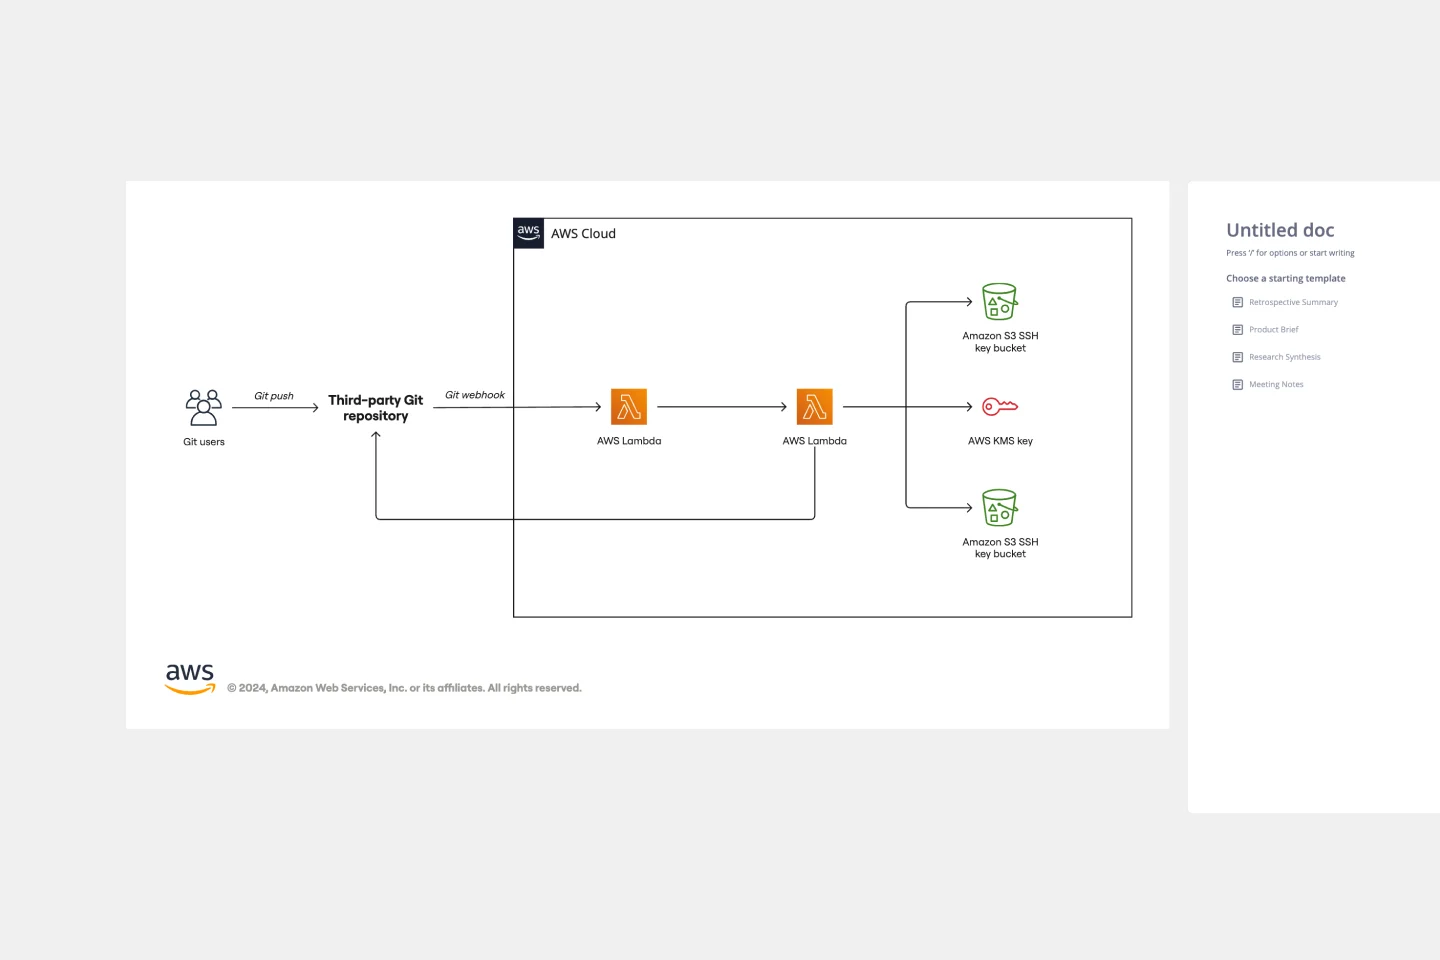
AWS Git to S3 Webhooks Template
Works best for:
Software Development, Diagrams
The AWS Git to S3 Webhooks Template is a visual representation of Git webhooks with AWS services Quick Start architecture. You can now have an overview of your AWS architecture with Miro’s AWS Git to S3 Webhooks Template, track your cloud solutions easily, and optimize processes like never before.
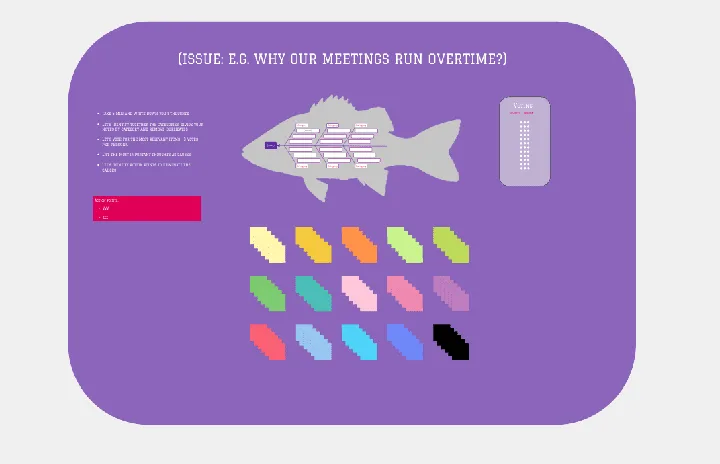
Fishbone Diagram by Hanna Havulinna
Works best for:
Diagramming
The Fishbone Diagram template, also known as the Ishikawa or Cause-and-Effect diagram, offers a visual tool for identifying and analyzing root causes of problems or issues. It provides a structured framework for categorizing potential causes into major categories such as people, process, environment, and equipment. This template enables teams to conduct root cause analysis systematically, facilitating problem-solving and decision-making. By promoting a structured approach to problem analysis, the Fishbone Diagram empowers teams to address issues effectively and implement corrective actions efficiently.