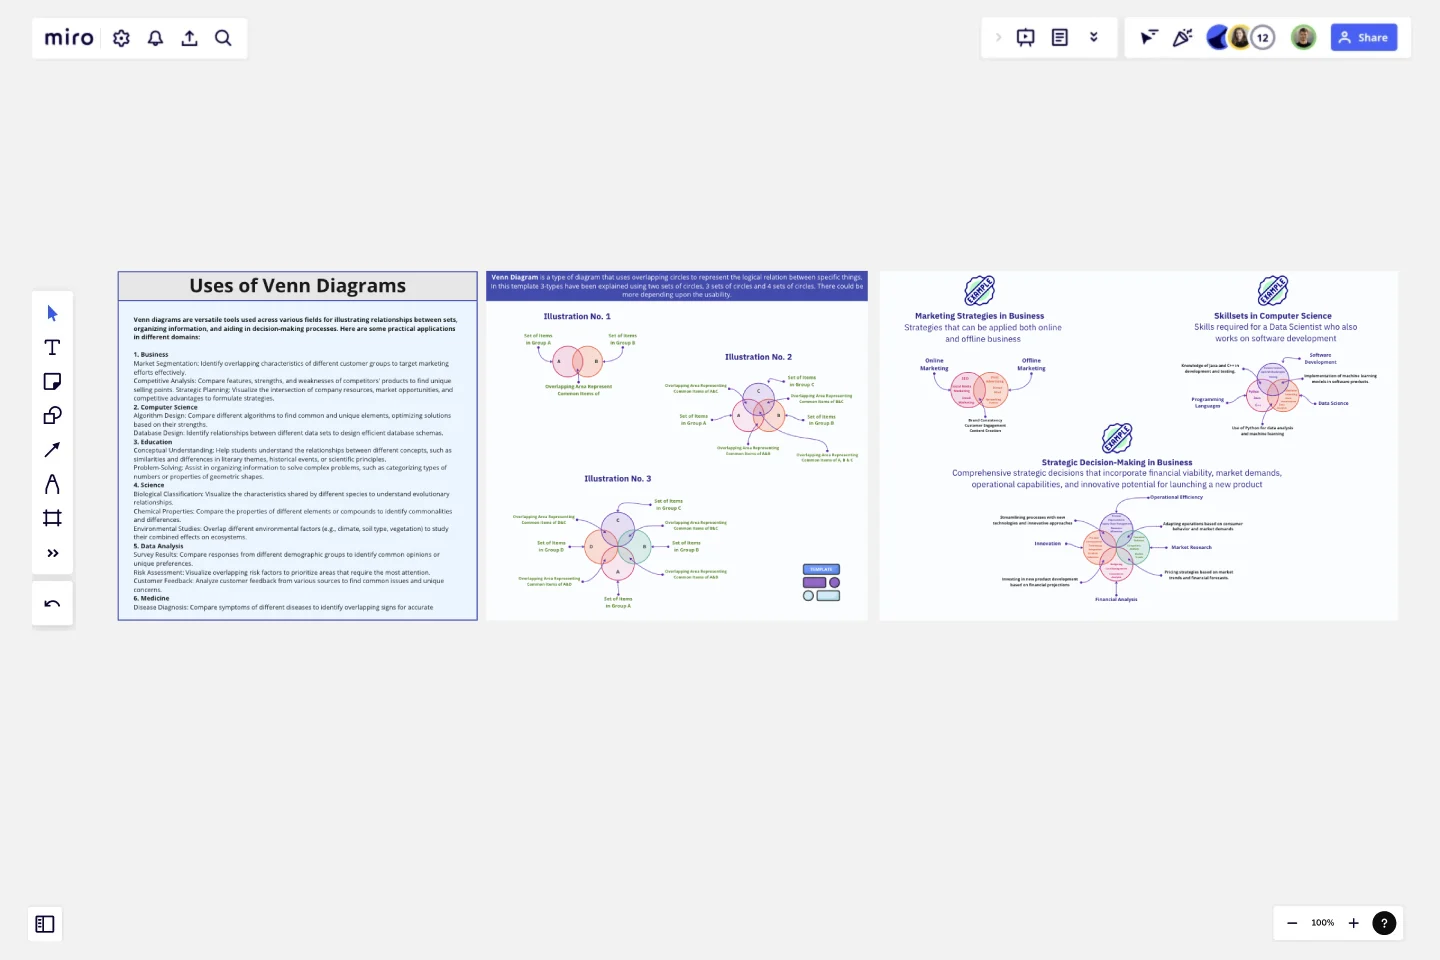
Venn Diagram Practical Applications
The "Venn Diagram Practical Applications" template is designed to help users visualize and analyze the relationships between different sets of data using Venn diagrams.
Overview:
The "Venn Diagram Practical Applications" template is designed to help users visualize and analyze the relationships between different sets of data using Venn diagrams. This template is ideal for professionals, educators, and students across various fields such as business, computer science, and strategic planning. It provides a clear and effective way to compare and contrast different elements, identify commonalities, and uncover unique attributes.
Key Features:
Versatile Use Cases: Demonstrates practical applications of Venn diagrams in real-life scenarios across multiple domains.
Different Diagram Configurations: Includes examples with two-circle, three-circle, and four-circle Venn diagrams to cater to varying levels of complexity.
Interactive Elements: Allows users to add, edit, and customize the diagram content based on their specific needs and data sets.
Visual Clarity: Uses distinct colors and overlapping areas to clearly depict intersections and differences between sets.
How to Use:
Two-Circle Venn Diagram:
Description: Ideal for comparing two different sets or groups.
Example: Comparing the features of two competing products in the market.
Set A: Product X features (e.g., Price, User Interface)
Set B: Product Y features (e.g., Battery Life, Customer Support)
Intersection: Common features (e.g., Availability, Warranty)
Three-Circle Venn Diagram:
Description: Useful for comparing three different sets or groups to find commonalities and unique characteristics.
Example: Overlapping skill sets in a project team.
Set A: Skills of Team Member A (e.g., Coding, Design)
Set B: Skills of Team Member B (e.g., Marketing, Design)
Set C: Skills of Team Member C (e.g., Coding, Project Management)
Intersections: Areas where two or three members share skills.
Four-Circle Venn Diagram:
Description: Best for complex comparisons involving four different sets or groups.
Example: Market segmentation analysis for a new product launch.
Set A: Segment 1 (e.g., Age Group 18-25)
Set B: Segment 2 (e.g., Income Level High)
Set C: Segment 3 (e.g., Geographical Region A)
Set D: Segment 4 (e.g., Interest in Technology)
Intersections: Identifying the core target audience that falls into multiple segments.
Practical Applications:
Business: Analyzing market segments, comparing product features, and identifying strategic opportunities.
Computer Science: Visualizing algorithm performance, comparing programming languages, and mapping software functionalities.
Strategies: Developing strategic plans, understanding competitive landscapes, and aligning organizational goals.
Benefits:
Enhanced Understanding: Simplifies the comparison and analysis of multiple sets of data.
Improved Decision Making: Helps identify commonalities and differences that can inform strategic decisions.
Versatile Tool: Applicable across various fields and scenarios, making it a valuable tool for diverse users.
Regards
Khawaja Rizwan
Get started with this template right now.

Empathy Map
Works best for:
Research & Design, Market Research
The Empathy Map template is designed to help you understand your users deeply. It captures user behaviors, thoughts, and feelings, allowing you to design products that truly resonate with their needs. Use this template to enhance your UX research and create user-centered designs.
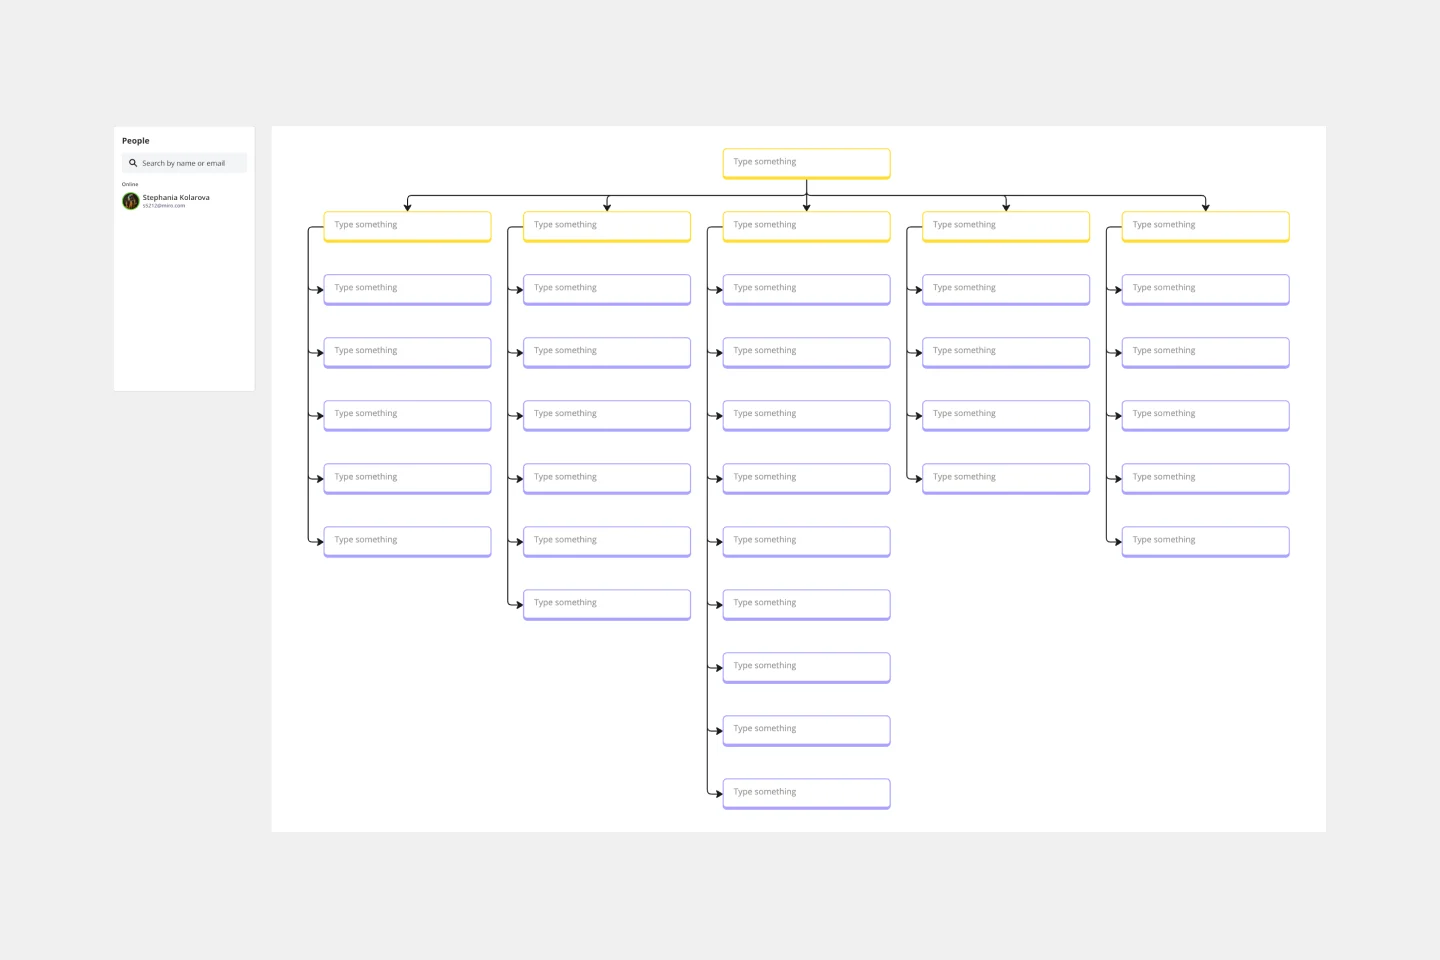
Work Breakdown Structure Template
Works best for:
Project Management, Mapping, Workflows
A work breakdown is a project management tool that lays out everything you must accomplish to complete a project. It organizes these tasks into multiple levels and displays each element graphically. Creating a work breakdown is a deliverable-based approach, meaning you’ll end up with a detailed project plan of the deliverables you must create to finish the job. Create a Work Breakdown Structure when you need to deconstruct your team's work into smaller, well-defined elements to make it more manageable.
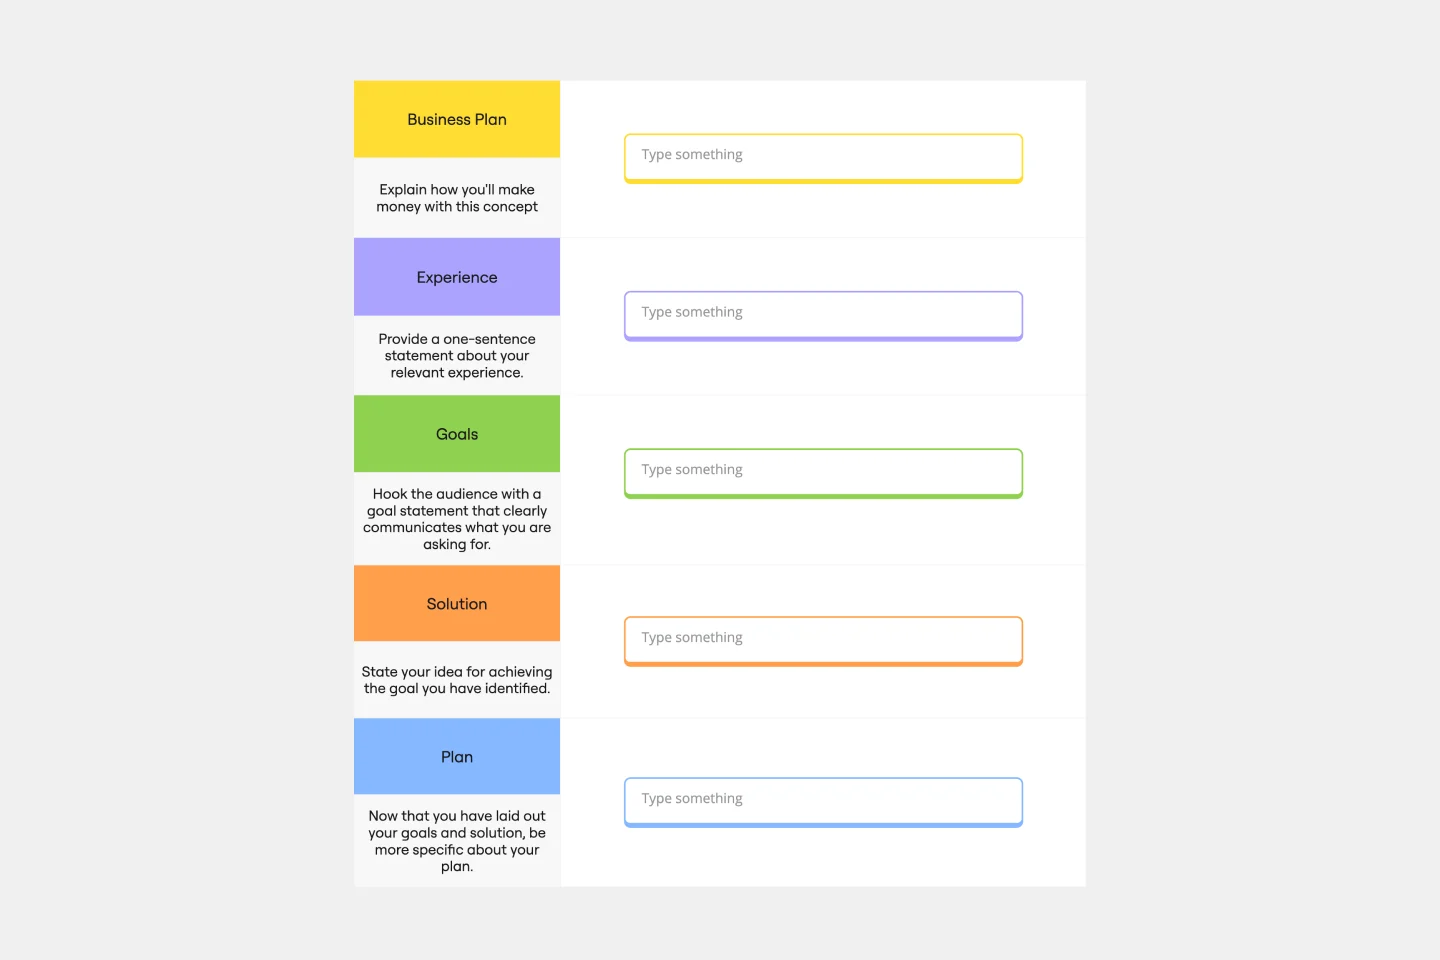
Business Pitch Template
Works best for:
Business Pitch
The Business Pitch Template uses visual aids to enhance your pitch, making it more impactful and easier to understand. This gives your pitch an edge, leaving a lasting impression and greatly improving your ability to convey your ideas persuasively.
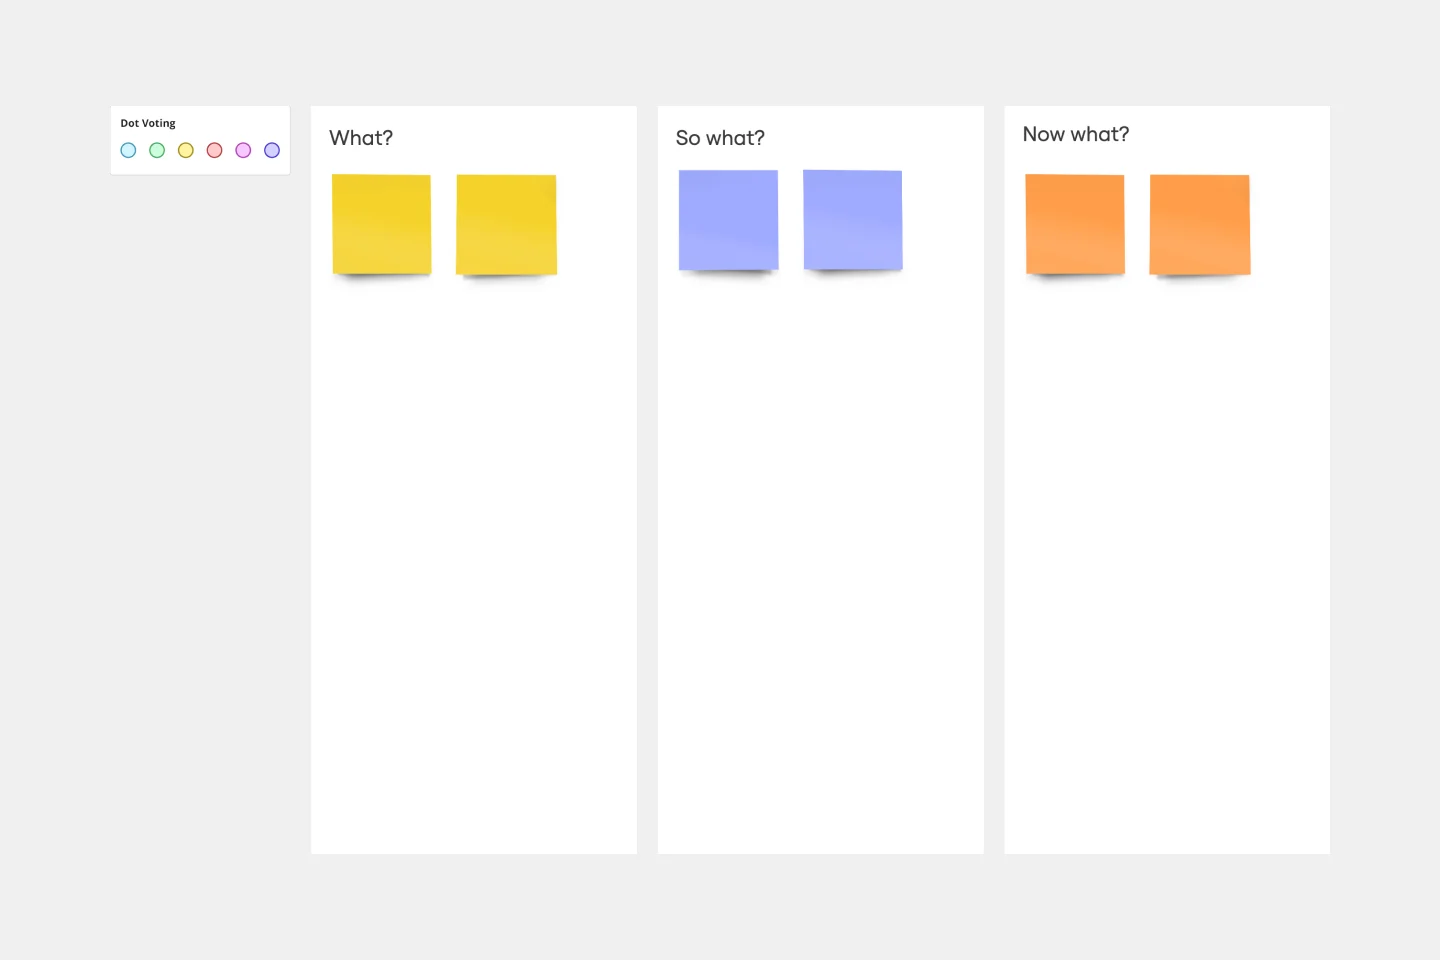
What? So What? Now What? Template
Works best for:
Agile Workflows, Retrospectives, Brainstorming
The What? So What? Now What? Framework empowers you to uncover gaps in your understanding and learn from others’ perspectives. You can use the What? So What? Now What? Template to guide yourself or a group through a reflection exercise. Begin by thinking of a specific event or situation. During each phase, ask guiding questions to help participants reflect on their thoughts and experience. Working with your team, you can then utilize the template to record your ideas and to guide the experience.

How Now Wow Matrix Template
Works best for:
Ideation, Product Management, Prioritization
There are no bad ideas in a brainstorm — but some are more original and easier to implement. The How Now Wow matrix is a tool that helps you identify and organize those great ideas, as well as reinvigorates your team to think creatively and take risks (a taller order as you scale). Grab this template to create your own matrix, then rank the ideas you generated in a brainstorm as “How” (difficult to implement), “Now” (easy to implement), or “Wow” (both original and easy to implement).
OKR Planning Template
Works best for:
Strategic Planning, Meetings, Workshops
The OKR Planning template helps you turn exhaustive OKR sessions into dynamic and productive meetings. Use this template to make OKR planning more interactive, guiding your team through the session with creative Ice Breakers and Brainstorms, so you can co-create your OKRs and define the key results and action plans to achieve them.