
Venn Diagram for Marketing Analysis
A Venn diagram is a graphical representation that shows similarities and differences between items, concepts or data.
Overview
A Venn diagram is a graphical representation that shows similarities and differences between items, concepts or data. They utilize shapes, often circles, to illustrate relationships and compare data. Venn diagrams are certainly one of the most well-known types of diagrams. This design, featuring a series of simple circles or ellipses or rectangles that overlap is ubiquitous. The overlapping region of a Venn diagram indicates similarities while others showcase differences. Although the Venn diagram was created to describe mathematically logical relationships, it’s now used to show all types of relationships.
Overview: The Offline and Online Marketing Landscape
This Venn diagram visually represents the intersections and unique elements of four major marketing categories: Traditional Offline Marketing, Digital Offline Marketing, Traditional Online Marketing, and Digital Online Marketing. Each circle represents one of these categories, highlighting both their distinct and overlapping methods:
- Circle 1: Traditional Offline Marketing
- Circle 2: Digital Offline Marketing
- Circle 3: Traditional Online Marketing
- Circle 4: Digital Online Marketing
Elements for Each Circle
1. Traditional Offline Marketing: Print Ads, Billboards, TV and Radio Ads, Direct Mail, Telemarketing
2. Digital Offline Marketing: Digital Billboards, Electronic Kiosks, Interactive TV ads, Digital Signage
3. Traditional Online Marketing: Email Marketing, Online Directories, Banner Ads, Pop-Up Ads
4. Digital Online Marketing: Social Media Marketing, SEO, PPC Ads, Content Marketing, Influencer Marketing, Mobile App Advertising
Overlaps
Traditional Offline + Digital Offline: TV Ads with QR Codes
Traditional Offline + Traditional Online: TV ads promoting social media handles
Traditional Offline + Digital Online: Offline events promoted on social media, TV/radio ads promoting social media handles
Digital Offline + Traditional Online: Digital billboards displaying website URLs
Digital Offline + Digital Online: Interactive kiosks integrated with social media
Traditional Online + Digital Online: Email campaigns featuring social media links
Intersection of All Four: Comprehensive integrated marketing campaigns utilizing print, TV/radio, digital billboards, email marketing, and social media.
Above elaborated marketing analysis venn-diagram will help you understand its application to your problem statement.
Goodluck,
Khawaja Rizwan
Get started with this template right now.
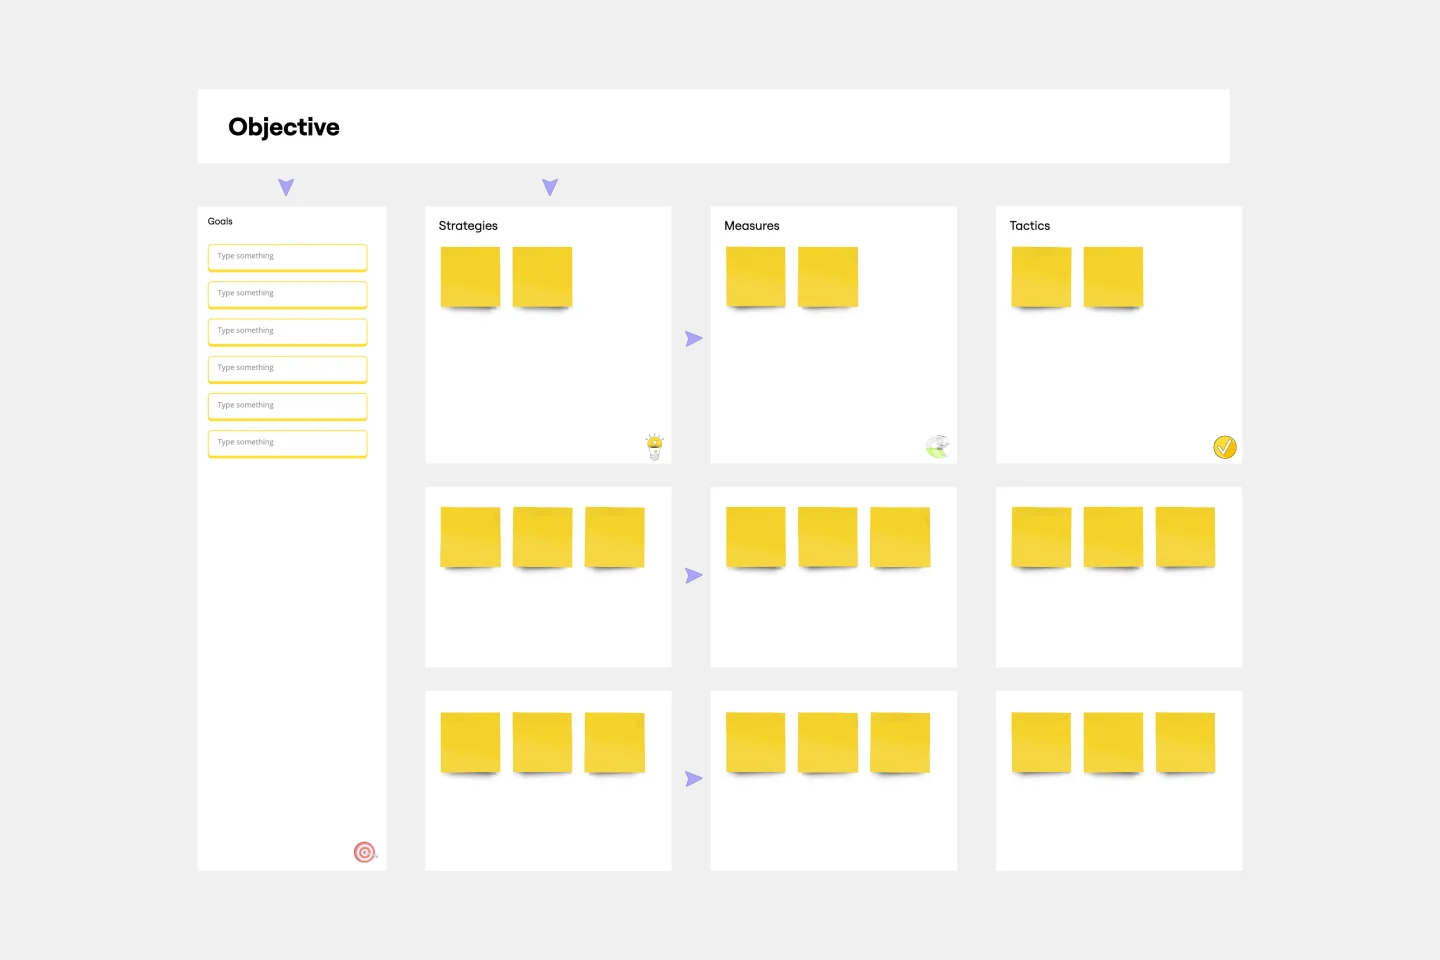
OGSM Template
Works best for:
Strategy, Planning
The OGSM template provides a readable framework, systematically breaking down business strategies into Objectives, Goals, Strategies, and Measures. This structured approach ensures that overarching visions are translated into actionable plans, fostering alignment across different teams and initiatives. One standout benefit of using this template is its ability to offer clarity. By clearly delineating between broad objectives and specific measures, stakeholders can easily comprehend and stay focused on the most critical elements of a strategy, ensuring that all efforts are directed toward the desired outcomes.
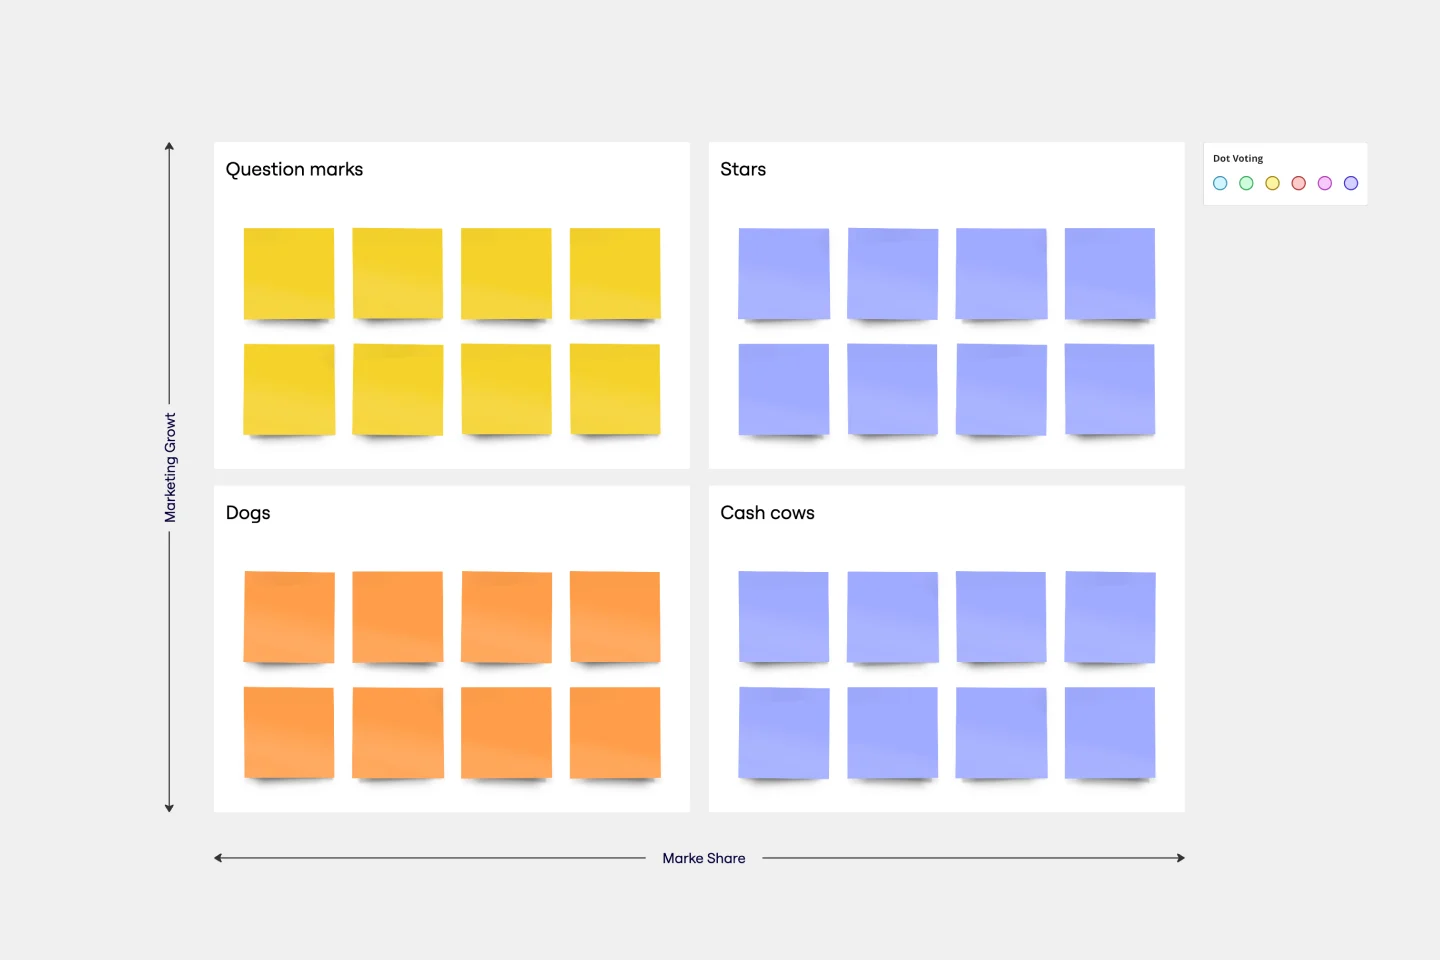
BCG Matrix Template
Works best for:
Strategic Planning
Use the BCG matrix template to make informed and strategic decisions about growth opportunities for your business. Assign your portfolio of products to different areas within the matrix (cash cows, dogs, question marks, stars) to prioritize where you should invest your time and money to see the best results.
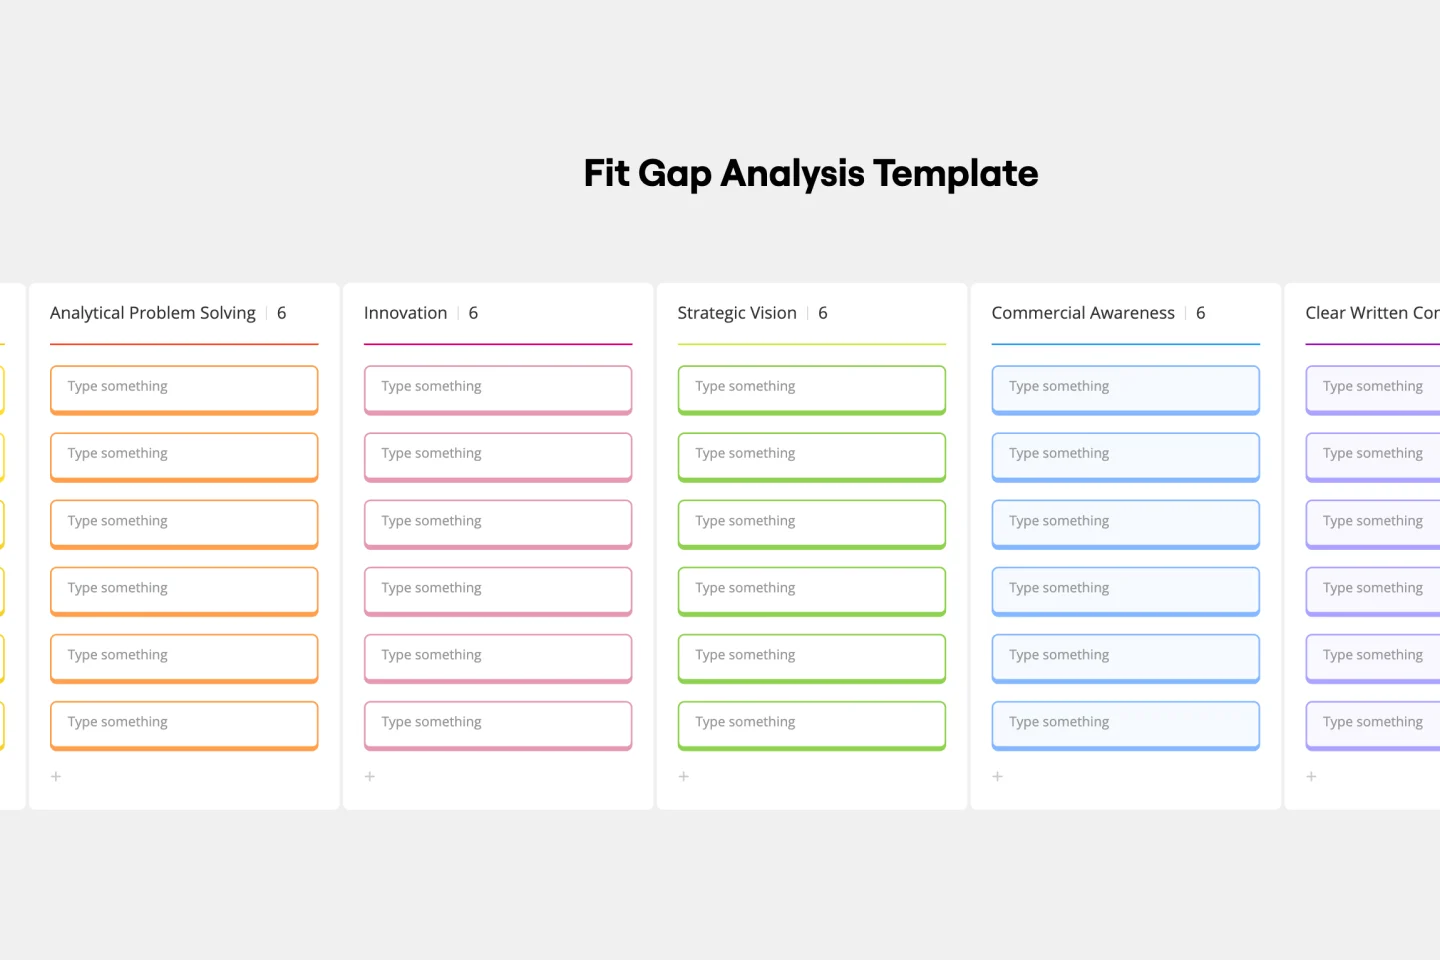
Fit Gap Analysis Template
Works best for:
Strategy, Planning, Management
The Fit Gap Analysis Template is a strategic tool designed to help teams and organizations identify discrepancies between their current state and desired outcomes. By visualizing these gaps, it offers a clear roadmap for improvement, allowing for a focused alignment of resources. One significant benefit of using this template is enhanced clarity; teams can visually discern where they currently stand and plot a precise path toward their goals, ensuring efficient decision-making and effective resource allocation.
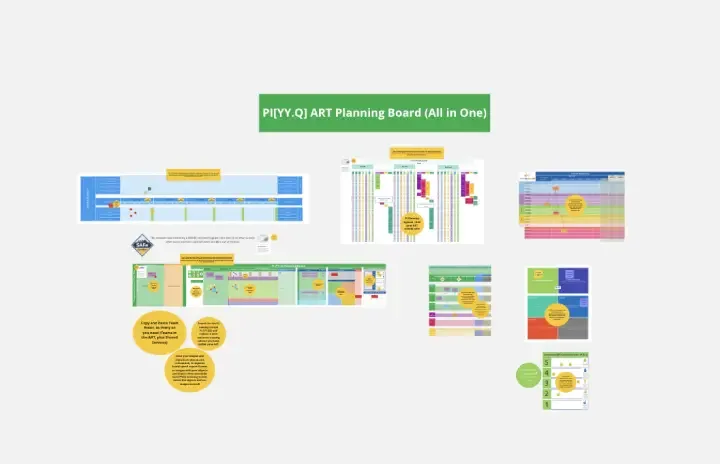
All-in-one PI Planning
Works best for:
Agile
The All-in-one PI Planning template streamlines the SAFe Program Increment (PI) Planning process by providing a comprehensive framework for teams to collaboratively plan and align on objectives and dependencies. It integrates essential elements such as PI Objectives, Team Breakouts, and Program Board, enabling teams to visualize, prioritize, and coordinate work effectively. This template empowers Agile Release Trains to deliver value predictably and efficiently, driving alignment and synchronization across the organization.
Reverse Brainstorming Template
Works best for:
Ideation, Brainstorming, Team Meetings
Reverse brainstorming is a technique that prompts a group to think of problems, rather than solutions. Because we naturally think of problems, it’s a great way to get a group to anticipate problems that may occur during a project. To engage in reverse brainstorming, start by identifying the problem, and then think of things that might exacerbate it. Ask your team to generate ideas around ways in which the problem could get worse. Reverse the problems into solutions again, and then evaluate your ideas.

Workday Calendar ▪ Timeline 2024
Works best for:
Planning, Timeline
The Workday Calendar Timeline 2024 template is ideal for planning your work year. It helps you organize work schedules, track important deadlines, and plan for holidays and events. This template ensures you stay productive and on top of your work commitments.