
Venn Diagram for Research
The Venn Diagram for Research template is an essential tool designed to help researchers visually organize, compare, and contrast different datasets, concepts, or variables.
The Venn Diagram for Research template is an essential tool designed to help researchers visually organize, compare, and contrast different datasets, concepts, or variables. By clearly displaying the relationships and overlaps between categories, this template aids in uncovering insights and drawing meaningful conclusions.
Why Use This Template?
Organize Complex Data:
Visual Clarity: The template simplifies the organization of complex data, making it easier to understand and analyze.
Structured Comparison: Helps in systematically comparing and contrasting different research elements.
Enhance Analytical Insights:
Identify Patterns: Easily spot patterns, trends, and relationships between different datasets or variables.
Highlight Gaps: Quickly identify gaps or areas needing further investigation.
Facilitate Collaboration:
Team Alignment: Use the template in collaborative research settings to ensure all team members have a clear understanding of the relationships between different research elements.
Interactive Discussions: Ideal for group discussions, brainstorming sessions, and collaborative analysis.
Support Decision-Making:
Informed Conclusions: Helps in making informed decisions by clearly showing the intersection of different research categories.
Strategic Planning: Assists in planning research focus areas, methodologies, and further investigations.
Ease of Use:
Pre-Defined Sections: Comes with pre-defined sections for various categories and their overlaps, making it quick and easy to start using.
Editable Placeholders: Includes editable placeholders for notes, allowing for customization based on specific research needs.
Versatile Application:
Adaptable: Suitable for various types of research, including qualitative, quantitative, and mixed-methods studies.
Reusable: Can be reused across different research projects, making it a valuable tool for ongoing research activities.
Use Cases:
Comparative Studies: Compare different datasets, such as qualitative and quantitative data, or different sources of information.
Thematic Analysis: Identify common themes and unique insights across various research categories.
Data Integration: Integrate findings from different studies or sources to draw comprehensive conclusions.
Research Planning: Plan and prioritize research activities based on identified overlaps and gaps.
Template Features:
Instructions Section:
Step-by-Step Guide: Simple instructions on how to fill out and use the Venn Diagram effectively.
Example Notes:
Pre-Populated Examples: Examples of notes for each section to help users understand how to populate the diagram.
By choosing the Venn Diagram for Research template, researchers can effectively organize and analyze their data, leading to deeper insights and more robust conclusions. This template is ideal for anyone looking to streamline their research process and enhance collaborative efforts.
Get started with this template right now.
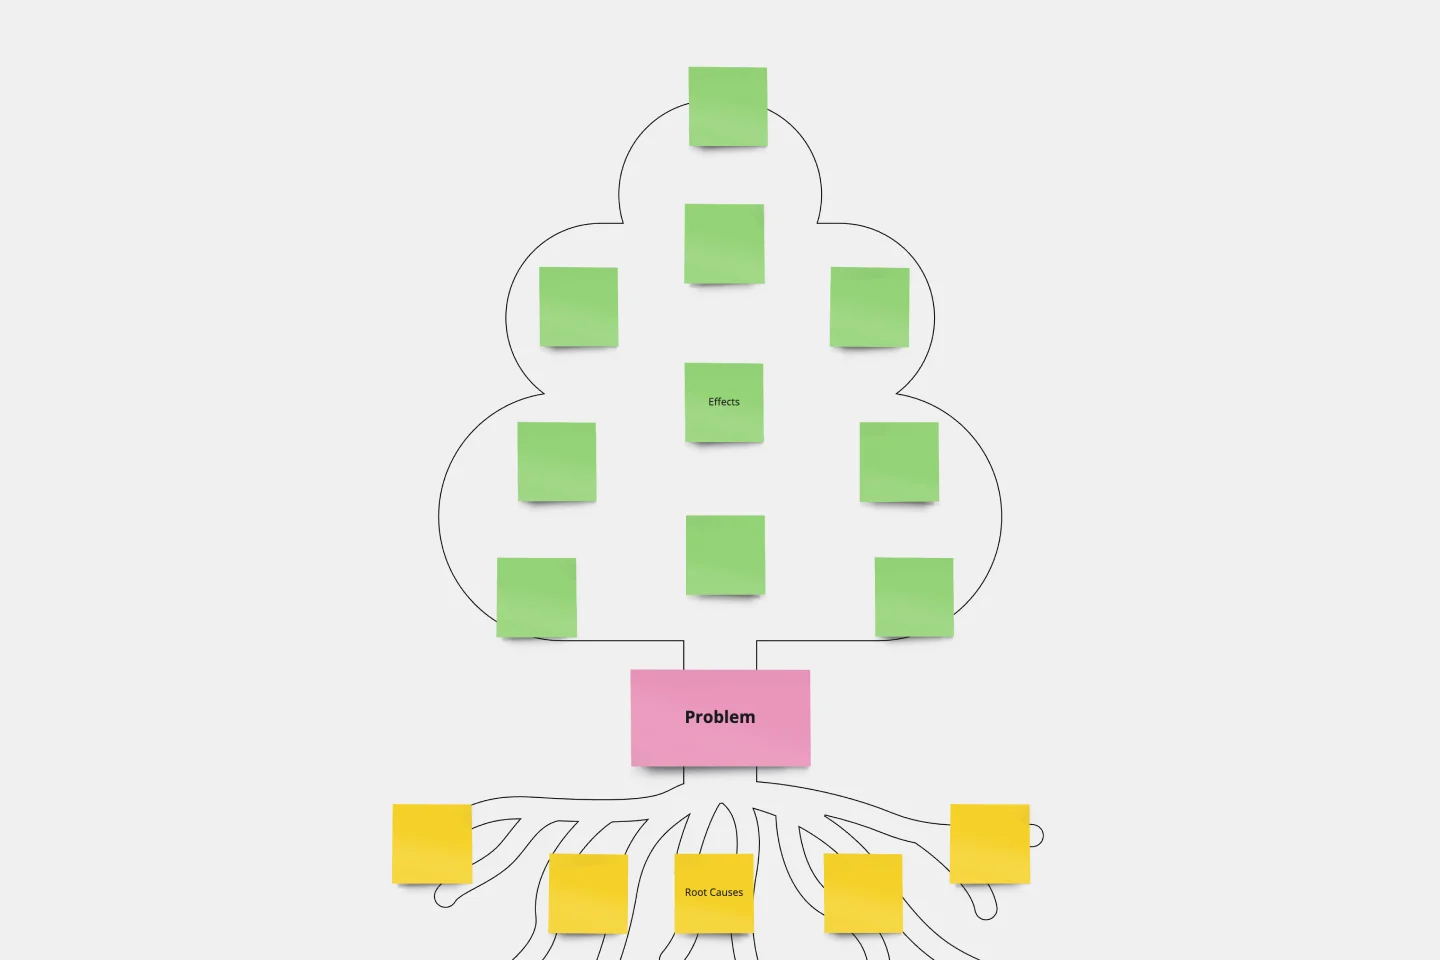
Problem Tree Template
Works best for:
Strategy & Planning
The Problem Tree Template is a visual tool crafted to examine a primary issue, its consequential effects, and its foundational causes. Picture it: The tree's trunk embodies the central dilemma, its branches display the direct ramifications, and the roots delve into the underlying reasons. By organizing a challenge in such an illustrative manner, users can comprehensively grasp their situation.
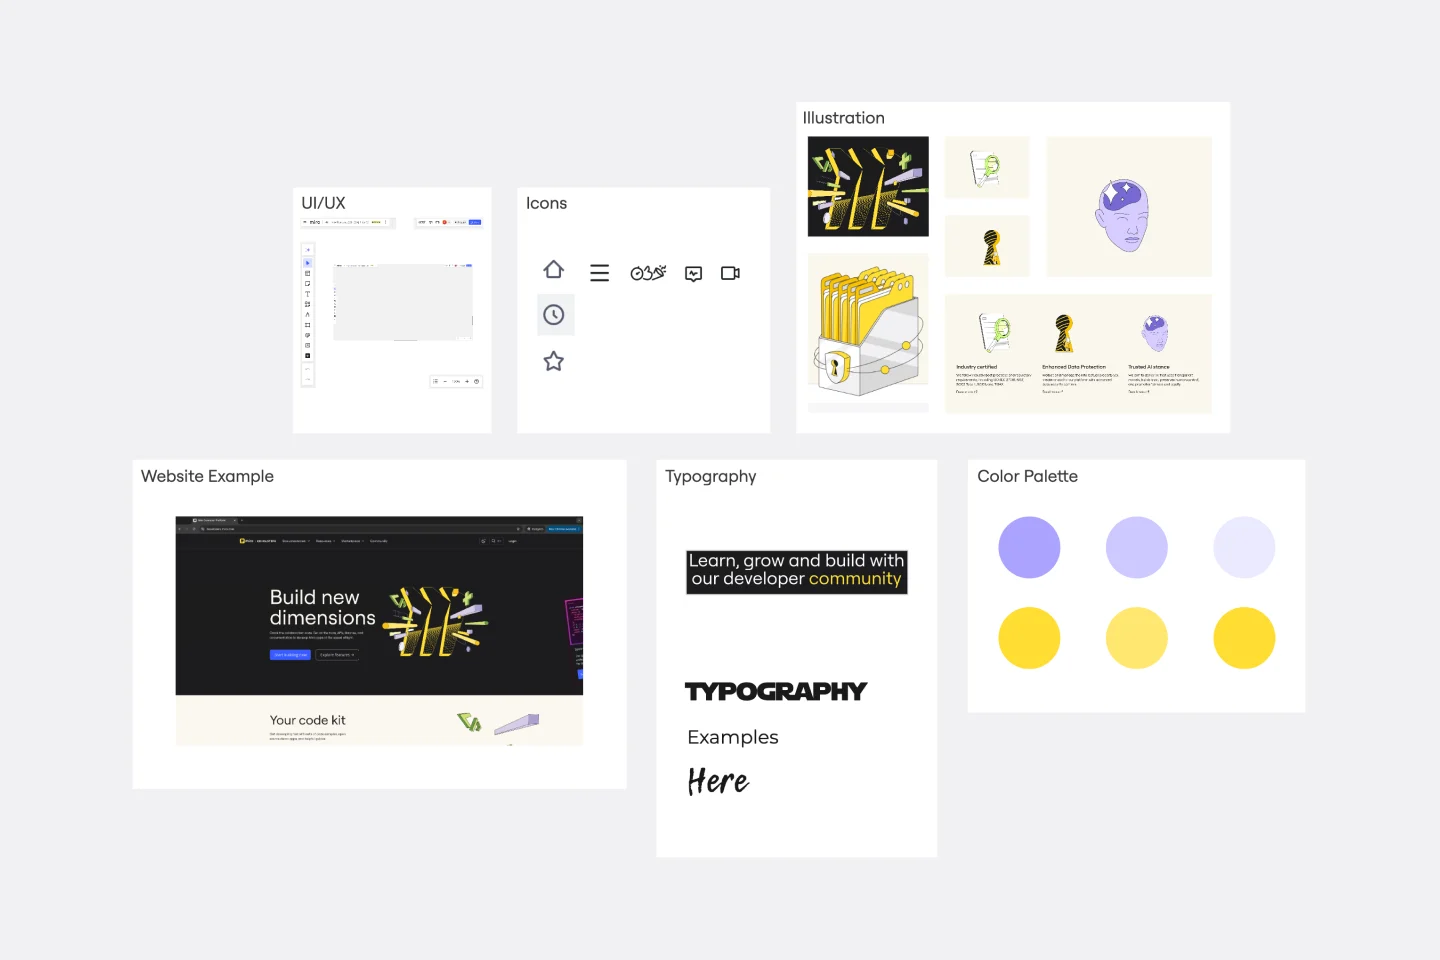
Mood Board Template
Works best for:
Design, Brainstorming, Ideation
When you’re kicking off a creative project, it’s sometimes important to communicate the mood you’re trying to evoke — but it’s so hard to do it with words. So create a mood board and use images, color palettes, textures, and typography. Mood boards are also perfect for gathering inspiration and sketching out and pitching ideas, and they’re not just for designers — your content writers, sales teams, and product teams can use them too, and this template makes it easy for all of you to get started.
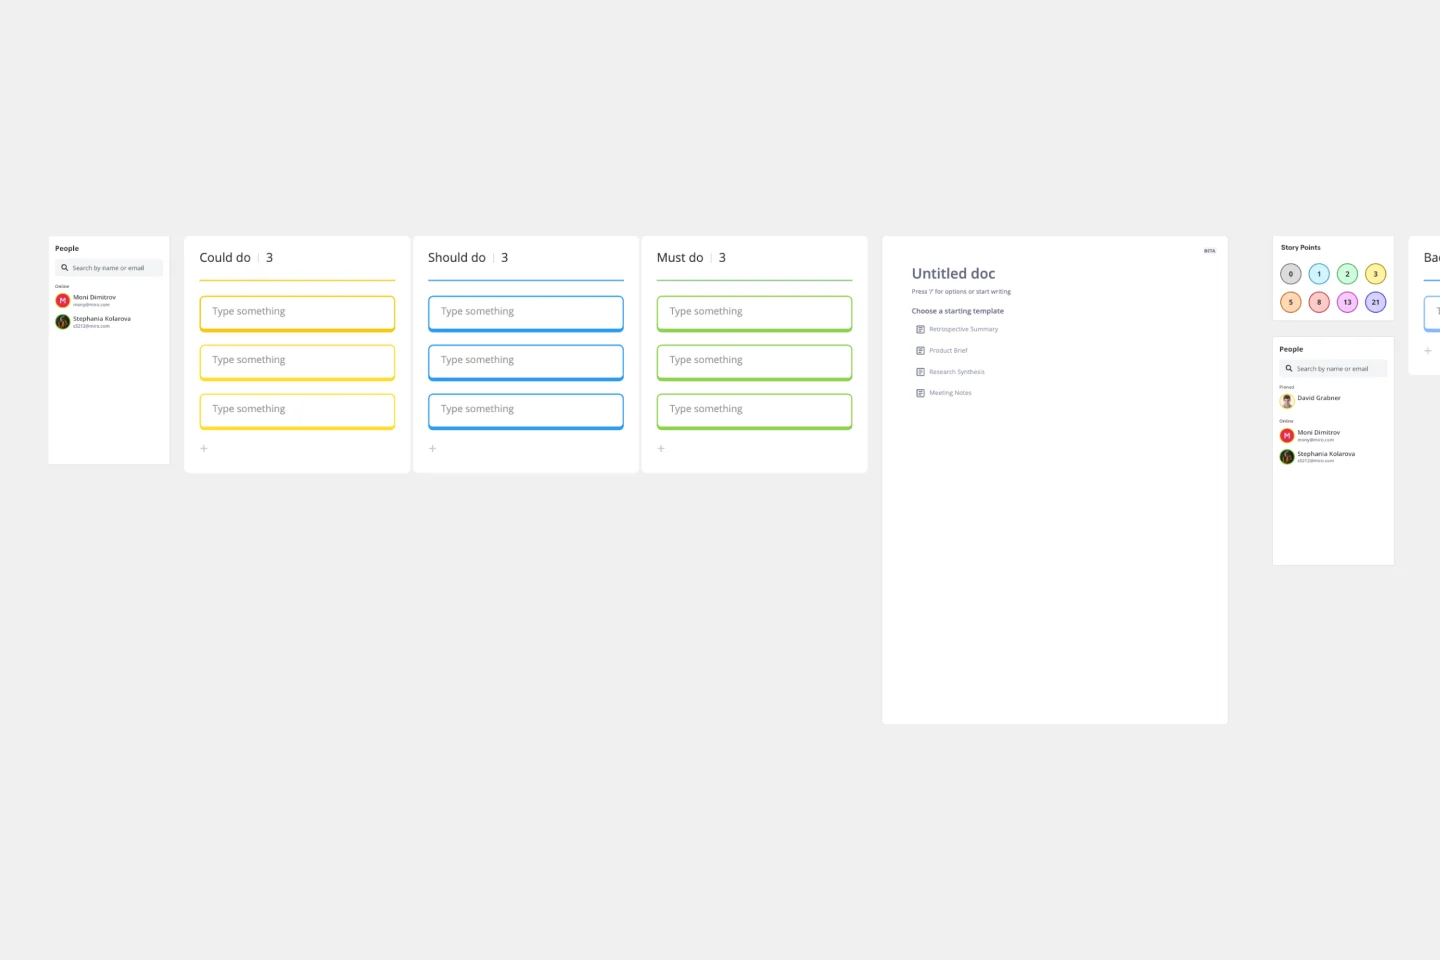
Idea Funnel Backlog
Works best for:
Design, Brainstorming, Agile Workflows
An Idea Funnel Backlog enables you to visualize your backlog and restrict the number of backlogged items at the top. In doing sos, you can prioritize items on your list without having to engage in unnecessary meetings or create too much operational overhead. To use the Idea Funnel Backlog, break up the funnel into different phases or treat it like a roadmap. Use the Idea Funnel Backlog as a hybrid model that combines your roadmap and backlog into one easily digestible format.
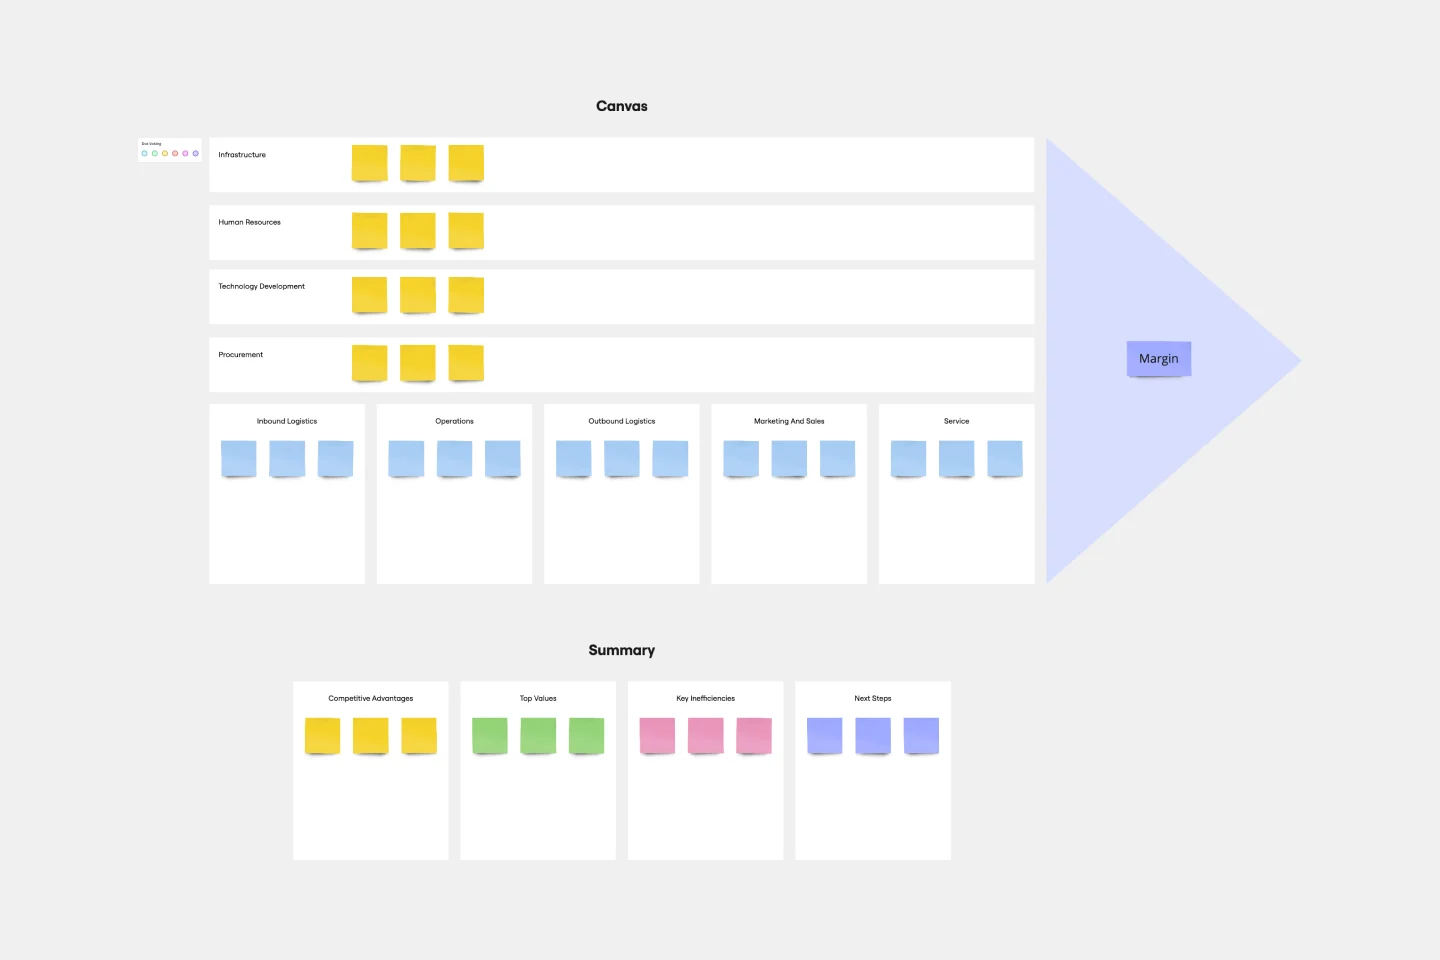
Value Chain Analysis Template
Works best for:
Leadership, Strategic Planning, Workflows
First coined by Harvard Business School professor Michael Porter, the value chain analysis helps your team evaluate your business activities so you can find ways to improve your competitive advantage. A value chain is a set of activities that a company performs in order to deliver a valuable product from start to finish. The analysis itself allows your team to visualize all the business activities involved in creating the product—and helps you identify inefficiencies, bottlenecks, and miscommunication within the process.
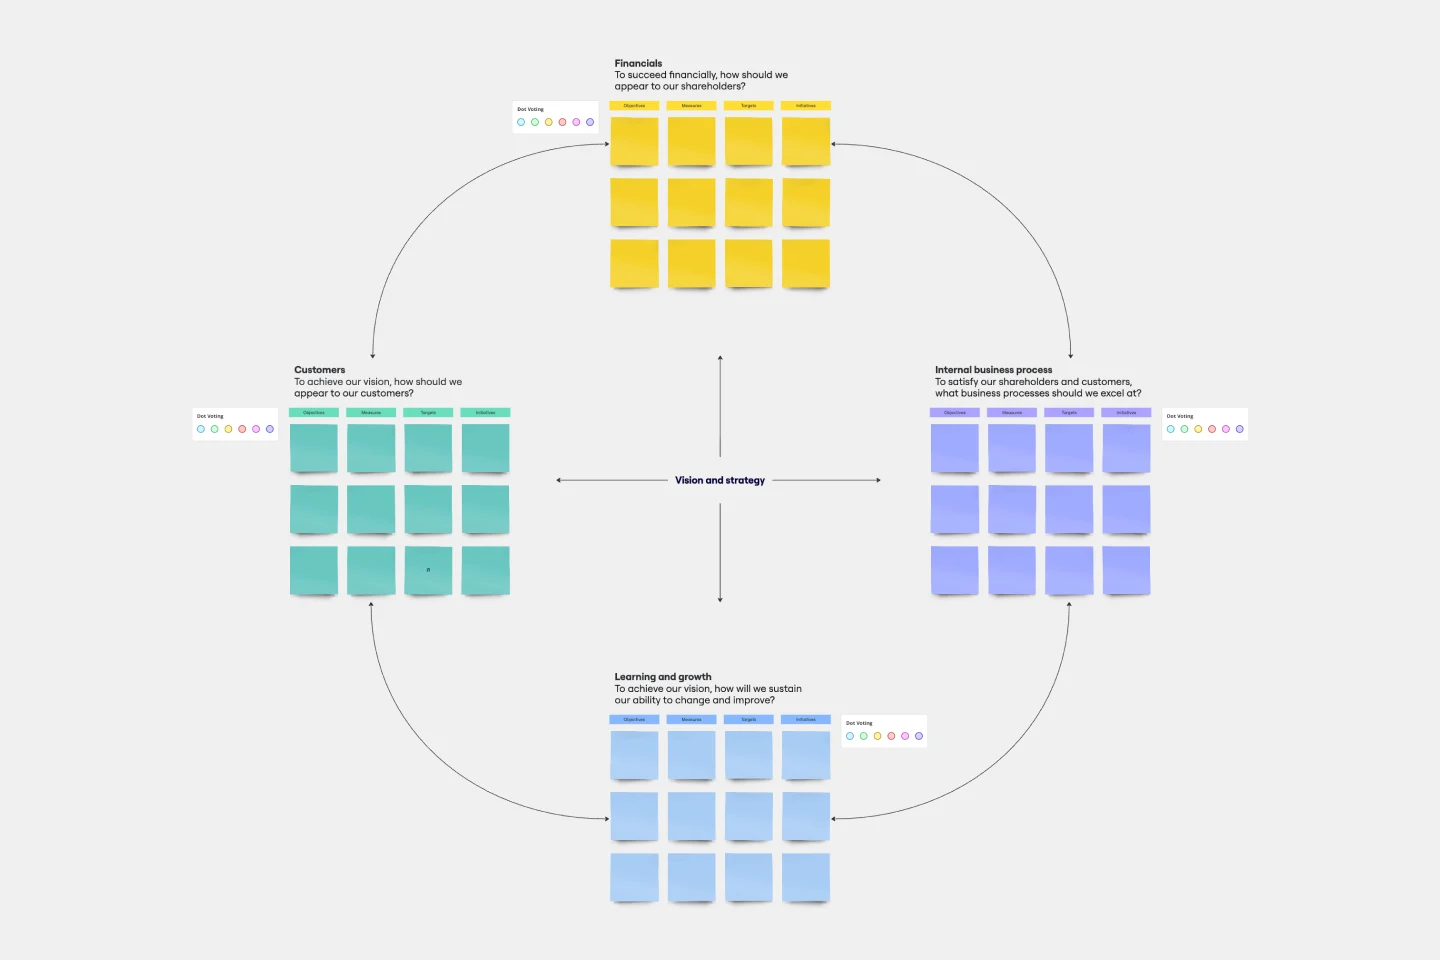
Balanced Scorecard Template
Works best for:
Operations, Strategic Planning, Project Planning
Balanced scorecards are useful tools for understanding business performance at a glance with regard to customers, employees, business processes, and financial progress. Learn more about BSCs and create your own using Miro’s Balanced Scorecard template.
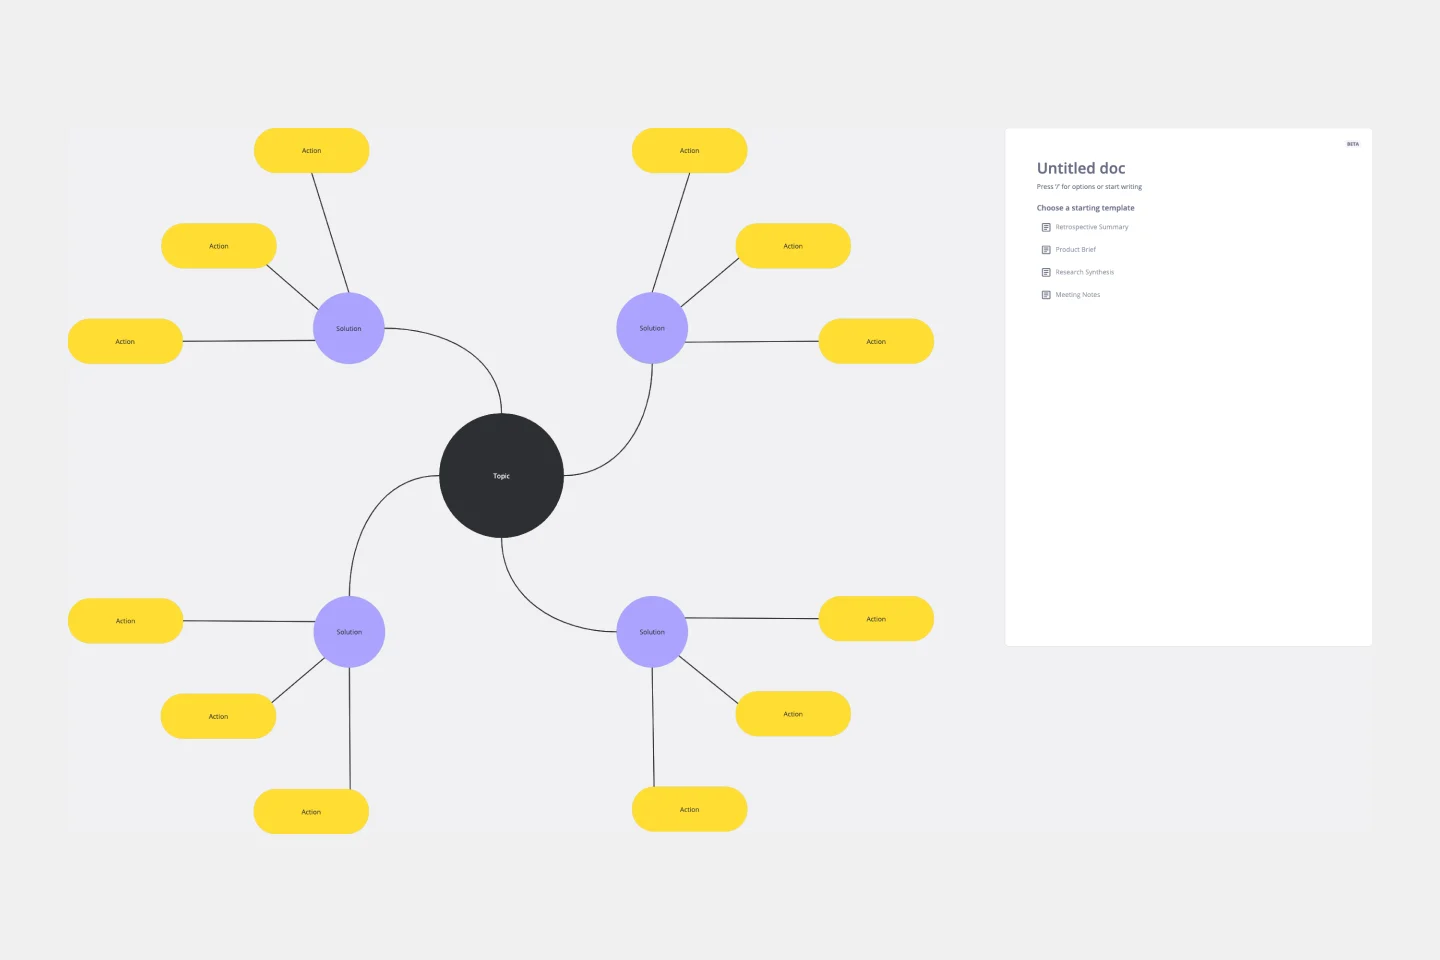
Spider Diagram Template
Works best for:
Diagramming, Mapping
Perfect for brainstorming sessions, project planning, or simply organizing thoughts, the Spider Diagram Template allows you to create 'legs' branching out from a central idea, representing related topics or subtopics.