
Venn Diagram for Product Development
The Venn Diagram for Product Development template is a powerful tool designed to help teams align user needs with business goals.
The Venn Diagram for Product Development template is a powerful tool designed to help teams align user needs with business goals. By visually mapping out these two critical areas and identifying their intersections, this template facilitates a clearer understanding of where efforts should be focused for maximum impact.
Why Use This Template?
Clarify Priorities:
Visual Clarity: The template provides a simple, clear layout to help teams visually differentiate and prioritize user needs and business goals.
Focus Areas: It highlights the sweet spot where user needs and business goals overlap, showing areas that offer the highest potential for successful product development.
Enhance Collaboration:
Team Alignment: Use this template in meetings to ensure all team members and stakeholders are on the same page.
Interactive Tool: Perfect for interactive sessions, allowing teams to collaboratively identify and discuss key priorities.
Drive Decision-Making:
Informed Choices: Helps teams make data-driven decisions by clearly showing which features and initiatives meet both user needs and business goals.
Strategic Planning: Ideal for planning product features, enhancements, and roadmaps with a balanced approach.
Ease of Use:
Pre-Labeled Sections: Comes with pre-labeled sections for "User Needs," "Business Goals," and the overlap area, making it easy to get started.
Editable Placeholders: Includes editable placeholders for quick note-taking and brainstorming.
Versatile Application:
Adaptable: Suitable for various stages of product development, from initial brainstorming to detailed planning.
Reusable: Can be reused for different products or iterations, making it a valuable tool for ongoing development processes.
Use Cases:
Product Brainstorming: Identify which features or enhancements to prioritize based on user feedback and business objectives.
Strategy Meetings: Align product strategy with overall business goals and customer demands.
Feature Planning: Plan and prioritize features that offer the best balance between user satisfaction and business success.
Team Workshops: Facilitate collaborative workshops to gather diverse perspectives and insights.
By using the Venn Diagram for Product Development template, teams can ensure a balanced and comprehensive approach to product planning, leading to more effective and successful outcomes.
Get started with this template right now.
Bang for the Buck Template
Works best for:
Project Management, Strategic Planning, Prioritization
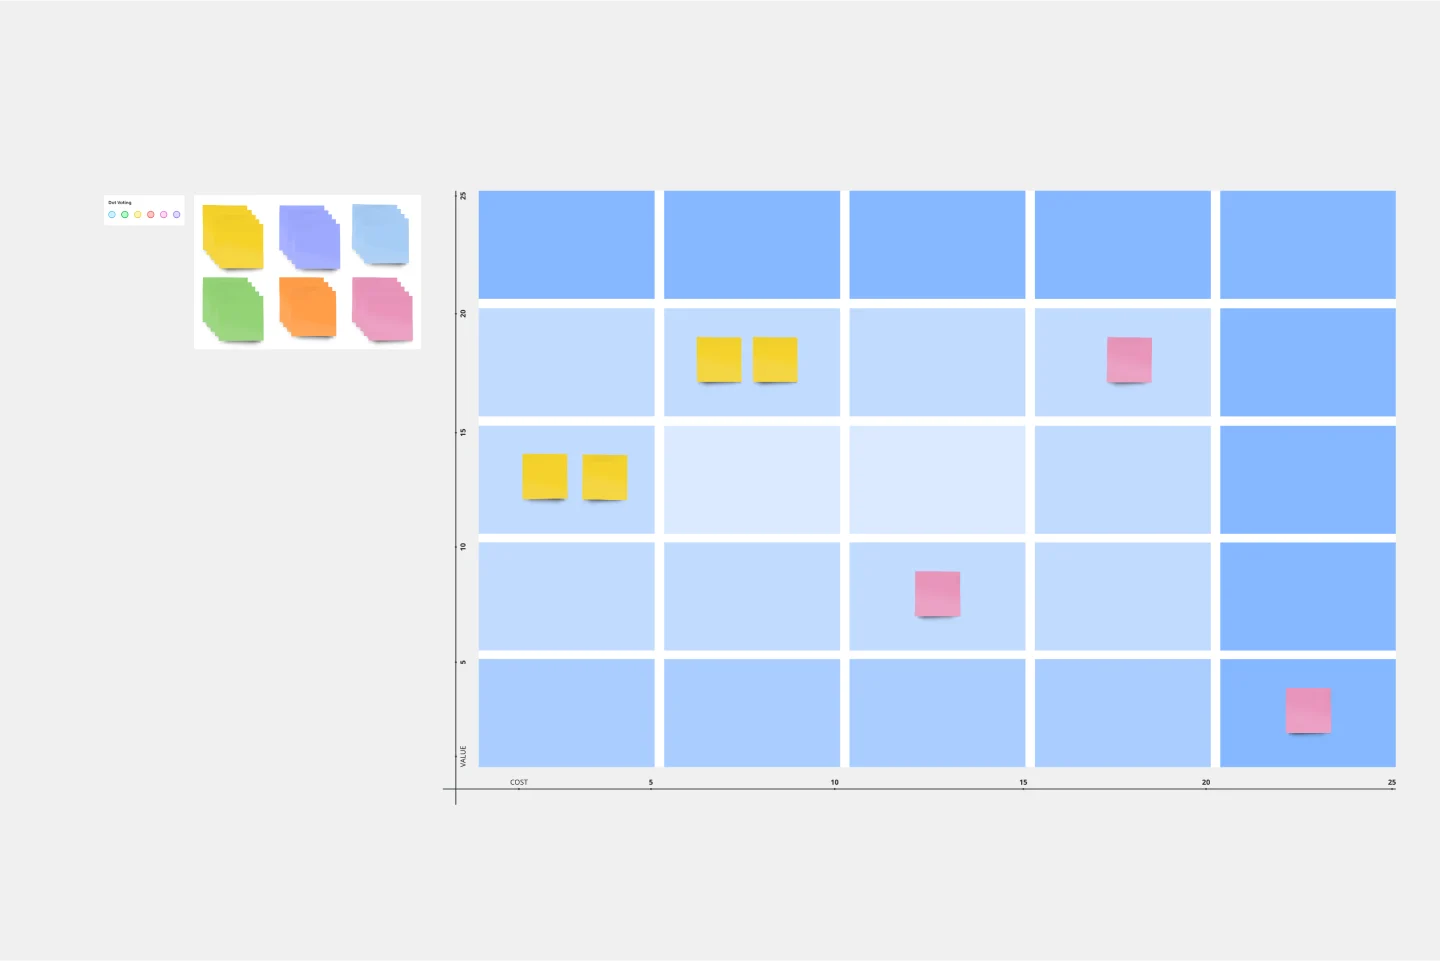
The name pretty much says it—this Agile framework is all about helping you maximize efficiency by powering collaboration between product managers and dev teams. Together you can go over each to-do on the project agenda and evaluate them in terms of costs and benefits. That way you can prioritize tasks based on how much bang for your buck they deliver. This template is great for teams and organizations that want to make a strategic plan to tackle an upcoming sprint.
2x2 Prioritization Matrix Template
Works best for:
Operations, Strategic Planning, Prioritization
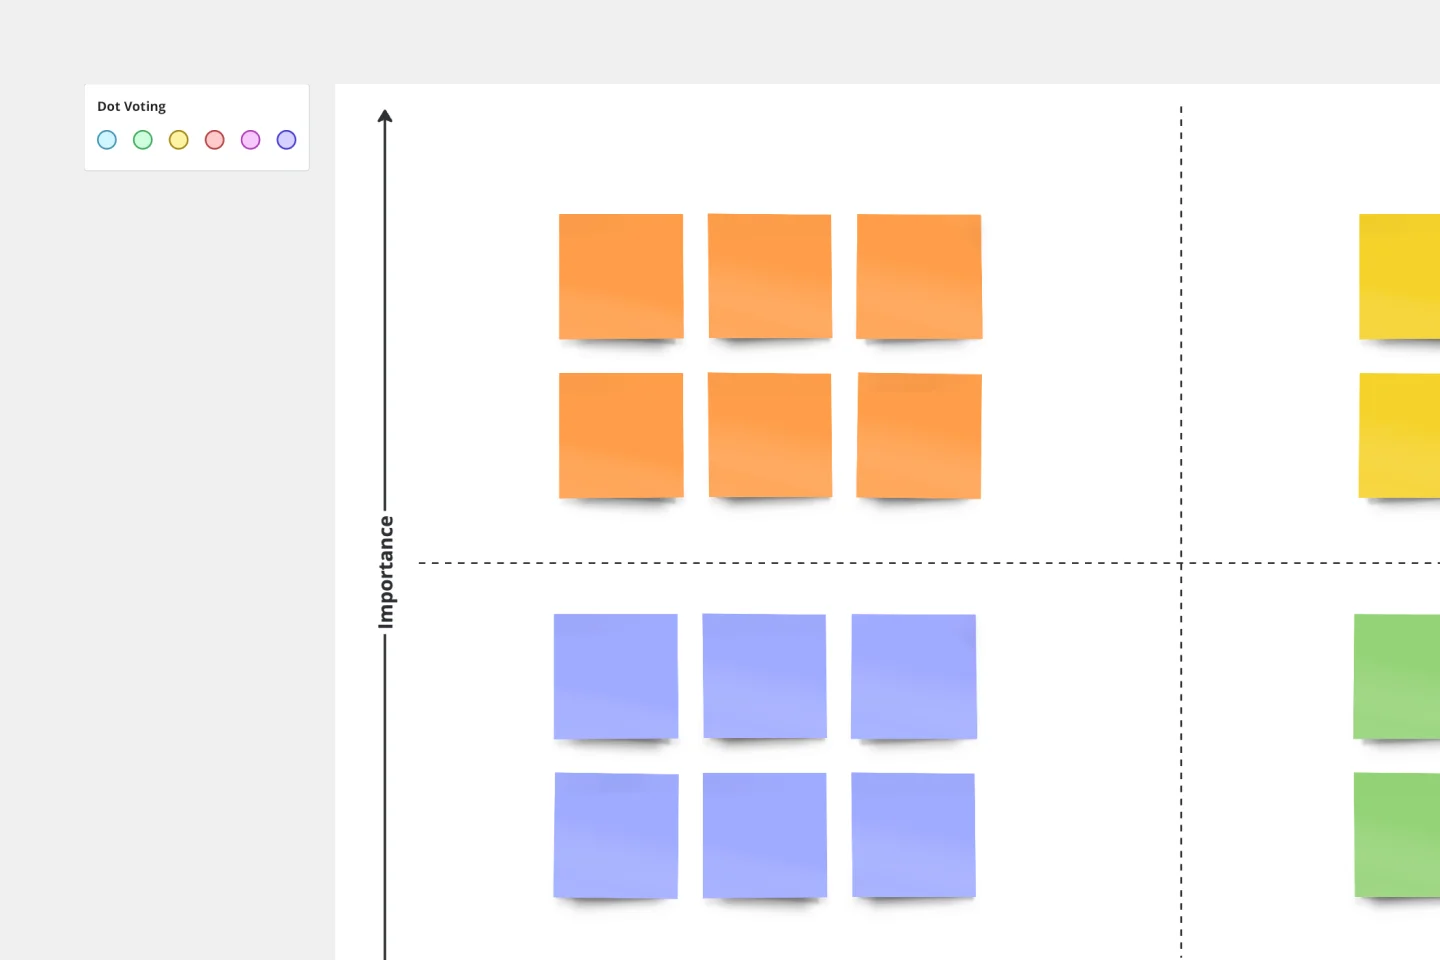
Ready to set boundaries, prioritize your to-dos, and determine just what features, fixes, and upgrades to tackle next? The 2x2 prioritization matrix is a great place to start. Based on the lean prioritization approach, this template empowers teams with a quick, efficient way to know what's realistic to accomplish and what’s crucial to separate for success (versus what’s simply nice to have). And guess what—making your own 2x2 prioritization matrix is easy.

Product Development Gantt Chart
Works best for:
Gantt Chart, Planning
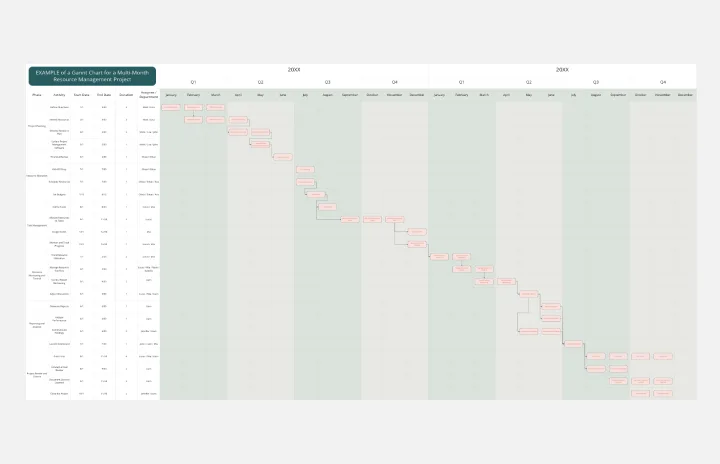
Developing a new product involves many steps and stakeholders. The Product Development Gantt Chart template helps you manage this complex process efficiently. Use it to outline each phase of development, set timelines, and assign responsibilities. Track progress and make adjustments as needed to stay on schedule. This template provides a clear visual representation, coordinating tasks for a successful product launch.
Resource Management Gantt Chart
Works best for:
Strategy, Planning
Efficient resource allocation is crucial for project success. The Resource Management Gantt Chart template helps you plan and manage your resources effectively. Use it to track the availability and allocation of personnel, equipment, and materials throughout your project. This template ensures resources are optimally utilized, reducing waste and avoiding delays, providing a clear overview of assignments and workload balance.
Root Cause Analysis (RCA) Template
Works best for:
Strategy, Planning
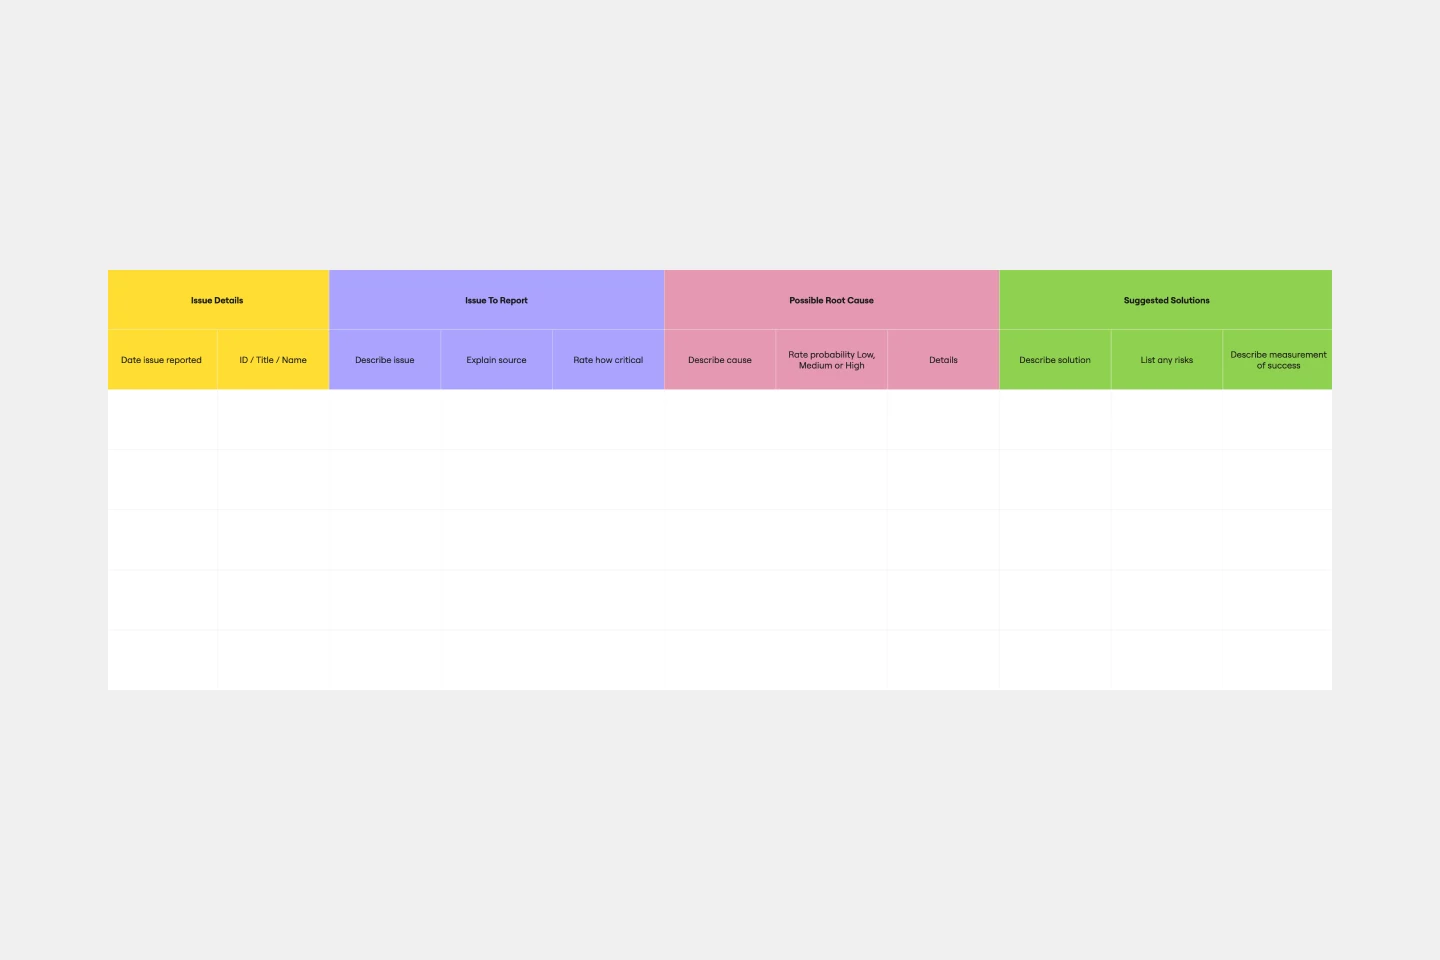
The Root Cause Analysis (RCA) Template is a structured tool that helps teams uncover the underlying reasons behind specific problems or events. By pinpointing and addressing these root causes, rather than just treating the symptoms, organizations can foster long-term solutions and prevent recurring challenges, leading to more efficient and sustainable operations.
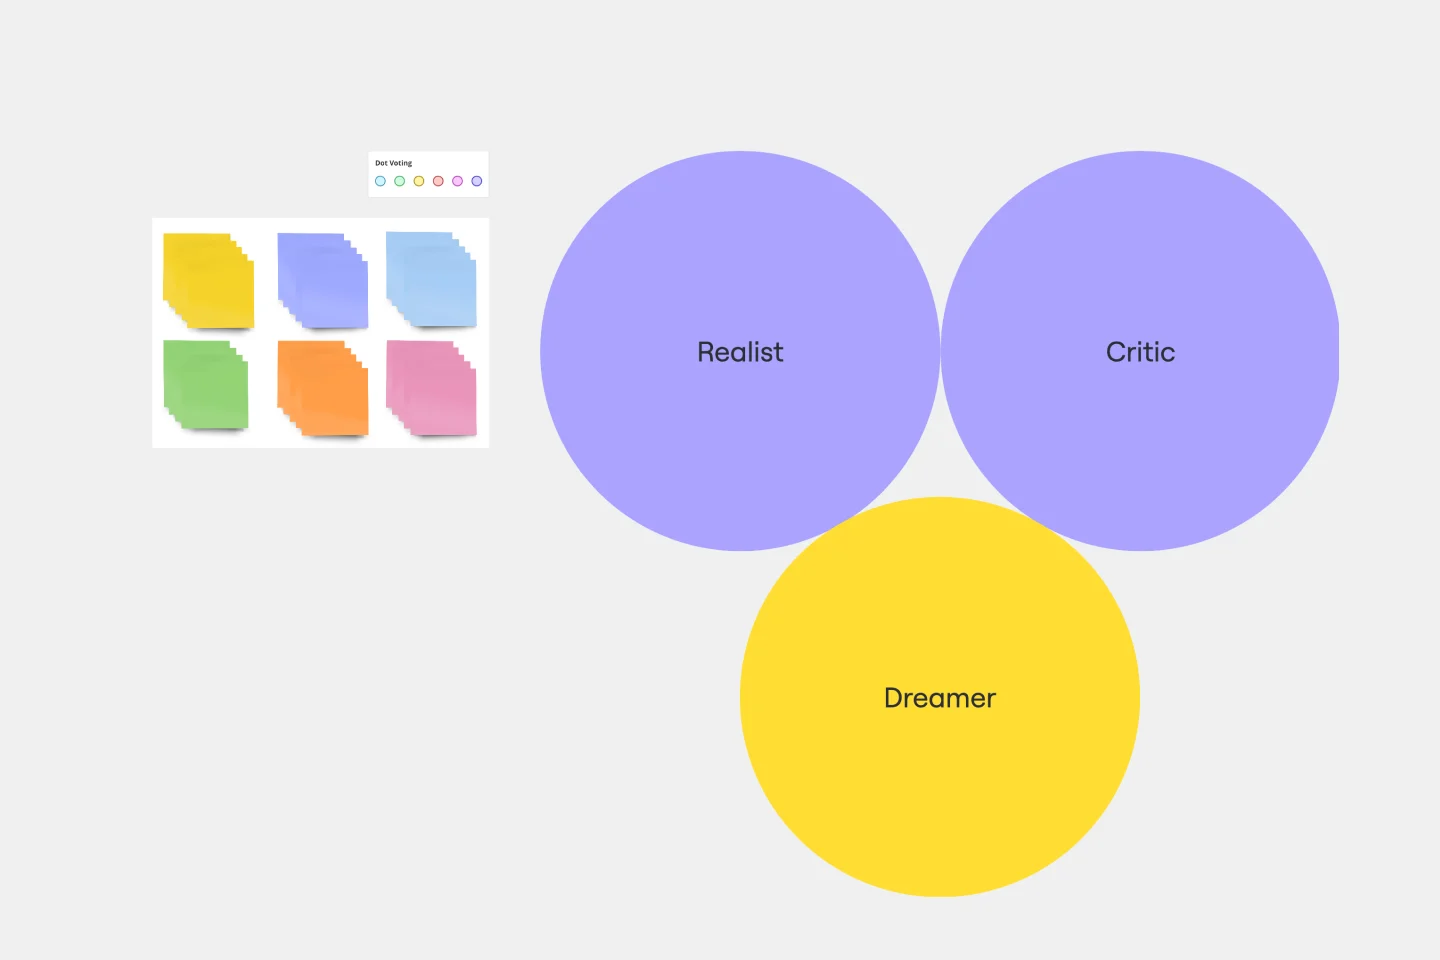
Disney Creative Strategy Template
Works best for:
Business Management, Ideation, Brainstorming
Know who knew a little something about coming up with ideas that set imaginations alight? Walt Disney. And he inspired the Disney Creative Strategy, an approach that establishes three types of thinkers—dreamers, realists, and critics—and gives each the space to do clear thinking. Your team will go through an engaging exercise of adopting the three mindsets, where they’ll focus on a specific aspect of the idea. The Disney Creative Strategy has a way of yielding brilliant ideas and great products. That’s why it’s used successfully by organizations of all kinds and sizes.