
Venn Diagram for Learning and Education
A Venn diagram is a graphical representation that shows similarities and differences between items, concepts or data.
Overview
A Venn diagram is a graphical representation that shows similarities and differences between items, concepts or data. They utilize shapes, often circles, to illustrate relationships and compare data.
Venn diagrams are certainly one of the most well-known types of diagrams. This design, featuring a series of simple circles or ellipses or rectangles that overlap is ubiquitous. The overlapping region of a Venn diagram indicates similarities while others showcase differences. Although the Venn diagram was created to describe mathematically logical relationships, it’s now used to show all types of relationships.
Uses of Venn Diagrams in Education and Learning
Venn diagrams are powerful visual tools used in education and learning to represent relationships between different sets of information. They consist of overlapping circles, each representing a set, with the overlaps illustrating the commonalities between the sets. Here are several key uses of Venn diagrams in the educational context:
1. Concept Comparison and Contrast
One of the primary uses of Venn diagrams is to help students compare and contrast concepts, ideas, or objects. By placing different characteristics in separate circles and common attributes in the overlapping areas, students can easily visualize similarities and differences. This method enhances critical thinking and helps in organizing thoughts more systematically.
2. Classifying Information
Venn diagrams are useful for classifying information into distinct categories. This is particularly helpful in subjects like science, where students need to categorize living organisms, chemical elements, or geological formations based on specific characteristics.
3. Analyzing Relationships
They assist in analyzing complex relationships between multiple sets of data. This analysis can be crucial in subjects such as mathematics, where students learn about set theory and probability.
4. Problem Solving
In problem-solving scenarios, Venn diagrams help break down problems into manageable parts, making it easier to identify solutions. They allow students to visually organize information, which can lead to a better understanding and resolution of the problem.
5. Curriculum Development
Educators use Venn diagrams to develop curricula by mapping out overlaps between different subject areas. This helps in creating interdisciplinary lessons that integrate concepts from multiple fields of study.
6. Enhancing Memory and Recall
Visual aids like Venn diagrams enhance memory retention and recall by providing a clear and concise way to display information. The visual format makes it easier for students to remember relationships between different pieces of information.
7. Facilitating Discussions and Debates
Venn diagrams serve as effective tools for facilitating classroom discussions and debates. They provide a structured way for students to present and organize their ideas and arguments.
8. Promoting Collaborative Learning
In group activities, Venn diagrams encourage collaborative learning by allowing students to collectively brainstorm and organize their thoughts. This fosters teamwork and enhances communication skills.
Three examples from the above areas have been created to help you understand the application of the Venn diagram in the Education and Learning domain.
Good Luck
Khawaja Rizwan
Get started with this template right now.

Fishbone Diagram for Marketing
Works best for:
Fishbone diagram
Identifying the root causes of marketing challenges is essential for effective strategy development. The Fishbone Diagram for Marketing template helps you systematically explore factors affecting your marketing efforts. Categorize potential causes into areas such as market research, product positioning, promotional strategies, and distribution channels. This structured analysis enables your team to pinpoint and address issues, optimizing marketing campaigns.
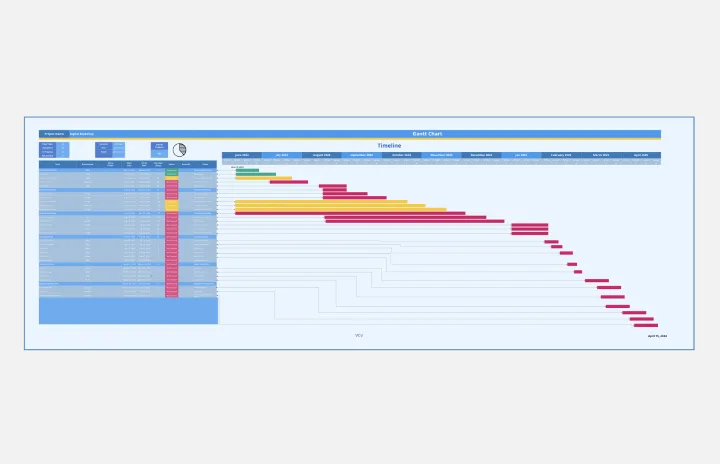
Gantt Chart Project
Works best for:
Strategy, Planning
The Gantt Chart Project template is a versatile tool for managing various types of projects. It provides a clear visual timeline of your project's tasks, deadlines, and dependencies. Use it to plan, execute, and monitor your project's progress, ensuring all activities are aligned and on track. This template enhances team collaboration, improves time management, and helps address potential bottlenecks for successful outcomes.
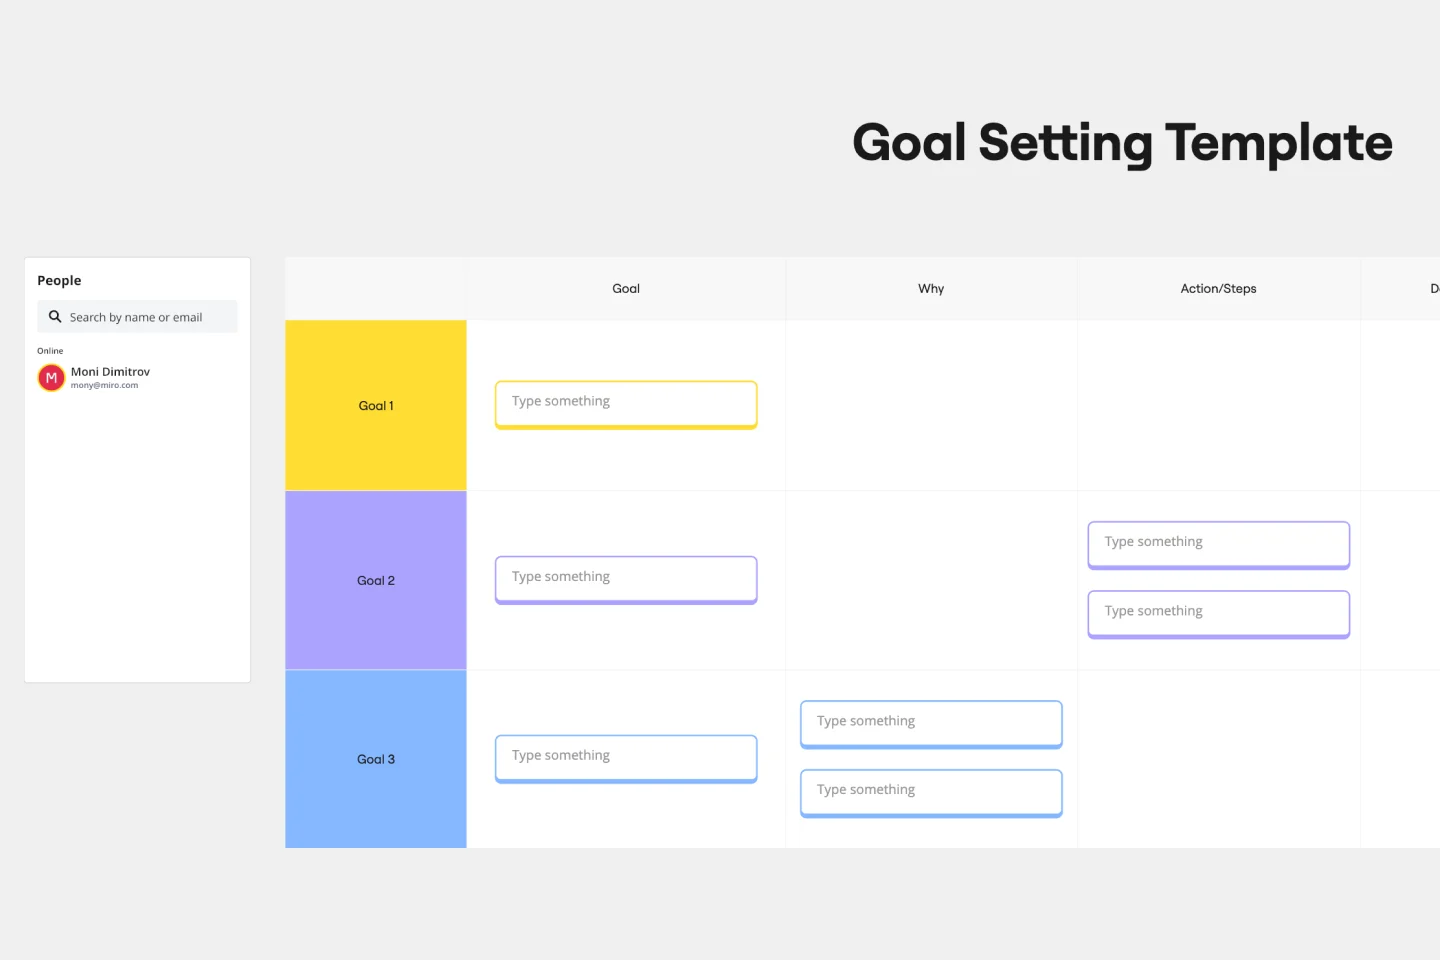
Goal Setting Template
Works best for:
Strategic Planning
The Goal Setting Template simplifies the process and fosters strategic thinking. It includes key fields such as goal articulation, rationale, action steps, and blockers. This promotes accountability with a "Date Started" field and a clear deadline. The template turns aspirations into actionable plans with a heightened sense of accountability.
OKR Planning Template
Works best for:
Strategic Planning, Meetings, Workshops
The OKR Planning template helps you turn exhaustive OKR sessions into dynamic and productive meetings. Use this template to make OKR planning more interactive, guiding your team through the session with creative Ice Breakers and Brainstorms, so you can co-create your OKRs and define the key results and action plans to achieve them.

How Now Wow Matrix Template
Works best for:
Ideation, Product Management, Prioritization
There are no bad ideas in a brainstorm — but some are more original and easier to implement. The How Now Wow matrix is a tool that helps you identify and organize those great ideas, as well as reinvigorates your team to think creatively and take risks (a taller order as you scale). Grab this template to create your own matrix, then rank the ideas you generated in a brainstorm as “How” (difficult to implement), “Now” (easy to implement), or “Wow” (both original and easy to implement).
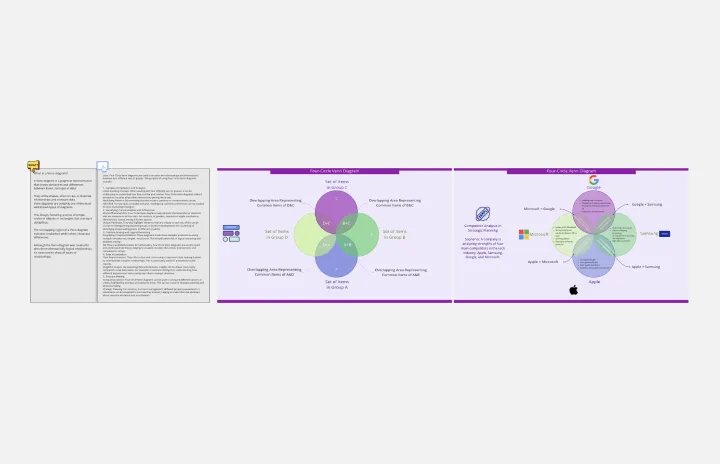
Four-Circle Venn Diagram
Works best for:
Venn Diagram
The Four Circle Venn Diagram template is designed for comparing four sets of data. Use this tool to identify commonalities and differences across multiple categories. This template is ideal for complex data analysis, strategic planning, and academic research. It helps you visually organize information, making it easier to understand and communicate insights. Perfect for educators, researchers, and professionals in need of detailed comparison tools.