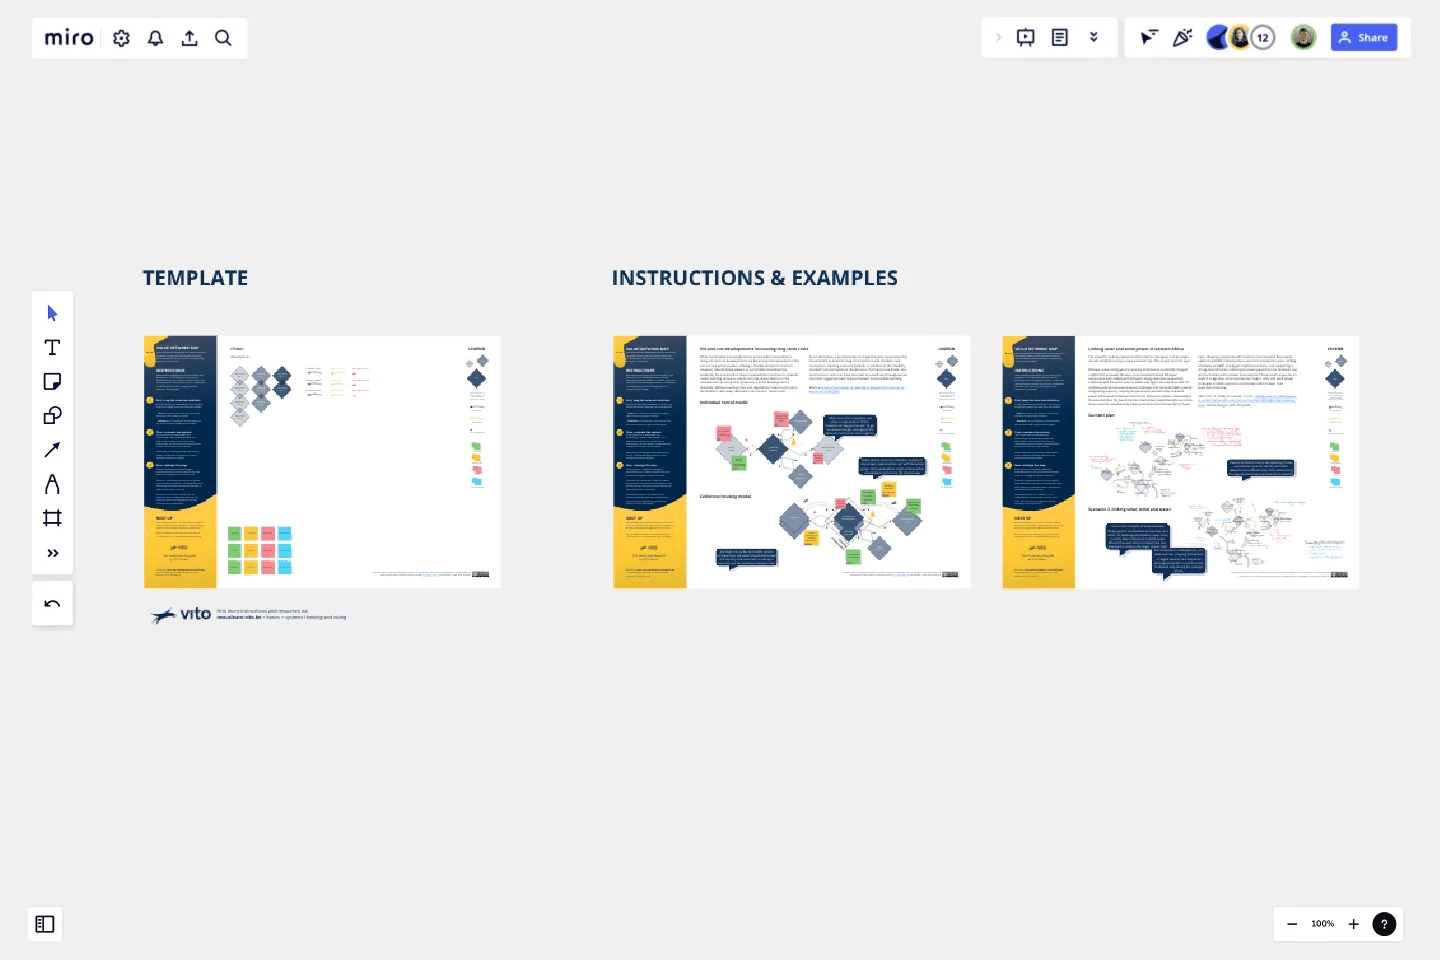
Value Network Mapping (1.0)
By unraveling and reimagining how value is created or lost within a system, you can uncover the keys to assist individuals and organizations in reorganizing themselves sustainably.
By unraveling and reimagining how value is created or lost within a system, you can uncover the keys to assist individuals and organizations in reorganizing themselves sustainably.
Value network mapping does not come with a rigid procedure; it's an adaptable method, typically involving two phases. Initially, it renders a map of the existing situation. Second, you and your stakeholders can build upon that map, making a profound evaluation and redesign.
This template offers a 3-step instruction, providing you with the basic building blocks to copy, and two inspiring examples. Let's begin mapping together!
Get started with this template right now.
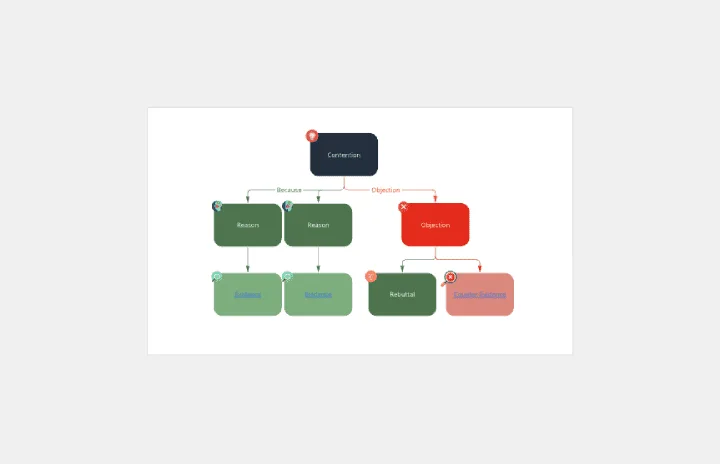
Argument Map
Works best for:
Diagramming
The Argument Map template is a visual tool for structuring and analyzing arguments and debates. It provides a structured framework for capturing premises, conclusions, and logical relationships. This template enables teams to explore complex issues, identify strengths and weaknesses in arguments, and make informed decisions. By promoting clarity and critical thinking, the Argument Map template empowers teams to navigate debates and discussions effectively, fostering consensus and understanding.
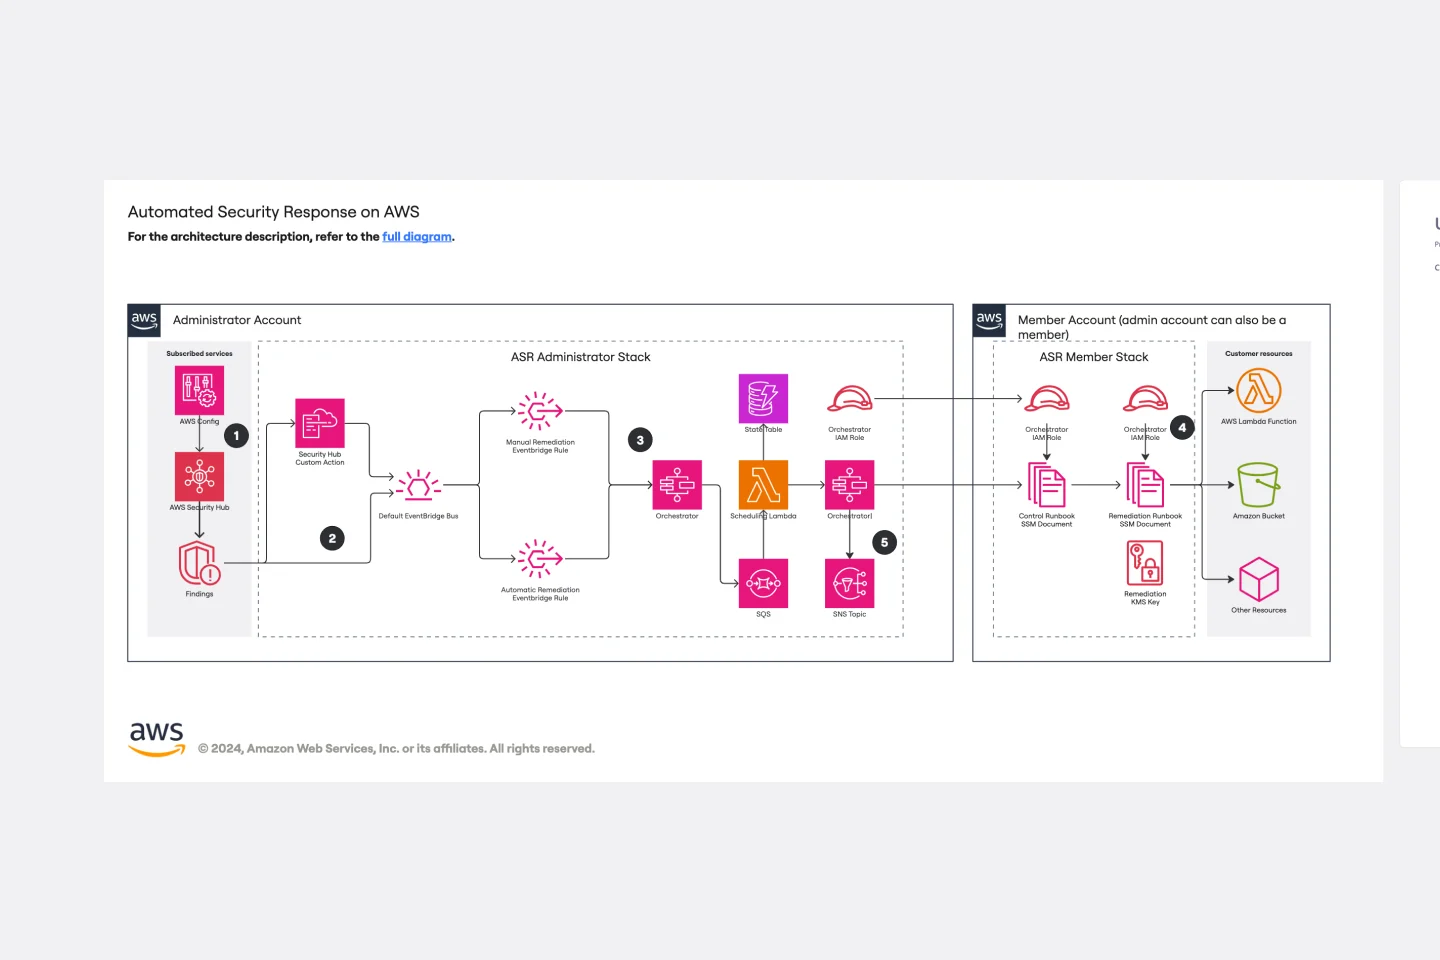
Automated Security Response on AWS Template
Works best for:
AWS
The Automated Security Response on AWS template is a tool for enhancing AWS security through automation, enabling quick identification and mitigation of threats with minimal manual effort. It integrates with AWS security services for a dynamic response mechanism, ensuring infrastructure security against evolving threats. This template streamlines operational efficiency, offers scalable and customizable security strategies, and accelerates threat response times, making it essential for improving AWS security posture.
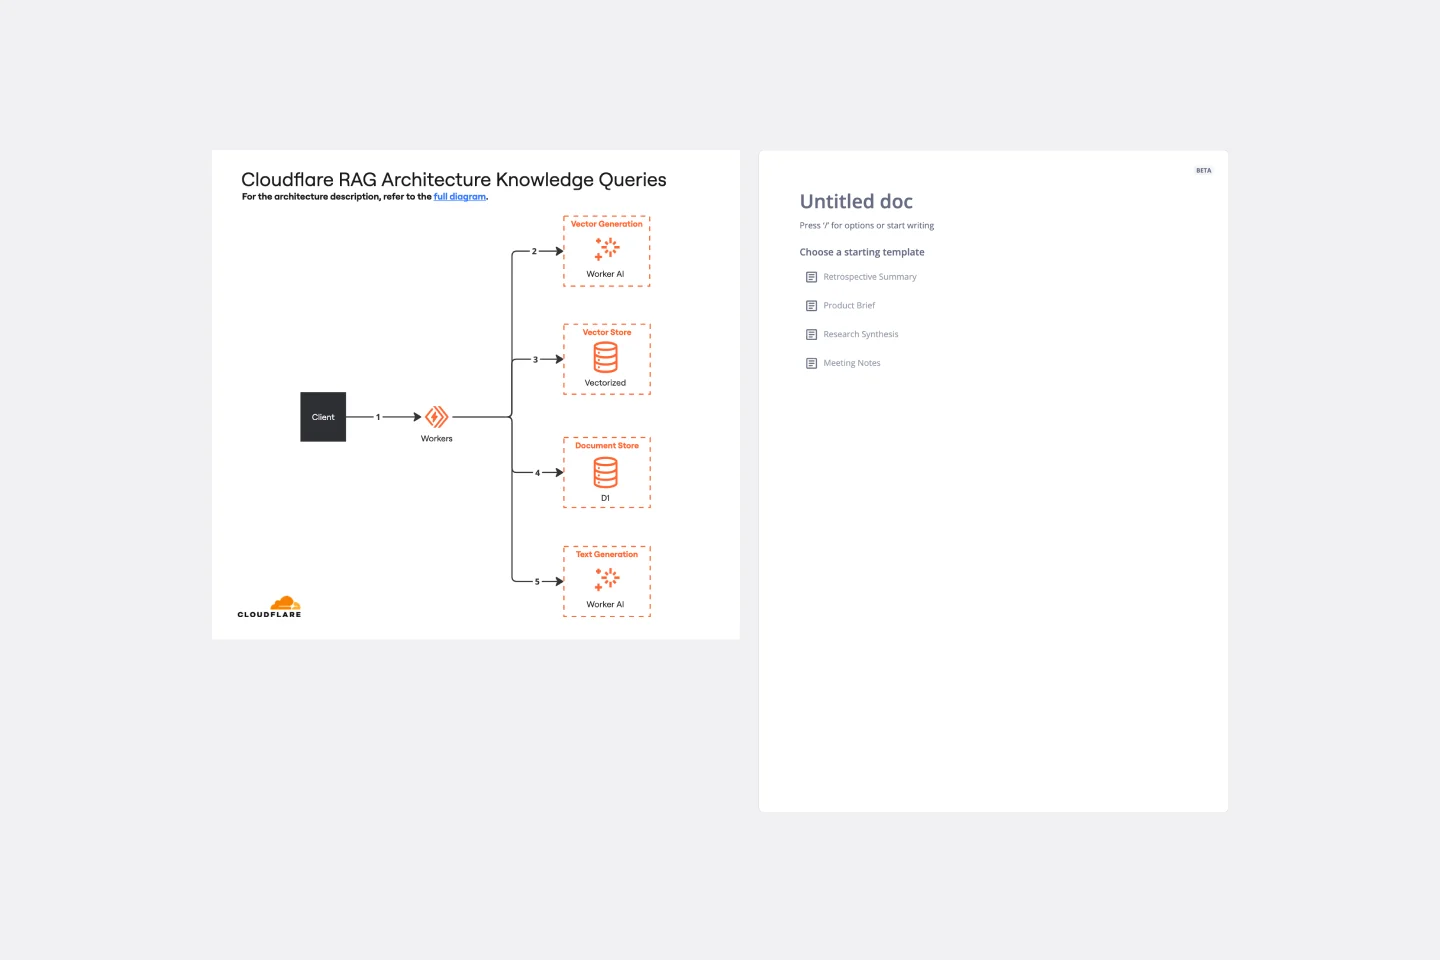
Cloudflare RAG Architecture Knowledge Queries Template
The Cloudflare RAG Architecture Knowledge Queries template is a cutting-edge tool designed to streamline the process of diagramming and understanding the intricate architecture of Cloudflare's Retrieval Augmented Generation (RAG) system. This template is a boon for teams aiming to visualize, query, and optimize Cloudflare's infrastructure collaboratively.
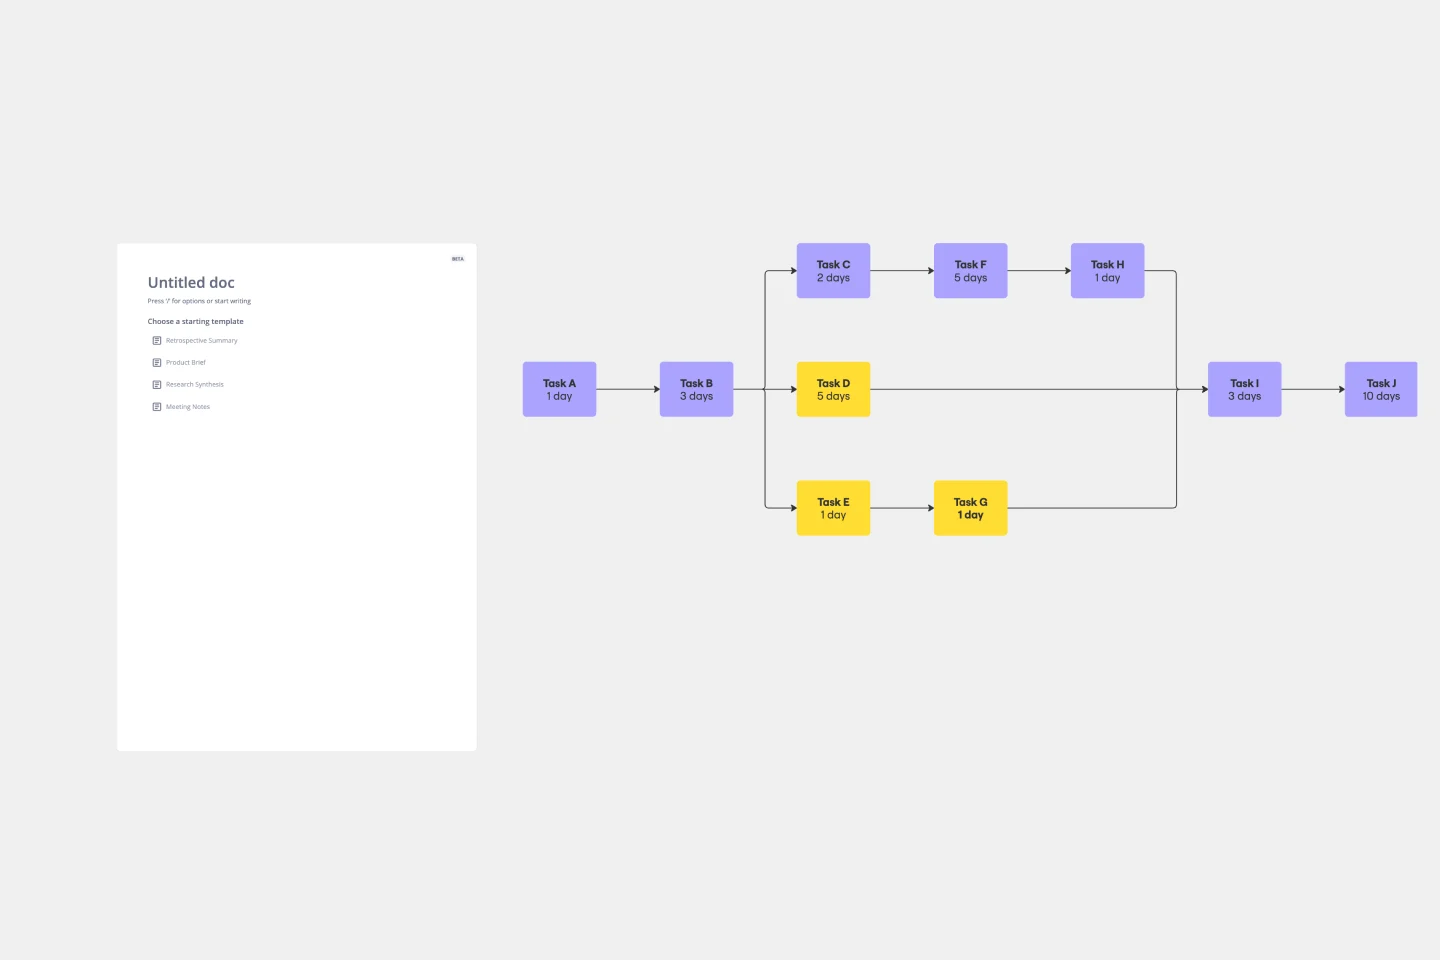
Critical Path Method Template
Works best for:
Diagramming, Project Management
Elevate your project management game with the Critical Path Method Template—an indispensable tool that brings clarity and precision to your project timelines. The template instantaneously adjusts as you edit tasks and dependencies, ensuring that your critical path is consistently up-to-date. This capability not only simplifies the complex process of project scheduling but also empowers your team to proactively respond to evolving project dynamics, fostering adaptability and efficiency throughout the project lifecycle.
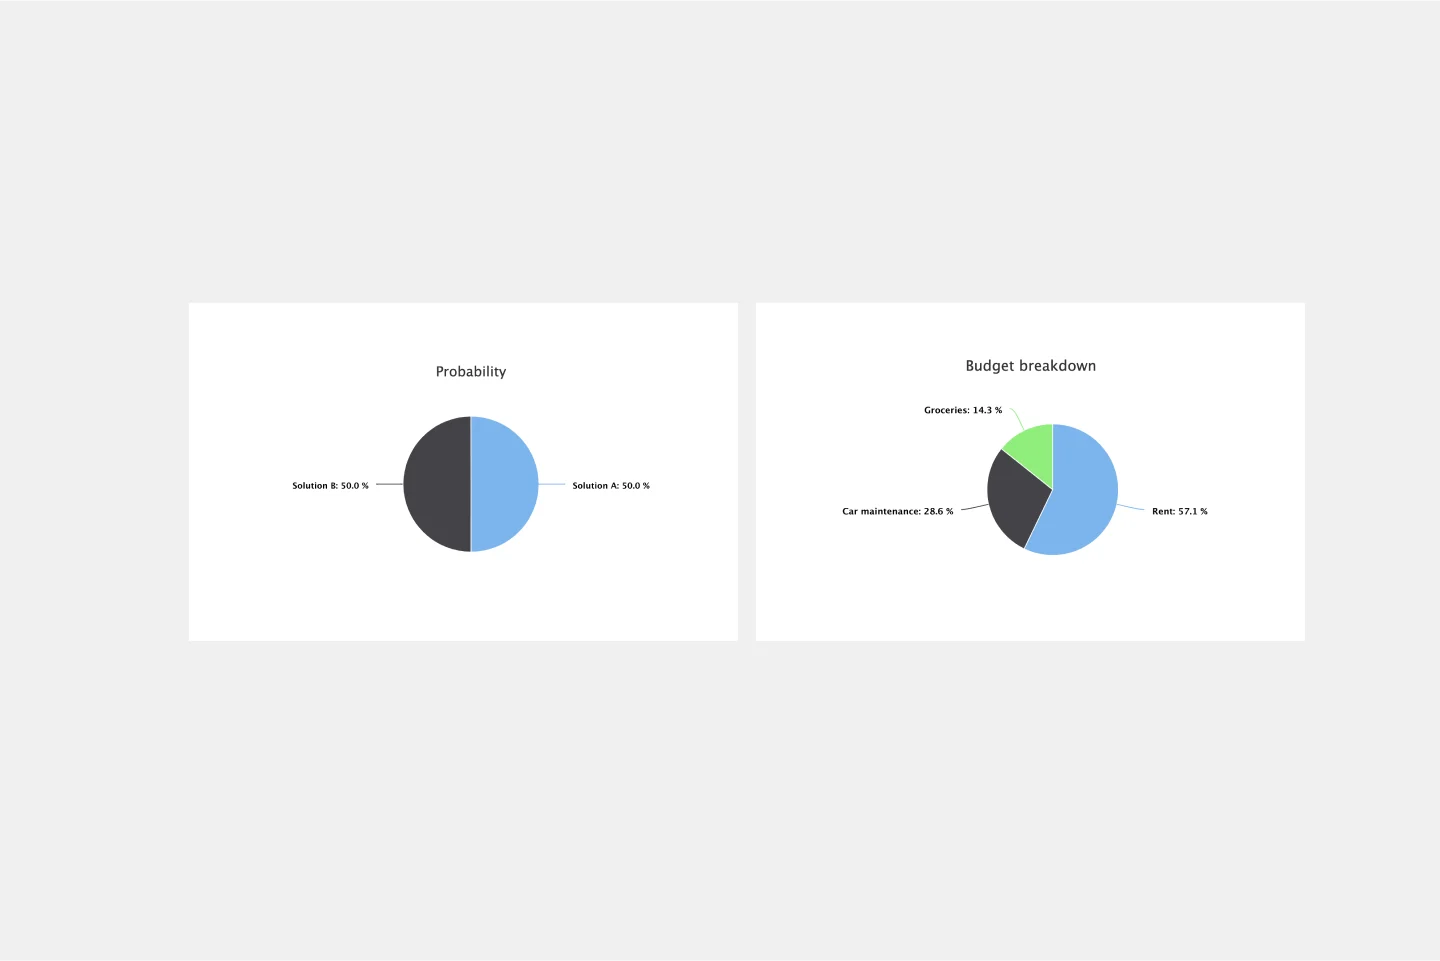
Pie Chart Template
Works best for:
Education, Operations
Pie charts are an excellent way to present relationships between datasets graphically, where you can quickly compare information and see contrast right away. Professionals from many fields use pie charts to support their presentations and enrich their storytelling as it’s one of the most commonly used data charts.
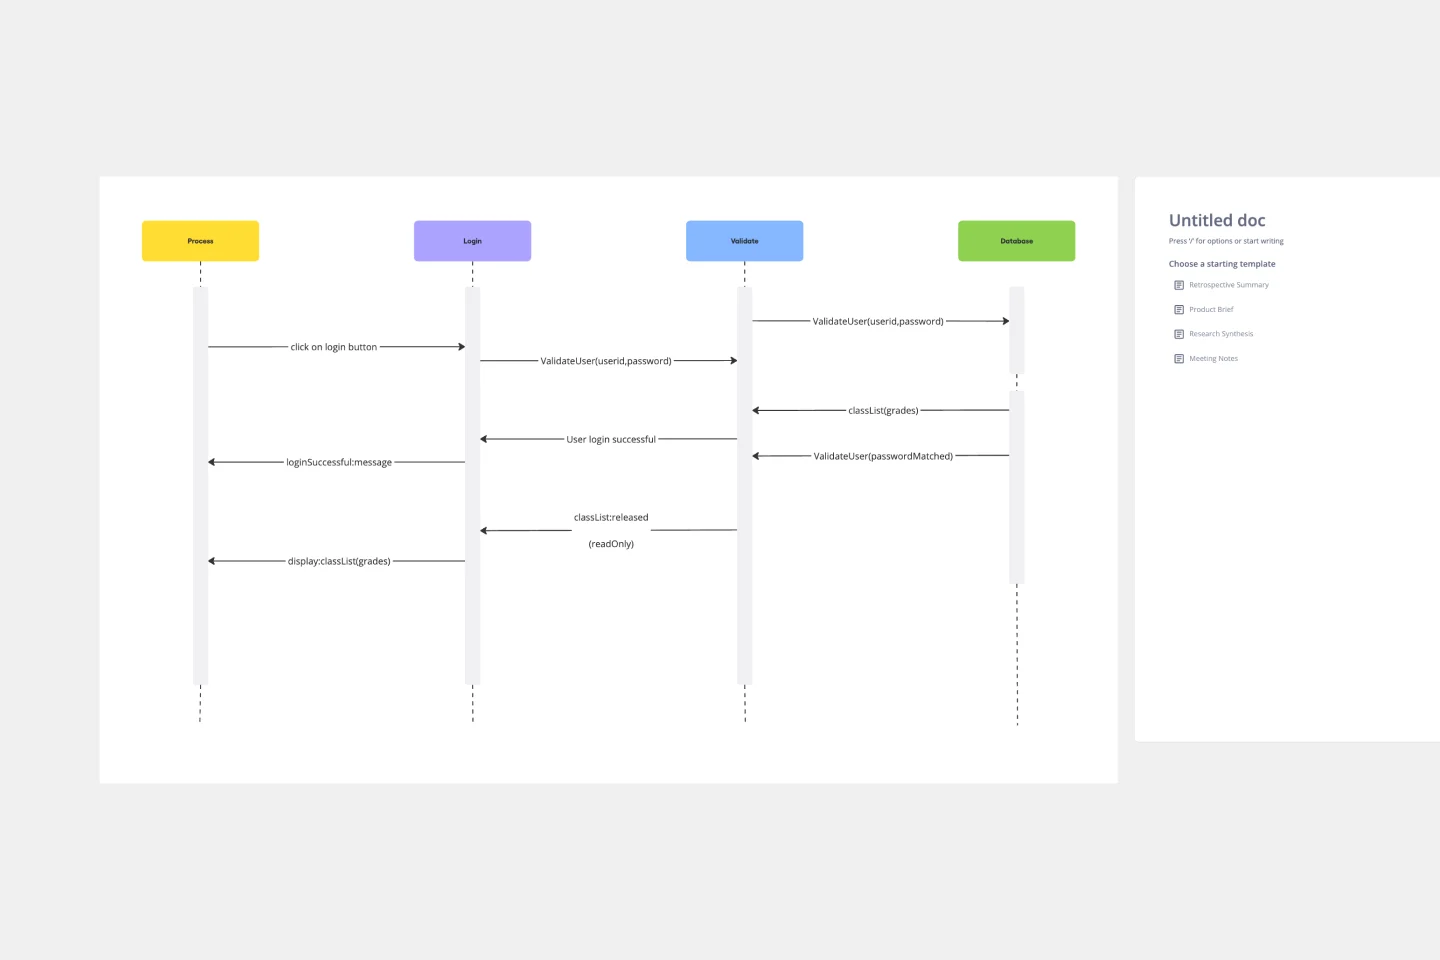
Login Sequence Diagram Template
Works best for:
Diagramming, Technical Diagramming
The UML Sequence Login Diagram Template is a valuable tool for visualizing user authentication processes. It breaks down complex login sequences into clear, visual components, facilitating collaborative understanding among team members, regardless of their technical expertise. This shared understanding is crucial for ensuring all stakeholders, from developers to project managers, are on the same page, leading to efficient decision-making and a smoother development process. The template's ability to translate technical details into an accessible format streamlines communication and significantly reduces the likelihood of misinterpretation or oversight, making it an essential asset in any software development project.