UML Use Case Diagram
Visualize system interactions with the UML Use Case Diagram. Map out user interactions and system processes for better planning.
About the [UML Use Case Diagram] template
Since the 1990's the Universal Modelling Language (UML) has been the lingua franca of how people document IT systems. It is an internationally recognized standard consisting of 14 diagrams in two categories: behavior diagrams (that document how systems work and interact) and structural diagrams (that document how systems are structured.
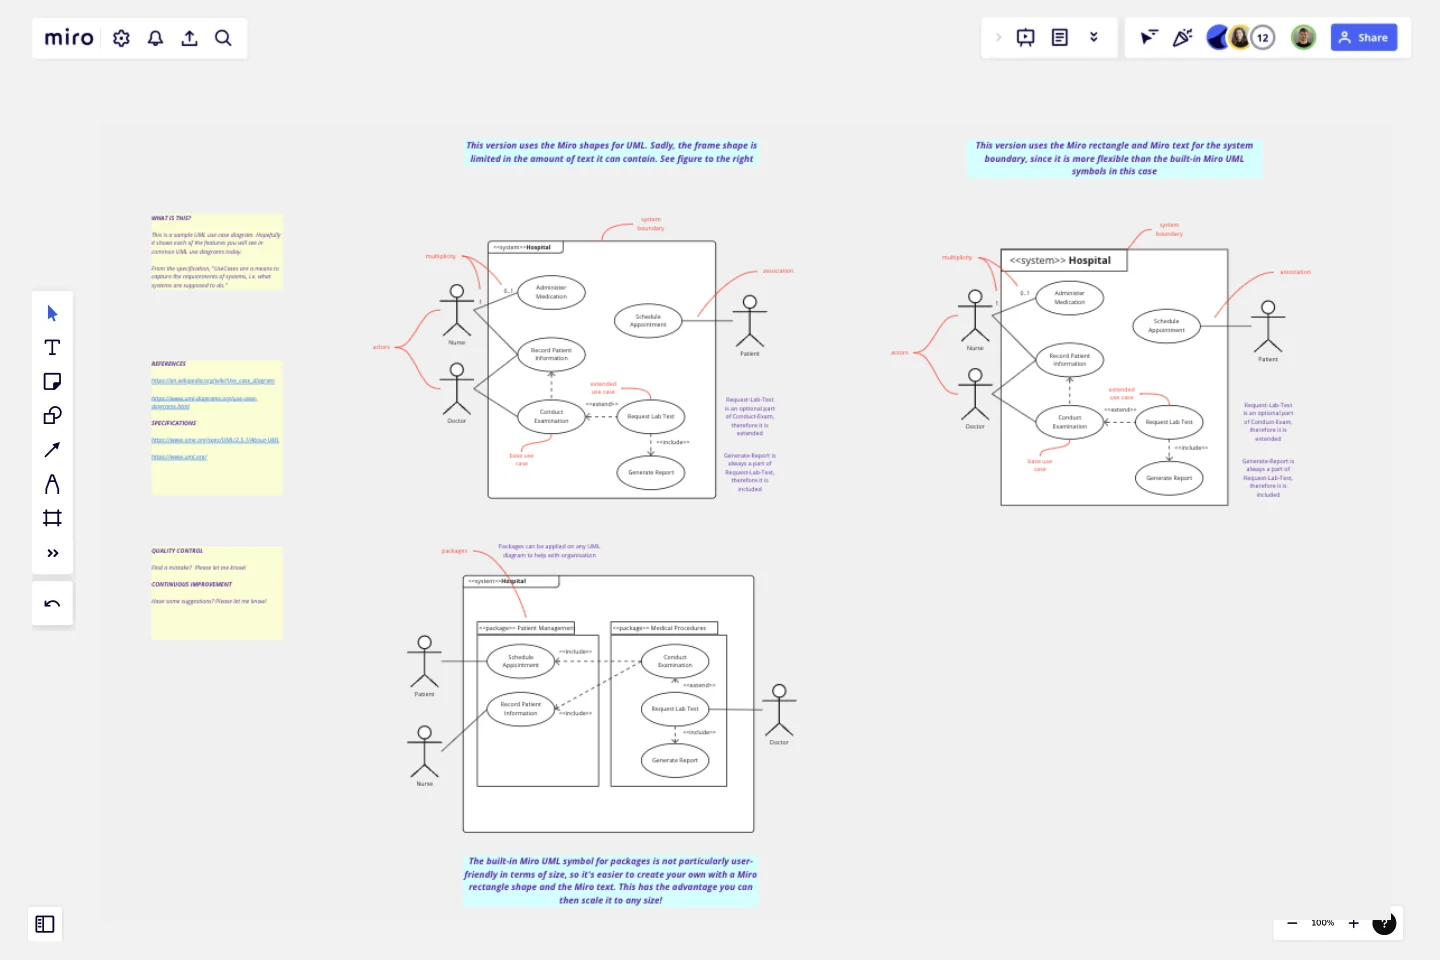
The UML Use Case Diagram is without doubt the most common behavioral diagram. It visually represents the functional requirements of a system, illustrating the interactions between users (actors) and the system to achieve specific goals (use cases).
Who can use this [UML Use Case Diagram] template
This template can be used by anyone who needs to create a UML Use Case Diagram.
How to use this [UML Use Case Diagram] template
This template contains two sample UML Use Case diagrams: one that has been created with Miro's built-in diagramming symbols, and one that uses some custom symbols. For simple diagrams, the built-in Miro symbols will probably work well. But in some cases (such as when the text is very long) not all the built-in Miro symbols will look as aesthetically pleasing as they could.
What this [UML Use Case Diagram] helps you accomplish
If you need to create a UML Use Case diagram, this template can hopefully make the job a bit easier and faster. Instead of starting from scratch, you can copy-and-paste this diagram into your own template and customize as you require.
Tips and best practices
Identify your actors and systems clearly
Keep it simple and high-level
Use descriptive names (e.g. "order pizza")
Take a goal-oriented approach. In other words, what goals do the actors have and what use cases are required for the actors to achieve their goals.
Feedback and Suggestions for Improvement are very welcome!
The author would be very grateful for any feedback and suggestions to improve this template!
Get started with this template right now.
AWS Control Tower Account Governance Template
Works best for:
AWS
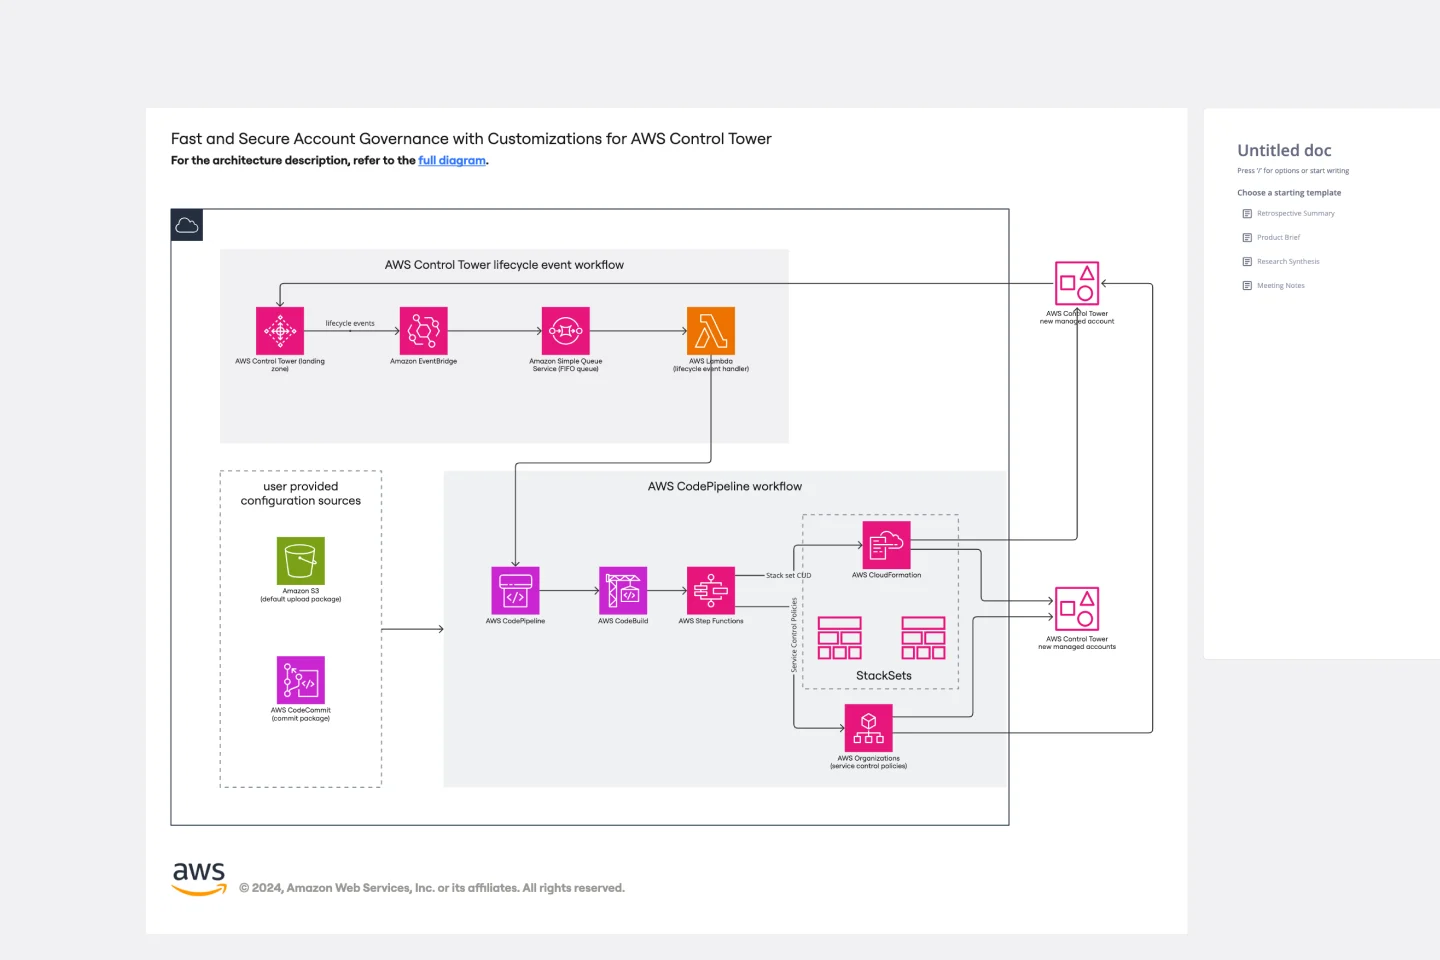
The AWS Control Tower Account Governance Template streamlines the setup and management of governance across multiple AWS accounts. It leverages AWS Control Tower to automate and simplify the governance process, ensuring that your AWS environment adheres to best practices for security, operations, and compliance. This template is highly customizable, allowing you to adjust governance controls and policies to meet the unique requirements of your organization. It provides a centralized view of your AWS environment, enhancing visibility and control, and scales with your organization as it grows.
Cloudflare Automatic Captioning for Video Template
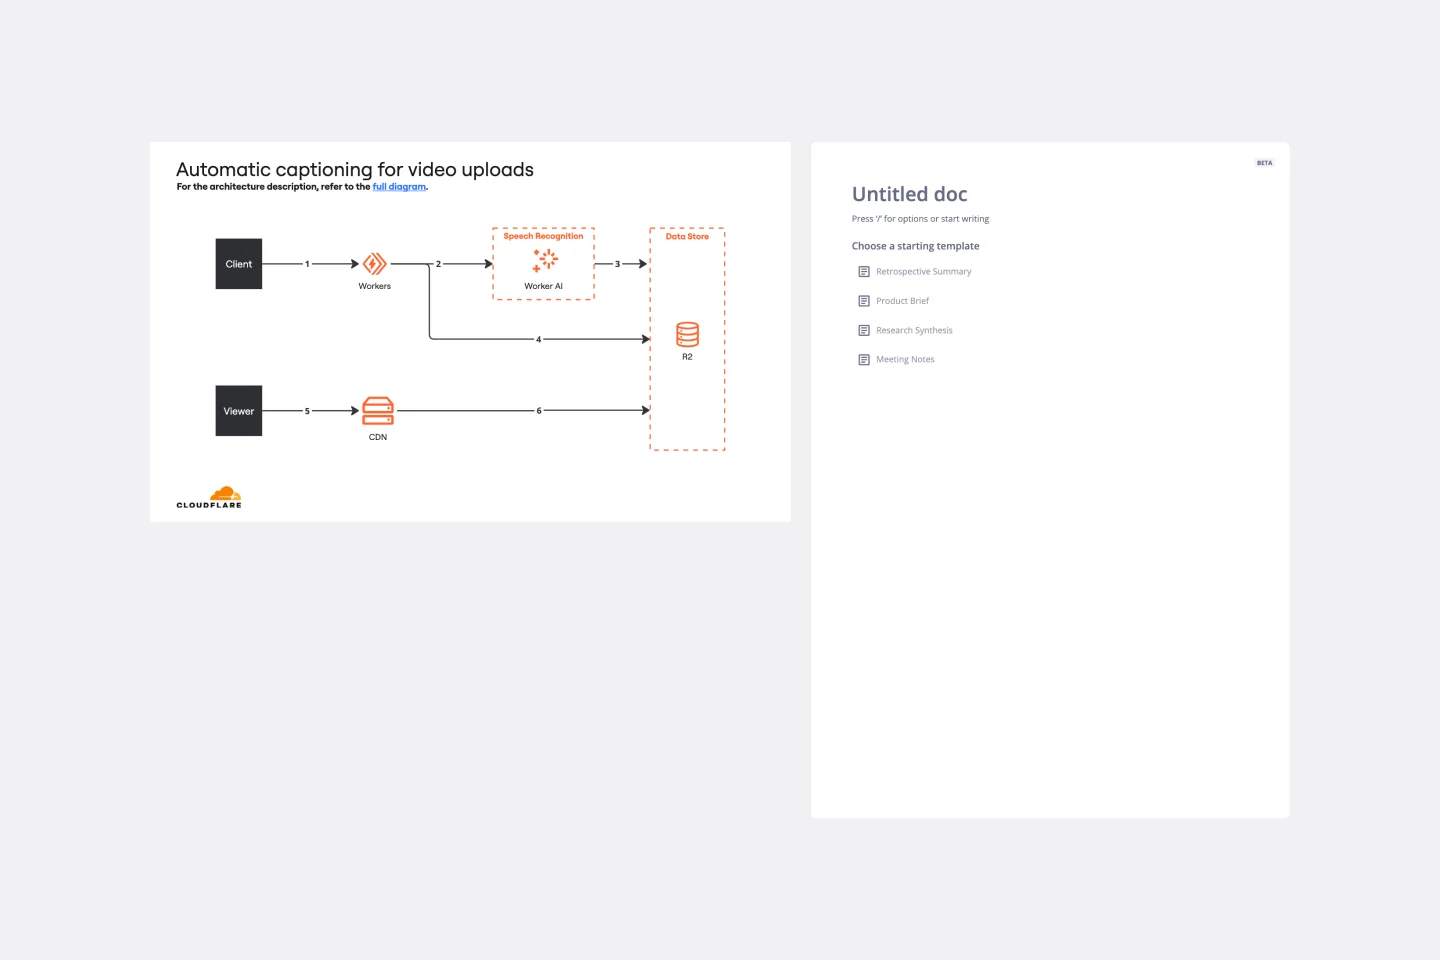
The Cloudflare Automatic Captioning for Video Template in Miro is a powerful tool designed to enhance the accessibility and engagement of video content. By leveraging Cloudflare's technology, this template helps outline the captioning process for videos. It not only makes content accessible to a broader audience, including those who are deaf or hard of hearing but also boost viewer engagement by making videos consumable in sound-sensitive environments or by individuals who prefer reading along.
Kubernetes Application Template
Works best for:
Software Development, Diagrams
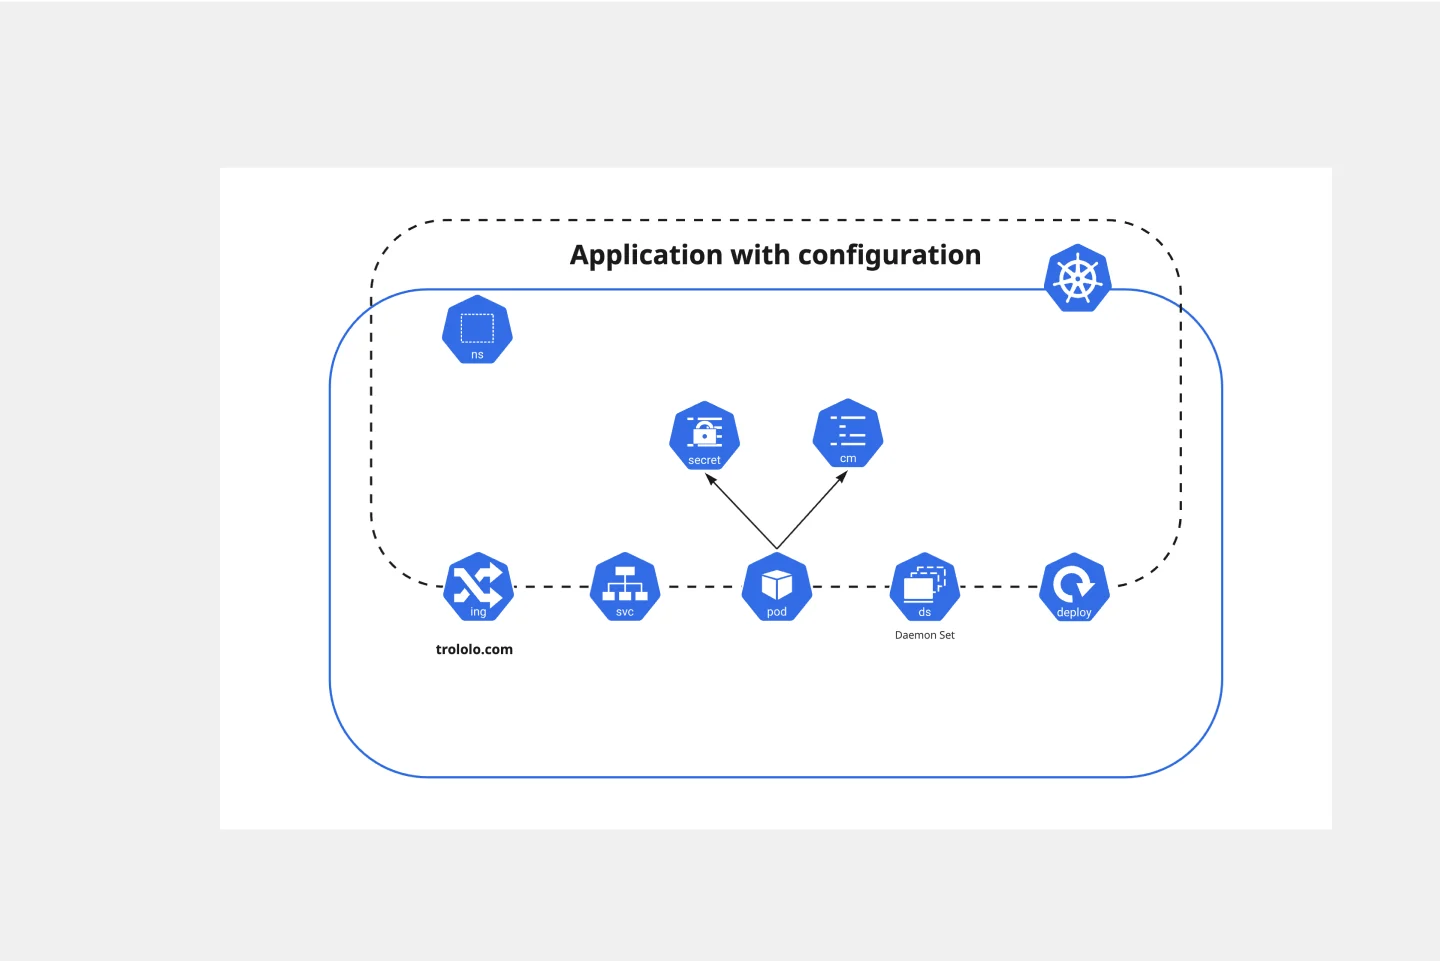
Use the Kubernetes Application template to manage enterprise-ready containerized applications better. You can now get your team more agile when dealing with portability, licensing, and consolidated billing. The Kubernetes Application template allows you to run deployments anywhere, facilitating the management of your applications. Try it out and see if it’s the best fit for you and your team.
UML Sequence Rental Booking System Template
Works best for:
UML
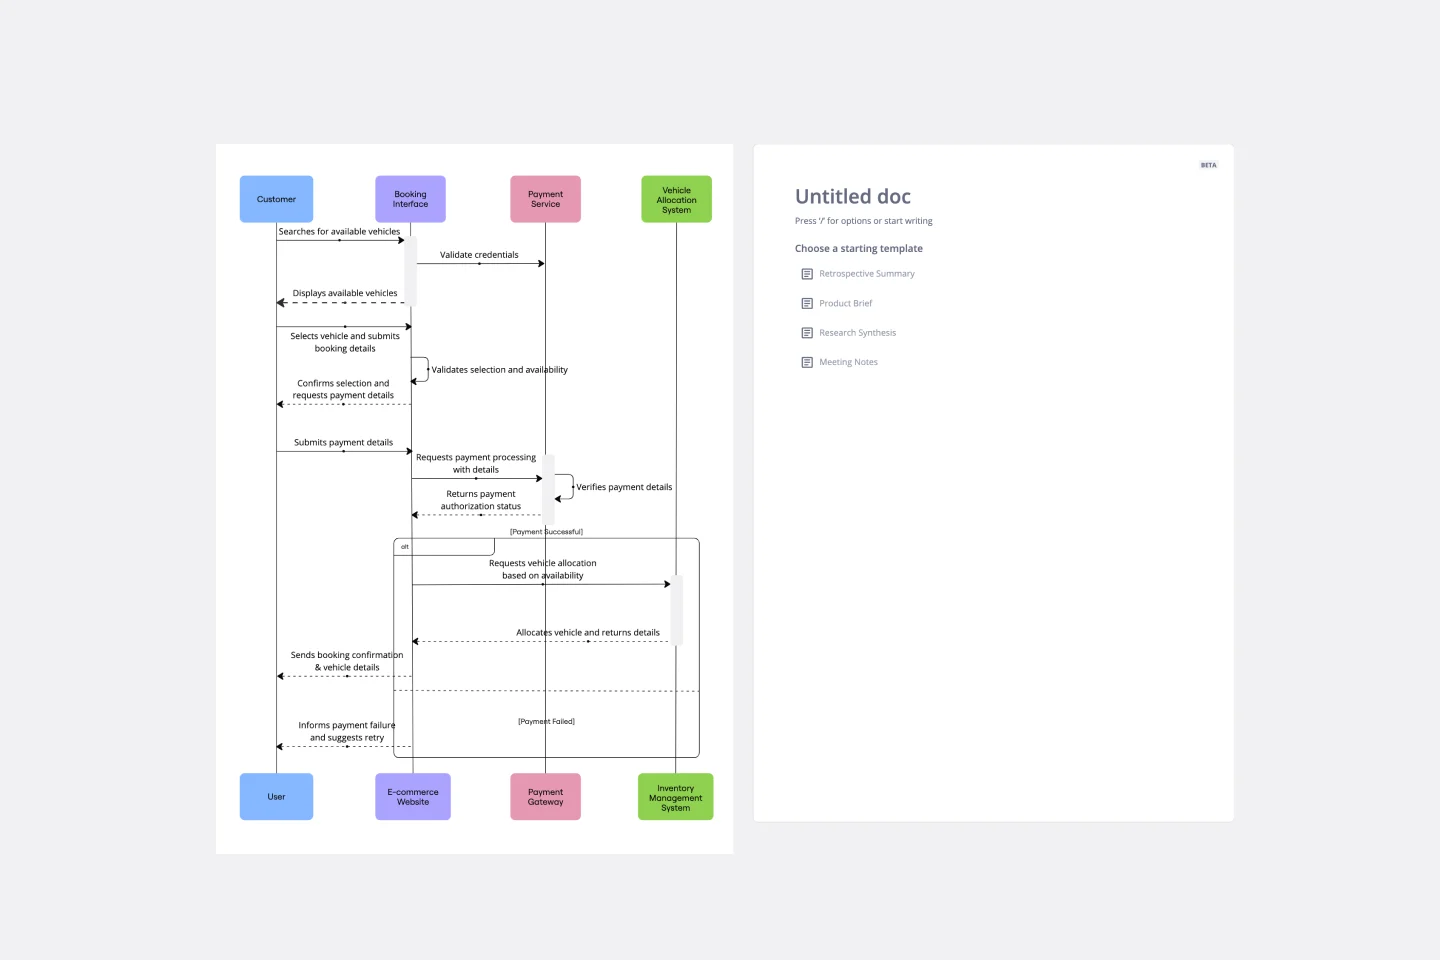
The UML Sequence Rental Booking System Template streamlines the process of documenting and visualizing the interactions within a car rental booking system. This template maps out the communication flow between the customer, user interface, payment service, and vehicle allocation system, ensuring a smooth and efficient workflow. By providing a clear visual representation of these interactions, the template helps in improving understanding among team members and stakeholders, promoting efficient design and collaboration.
Cluster Diagram Template
Works best for:
Diagramming
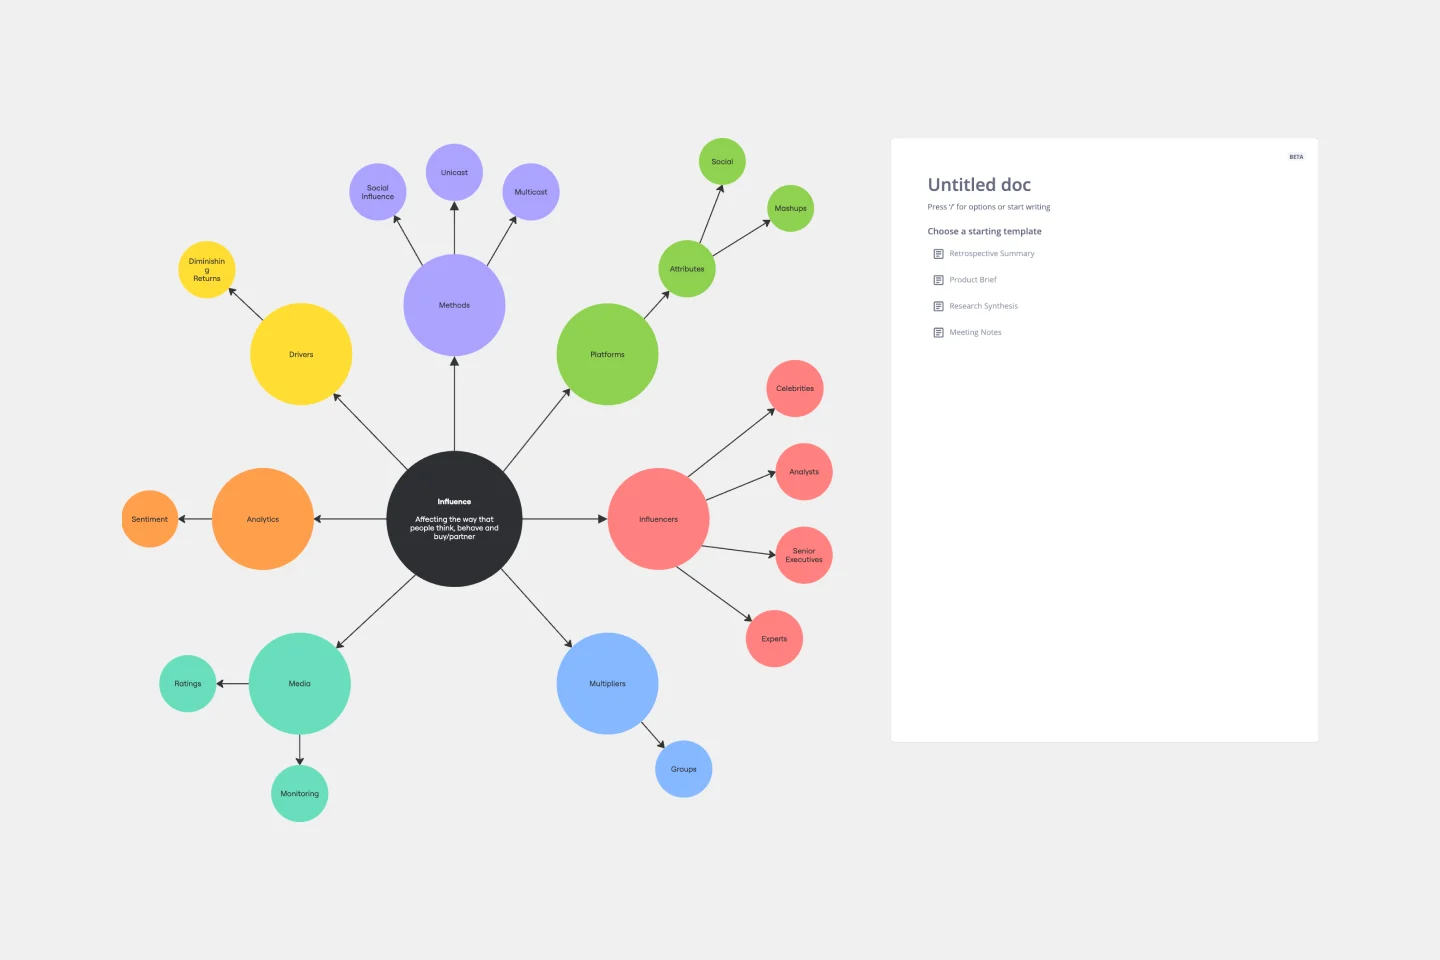
The Cluster Diagram Template is a valuable tool for organizing and connecting ideas, concepts, and information in a visually compelling and coherent manner. The template's design centers on grouping related ideas around a core concept, creating a transparent and hierarchical structure. This clustering not only aids in breaking down complex information into manageable segments but also significantly enhances the process of idea generation and brainstorming. A structured yet flexible visual framework encourages deeper engagement and more precise understanding, making it an essential asset for teams and people looking to bring order to their creative and analytical processes.
Driver Diagram Template
Works best for:
Diagramming
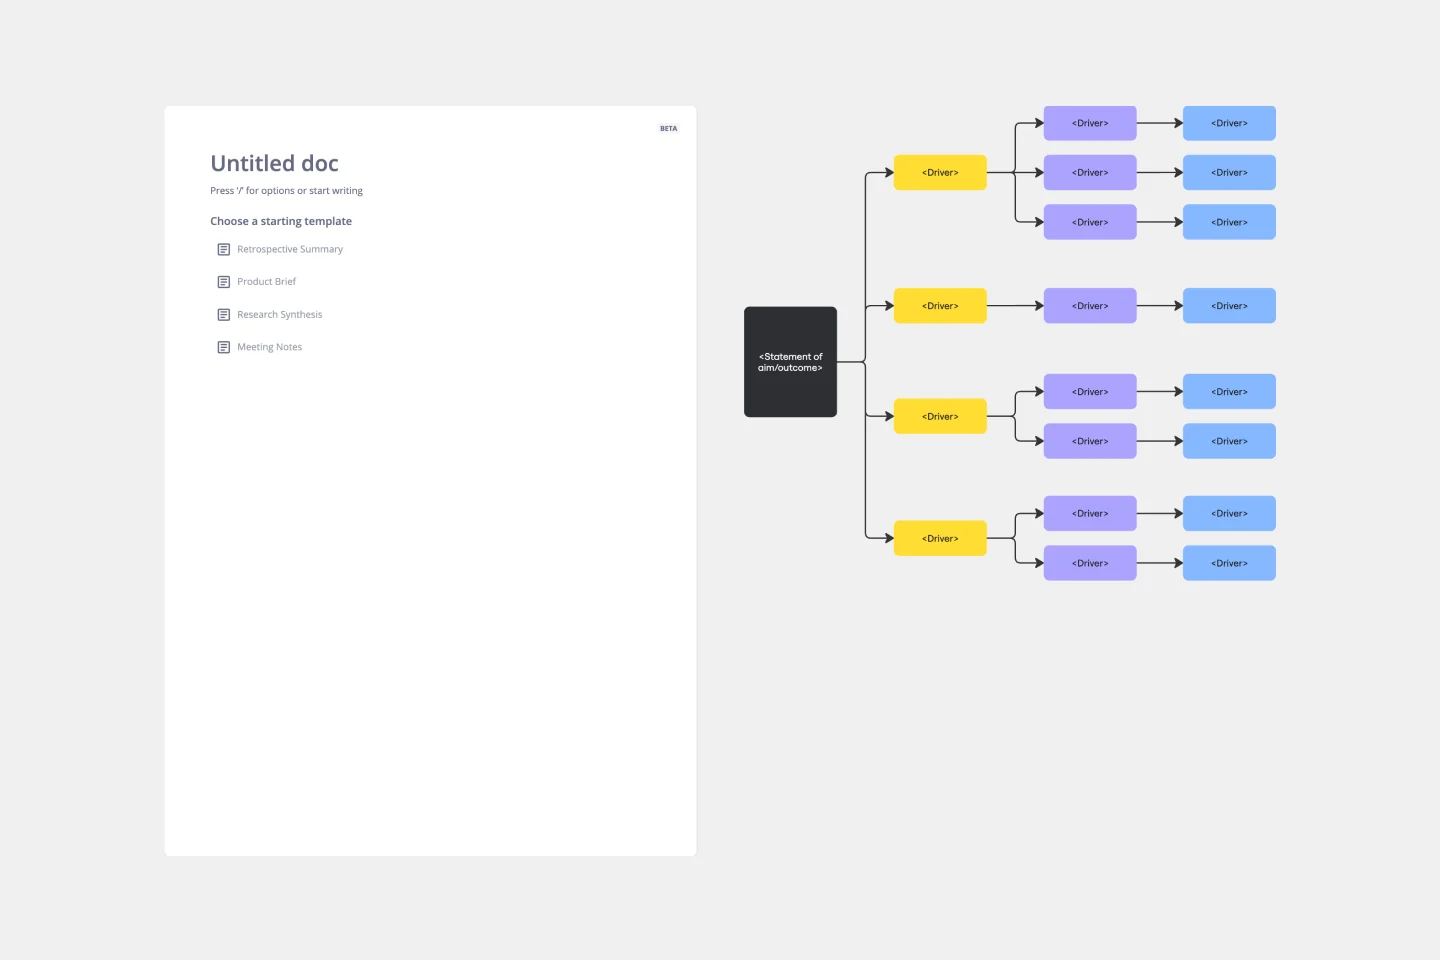
The driver diagram template is a strategic visual tool that helps teams map out their primary objectives and break them down into actionable components. It presents goals, drivers, and specific change ideas in a coherent and interconnected format, ensuring clarity of objective. By doing so, every team member is aligned towards a common endpoint, fostering unified efforts. The visual nature of the template simplifies complex objectives, making it easier for teams to stay on track and measure their progress effectively.