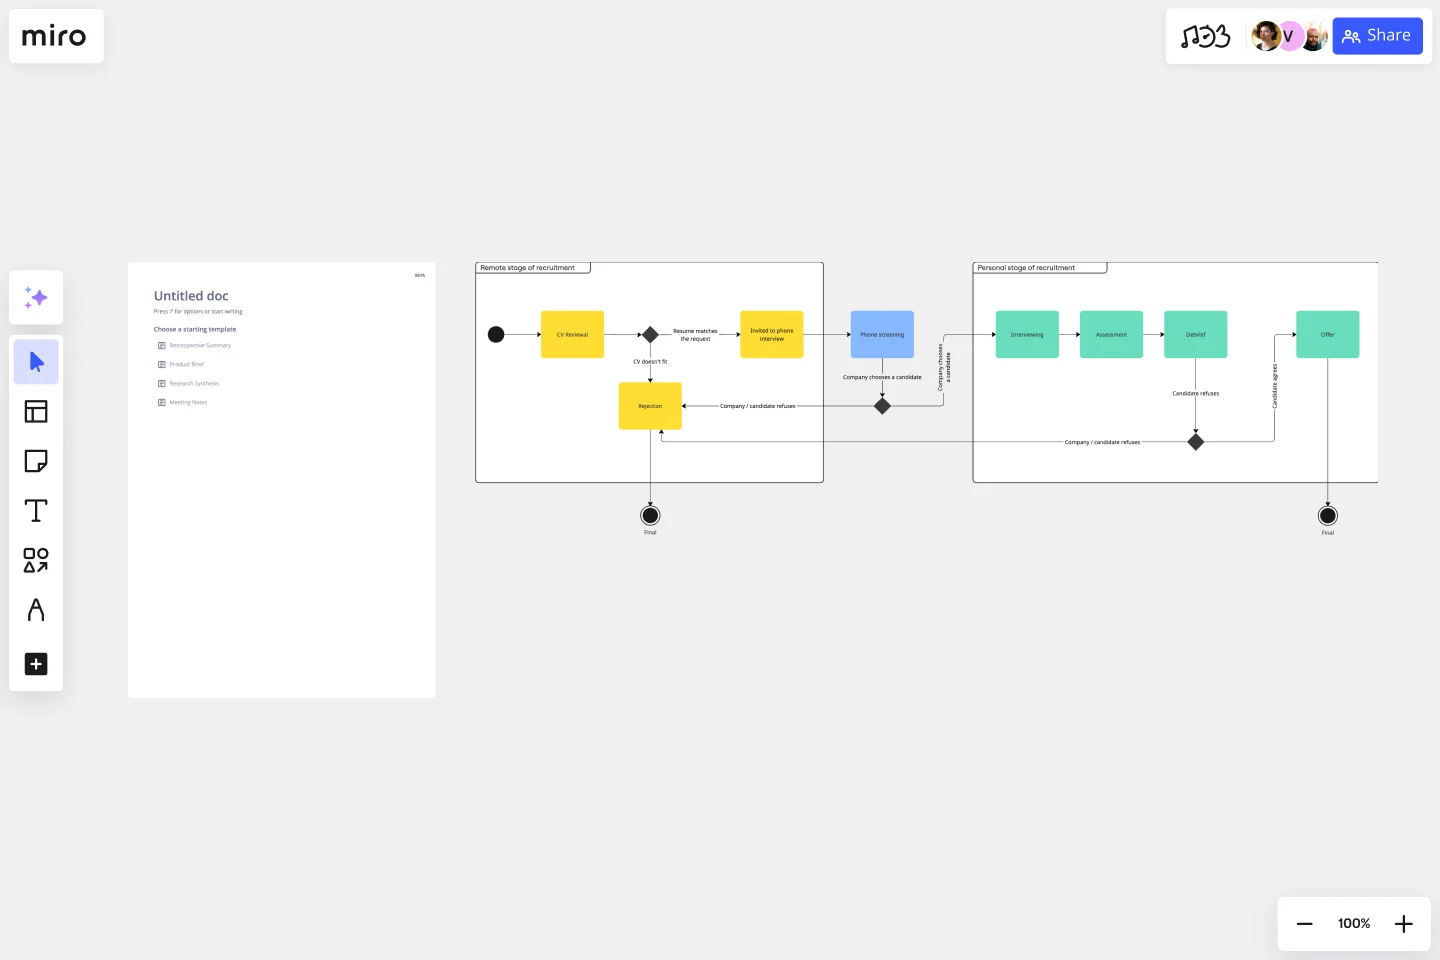
UML State Machine Diagram Template
Visualize the different stages of an object or system using a UML state machine diagram template.
Available on Enterprise, Business, Education plans.
About the UML State Machine Diagram Template
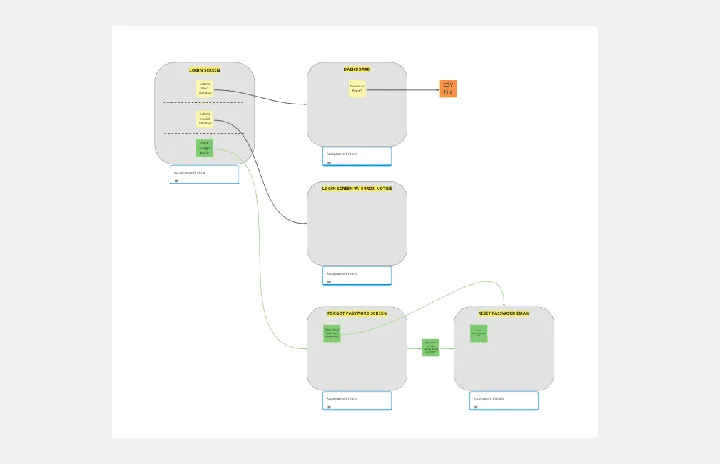
Miro’s UML state machine diagram template is a visual tool you can use to illustrate an object or system’s various states and how it transitions from one to another. State machine diagrams are especially useful for software engineers and system architects looking to understand, design, and communicate complex state transitions and interactions — such as seeing how a web service responds to different requests.
In the next section, we’ll walk you through how to use the UML state machine diagram template.
How to use the UML state machine diagram template
To get started, click on the “use template” button to open the UML state machine diagram template in Miro. Once you’re in, follow these steps to start filling it in:
1. Define states and objects
Define your possible states and the objects that belong to them. Use the shapes in the template to represent each state by double-clicking on the text boxes to edit them.
For example, if you’re creating a behavioral state machine diagram for an elevator system, you could define the states as 'Not activated,' 'Waiting for user input,' and 'Moving up' or ‘Moving down.’
2. Connect states to objects
Once you’ve defined your states, connect them with the correct objects. For example, for a UML state machine diagram representing an elevator system, you’d connect the ‘Move Up’ object to the 'moving up' state and the ‘Move Down’ object to the 'moving down' state.
Use the arrows in the state machine diagram template to link states and objects. Rearrange, duplicate, and remove them as needed.
3. Add transition actions and conditions
Once you connect the states with the objects, fill in the appropriate actions for each state. For example, if your elevator diagram has a state called 'waiting for user input,’ instruct the user on what they should do next. Double-click on the text boxes you want to edit to replace them with your own actions and outcomes.
4. Define guard conditions
Finally, add guard conditions or actions that would trigger your transitions. For example, if an elevator is moving upward and the user presses the 'down' button, this action would trigger the elevator to move back to its 'waiting for user input' state.
In the state machine diagram template, double-click on a textbox along an arrow connecting two states and add the appropriate guard condition.
Miro is also the perfect state diagram maker if you'd prefer to diagram from scratch. Simply use Miro's diagramming tool and UML shape pack.
What is the state machine diagram template for?
A state machine diagram template helps you visualize a software’s different states and how it transitions between them. Take video games, for example. If you’re designing a video game, a state machine diagram will help show how the user will move through the different stages of playing.
Can I build a state machine diagram from scratch?
Absolutely. Miro makes it easy to build a state machine diagram from scratch using our automated diagramming and mapping tools and user-friendly interface. Drag and drop the shapes you need onto your canvas, add connection lines to depict transitions, and use text boxes to add labels.
Does Miro have a free UML diagramming shape pack?
Miro offers plenty of free shape packs to equip you with all the diagramming tools you need — though you’ll need a Business, Enterprise, or Education plan to access our UML shape pack.
Get started with this template right now. Available on Enterprise, Business, Education plans.
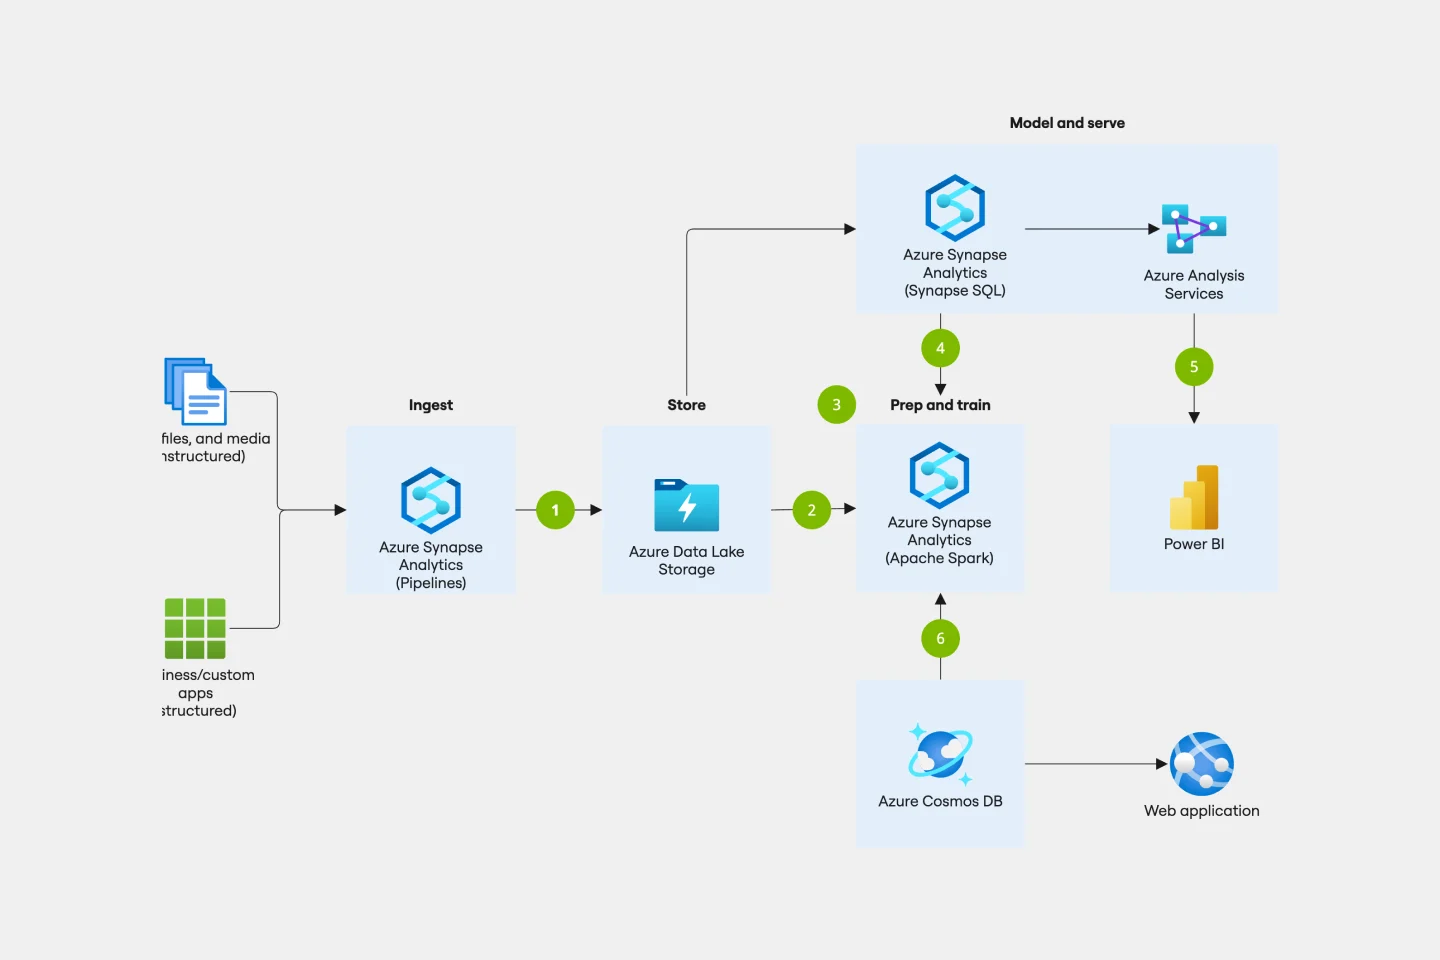
Azure Data Flow Template
Works best for:
Software Development, Diagrams
The Azure Data Flow is a diagram that will allow you to combine data and build and deploy custom machine learning models at scale. Azure is Microsoft’s cloud computing platform, designed to provide many cloud-based services like remote storage, database hosting, and centralized account management. Azure also offers new capabilities like AI and the Internet of Things (IoT).
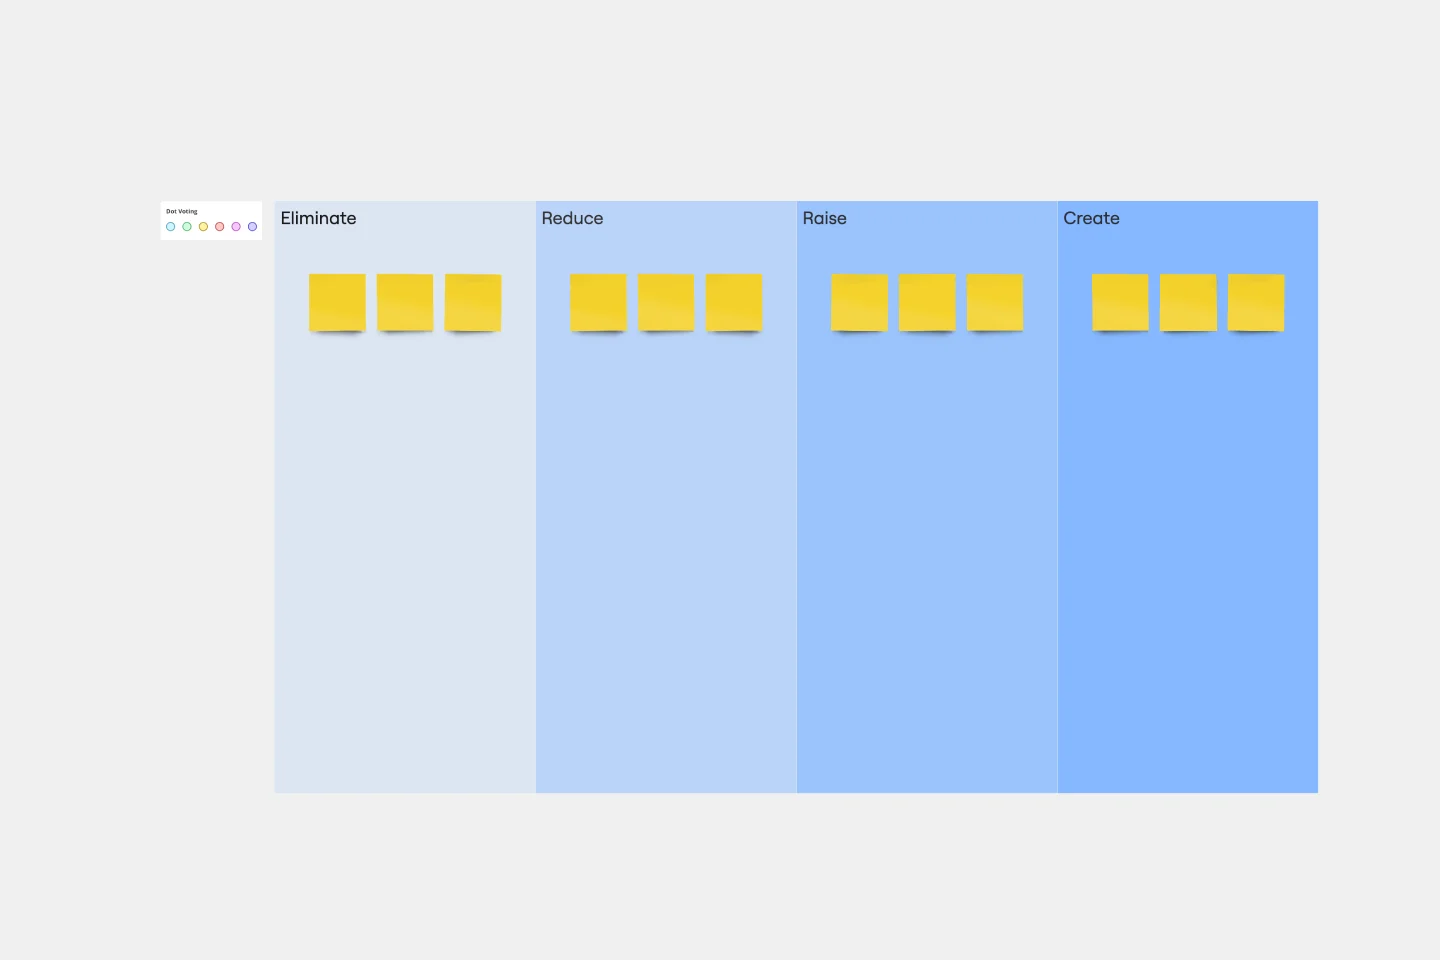
Blue Ocean 4 Actions Framework Template
Works best for:
Leadership, Decision Making, Strategic Planning
For entrepreneurs, so much comes down to new users—how to attract them, impress them, and convert them to loyal customers. This template, designed by the authors of Blue Ocean Strategy: How to Create Uncontested Market Space and Make the Competition Irrelevant, will help you maximize value for you and your customers alike. Using the template’s four steps (divided into easy columns), you’ll easily evaluate your products in more innovative ways and make sure money is being spent in areas that really matter.
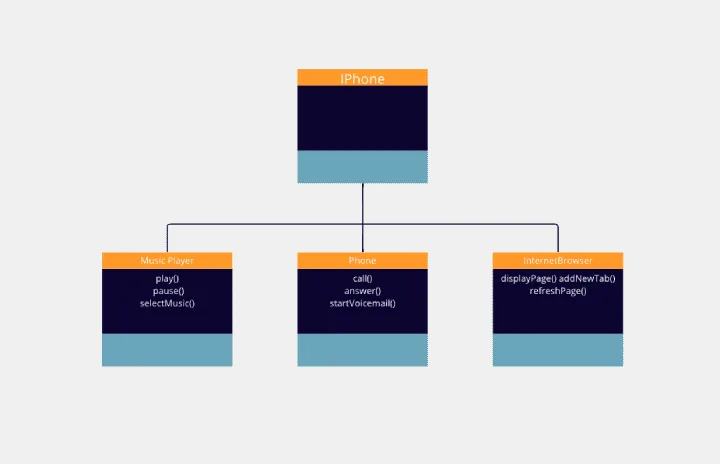
Challenge - UML Iphone
Works best for:
Diagramming
The Challenge UML Iphone template offers a visual framework for designing and modeling iPhone app challenges and solutions using UML (Unified Modeling Language). It provides elements for defining app functionalities, user interactions, and system architecture. This template enables teams to brainstorm ideas, document requirements, and visualize app designs, facilitating collaboration and innovation. By promoting clarity and alignment, the Challenge - UML Iphone template empowers teams to design iPhone apps that meet user needs and deliver exceptional user experiences.
Breakout Group Template
Works best for:
Education, Team Meetings, Workshops
Breakout groups provide an excellent opportunity for teammates to have candid conversations and connect on a more intimate level than is possible during a broader meeting. When you’re in a large group setting, it can be difficult for people to feel safe or comfortable speaking up. In a smaller group, participants can feel safer sharing their ideas. Since the group is more intimate, teams are empowered to participate rather than observe.

Causal Loop Diagrams (1.0)
Works best for:
Diagramming
The Causal Loop Diagrams (1.0) template offers a visual tool for modeling complex systems and understanding the feedback loops that drive behavior. It provides a structured framework for identifying causal relationships, reinforcing loops, and balancing feedback within a system. This template enables teams to analyze system dynamics, anticipate unintended consequences, and formulate effective strategies for intervention. By promoting systems thinking and understanding of interdependencies, Causal Loop Diagrams empower organizations to navigate complexity and drive sustainable change.
Breadboard (UI Flow Diagram)
Works best for:
Diagramming
The Breadboard (UI Flow Diagram) template offers a visual framework for designing and prototyping user interfaces (UIs) using the breadboard method. It provides elements for arranging UI components and defining user interactions. This template enables designers and developers to create interactive UI prototypes quickly and iteratively, facilitating user testing and feedback. By promoting rapid prototyping and experimentation, the Breadboard (UI Flow Diagram) empowers teams to design intuitive and user-friendly digital experiences effectively.