UML Sequence Rental Booking System Template
Optimize the documentation and visualization process of interactions within rental booking systems.
Available on Enterprise, Business, Education plans.
About the UML Sequence Rental Booking System Template
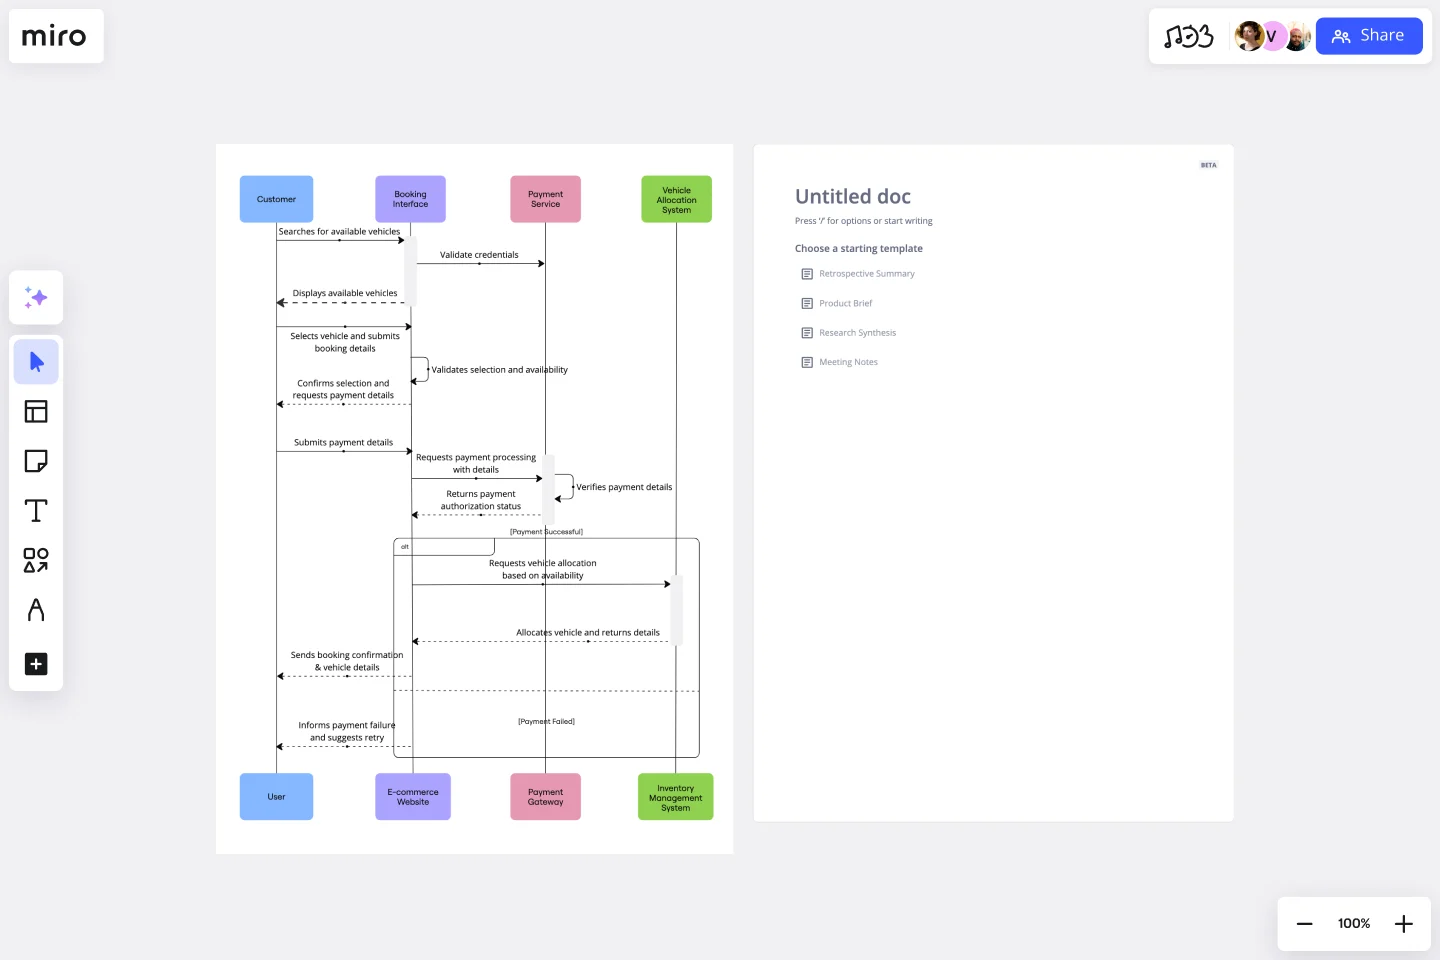
The UML Sequence Rental Booking System Template in Miro is designed to streamline the process of documenting and visualizing the interactions within a car rental booking system. This template aids in mapping out the communication flow between the customer, user interface, payment service, and vehicle allocation system, ensuring a smooth and efficient workflow. By using this template, teams can understand the sequence of interactions necessary for a successful rental booking process.
How to use the UML Sequence Rental Booking System Template
Customize the template: Once the template is open on your board, you can start customizing it to fit your specific project needs. Miro allows you to add, remove, or modify the elements within the template easily. For more complex diagrams, use Miro's UML shape packs or integrate with text-to-diagram apps like PlantUML and Mermaid.
Collaborate in real time: Invite your team members to collaborate on the diagram in real-time. Miro's collaborative features enable you to work together seamlessly, regardless of your physical location. Use comments, @mentions, and live editing to gather input and make decisions efficiently.
Iterate and refine: As your project evolves, so too will your understanding of the necessary interactions within the rental booking system. Use Miro to iterate on your diagram, refining it to accurately reflect the system's architecture and flow.
Share and present: Once your diagram is complete, share it with stakeholders directly from Miro. You can also present your diagram during meetings using Miro's presentation mode, ensuring everyone is aligned on the system's design.
Why use the UML Sequence Rental Booking System Template
Clarity and understanding: The template offers a visual representation of the interactions within a rental booking system. This visual aid helps team members and stakeholders easily understand the system's flow and requirements, promoting a clear understanding of complex systems.
Efficiency: Utilizing a pre-made template saves time that would otherwise be spent on creating diagrams from scratch. This efficiency allows teams to focus more on refining the system's architecture and interactions rather than on the mechanics of diagramming.
Collaboration: Miro's collaborative environment enhances teamwork by enabling multiple users to contribute to the diagram simultaneously. This feature is especially beneficial for remote or distributed teams, as it supports real-time communication and iteration, ensuring that everyone is aligned and can contribute effectively, regardless of their location.
Get started with this template right now. Available on Enterprise, Business, Education plans.
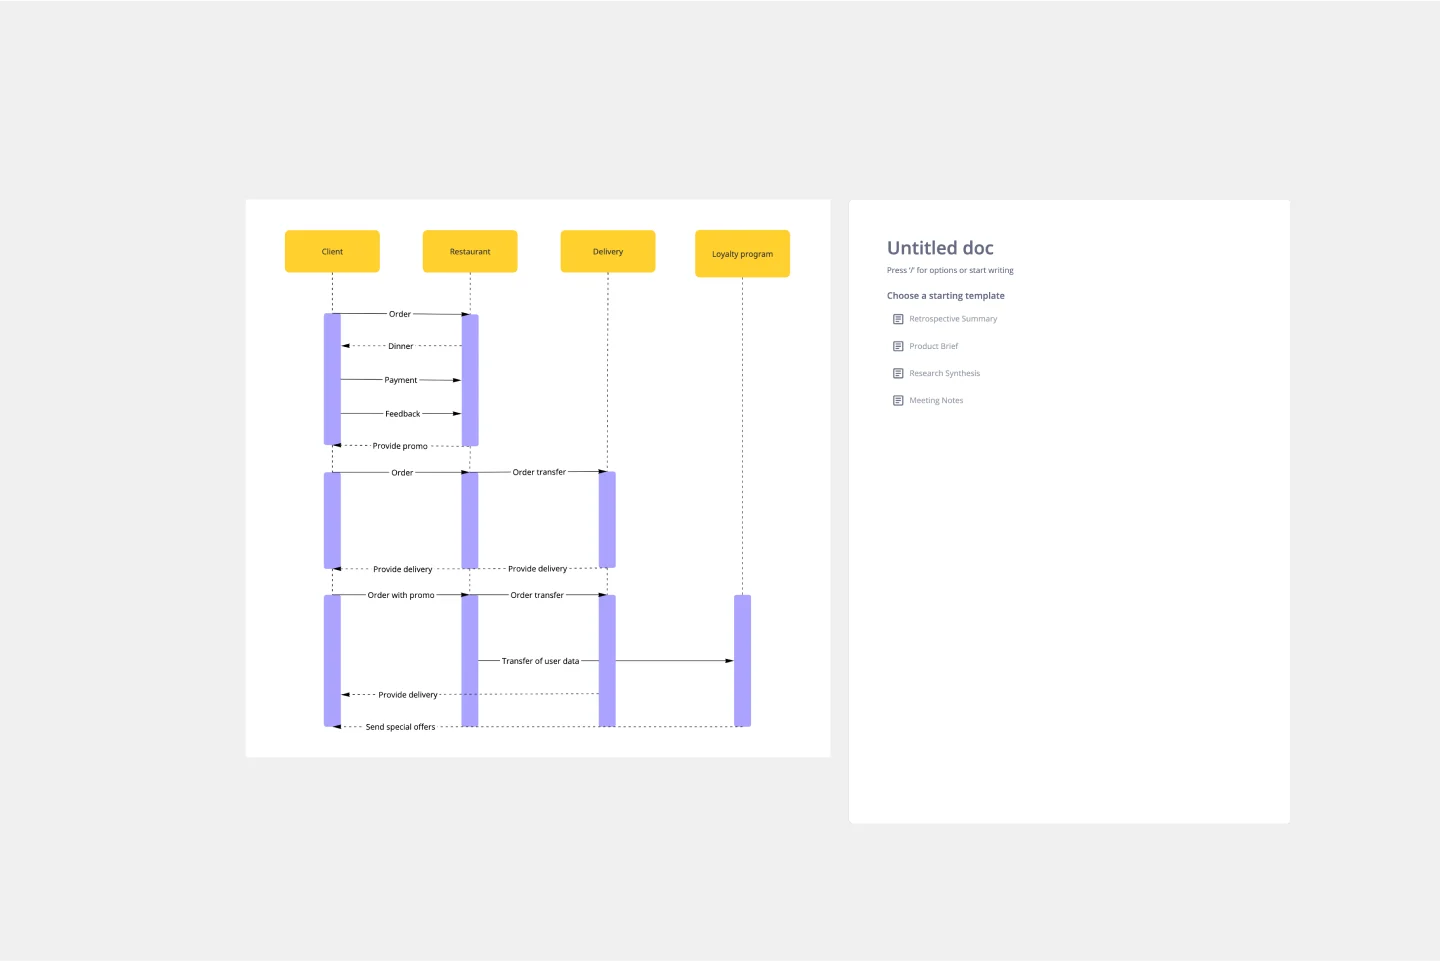
UML Sequence Diagram Template
Works best for:
Software Development, Mapping, Diagrams
Analyze and showcase how external entities interact with your system using a sequence diagram. Get a bird’s-eye view of your work processes, business functions, and customer interactions using this diagram. Also, identify any potential problems early and solve them before implementation.