UML ERD Diagram
This template contains a few Entity-Relationship diagrams that you can re-use for your own work.
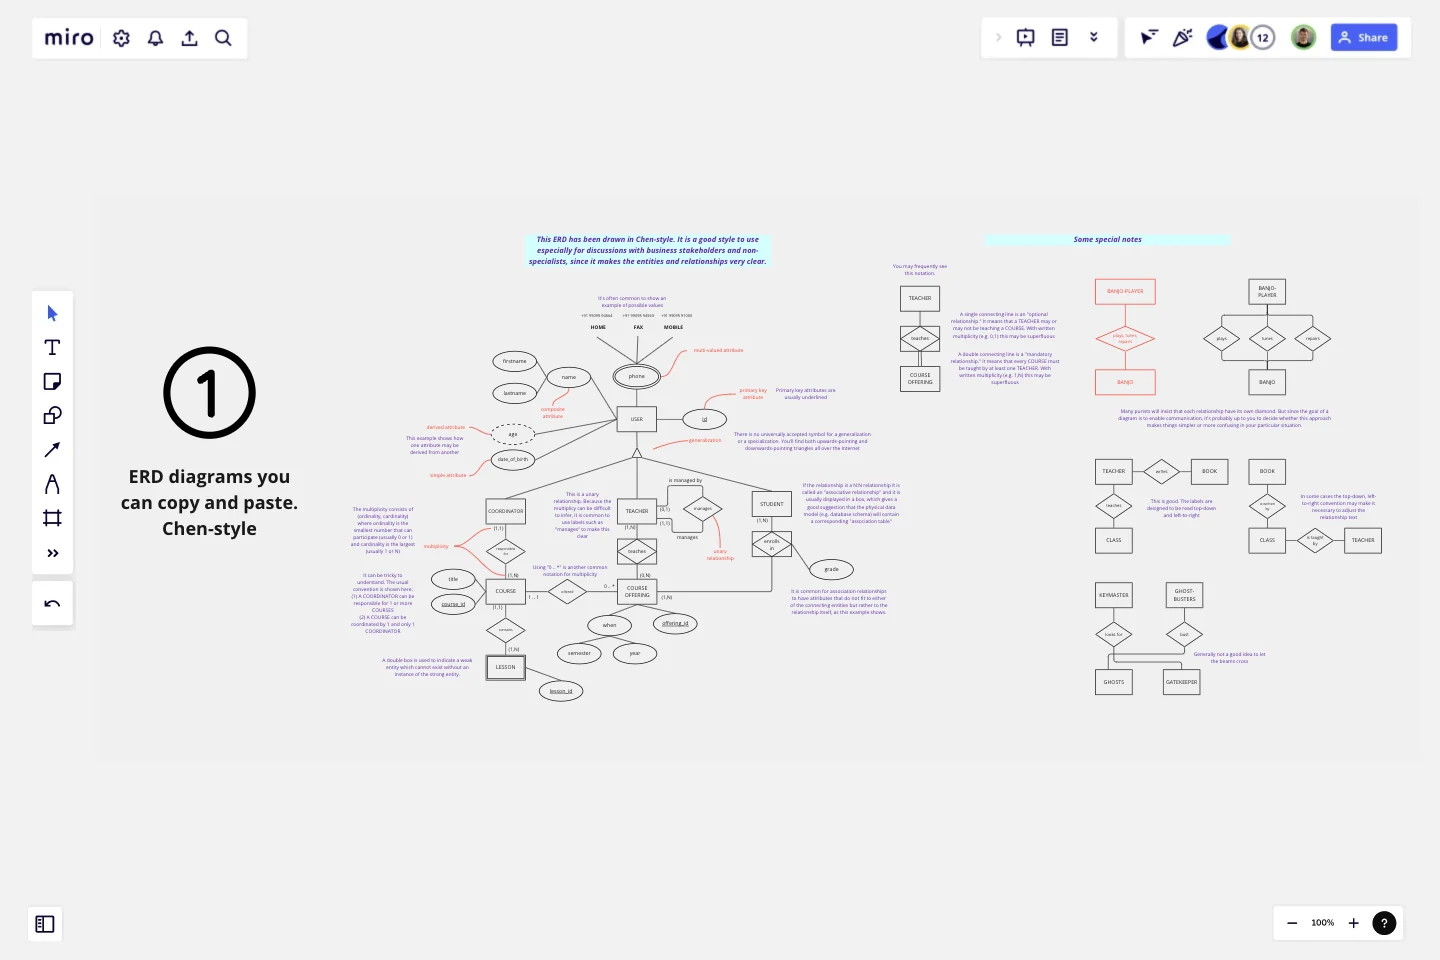
About the UML ERD Diagram template
This template contains a few Entity-Relationship diagrams that you can re-use for your own work. It also contains a short tutorial about how to create your own ERDs from scratch. Because ERDs are impossible to create without a real-world situation, the diagrams in this template have adopted the well-known teacher/class/student example that is a common example in many ERDs.
Who can use this UML ERD Diagram template
This template is expected to be used mainly by information technology specialists, particularly those with a focus on data
How to use this UML ERD Diagram template
Simply cut-and-paste the diagrams you need into your own boards!
What this UML ERD Diagram helps you accomplish
Instead of re-creating the wheel from scratch, by cutting and pasting ready-to-use ERDs into your own boards, this should considerably speed up your work!
Tips and best practices
Miro has a significant advantage over many modelling tools because of its vector-oriented graphics. You can easily select the shapes and then re-scale them to any size you need
Get started with this template right now.
Affinity Diagram
Works best for:
Diagramming
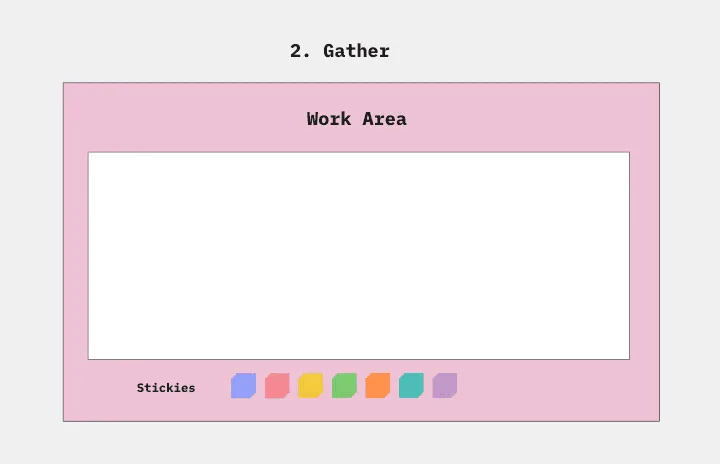
The Affinity Diagram template is a visual tool for organizing and categorizing ideas, data, or issues into related groups. It provides a structured framework for conducting group brainstorming and affinity grouping activities. This template enables teams to synthesize information, identify patterns, and generate insights collaboratively. By promoting creativity and collaboration, the Affinity Diagram empowers teams to organize and prioritize information effectively, driving decision-making and problem-solving processes efficiently.
Salesforce Flow Builder
Works best for:
Flowcharts, Mapping, Diagrams
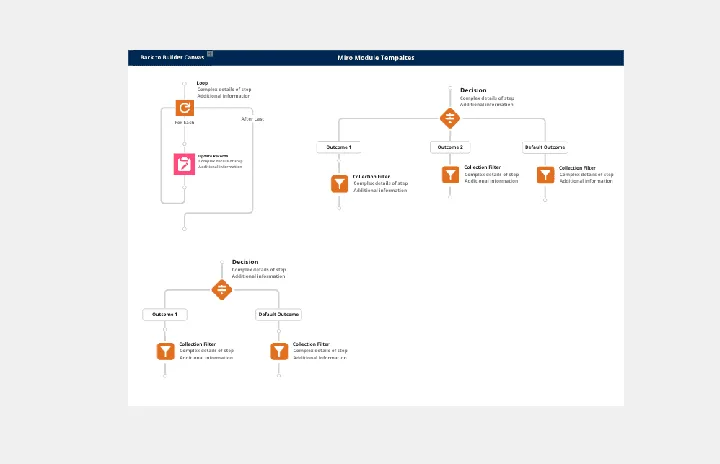
The Salesforce Flow Builder template offers a visual tool for designing and automating business processes within the Salesforce platform. It provides elements for creating flowcharts that represent process flows, decision logic, and data transformations. This template enables Salesforce administrators and developers to streamline workflows, improve productivity, and enhance user experiences. By promoting automation and efficiency in Salesforce process design, the Salesforce Flow Builder empowers organizations to leverage the full potential of the Salesforce platform and drive business success effectively.
Cladogram Template
Works best for:
Diagramming
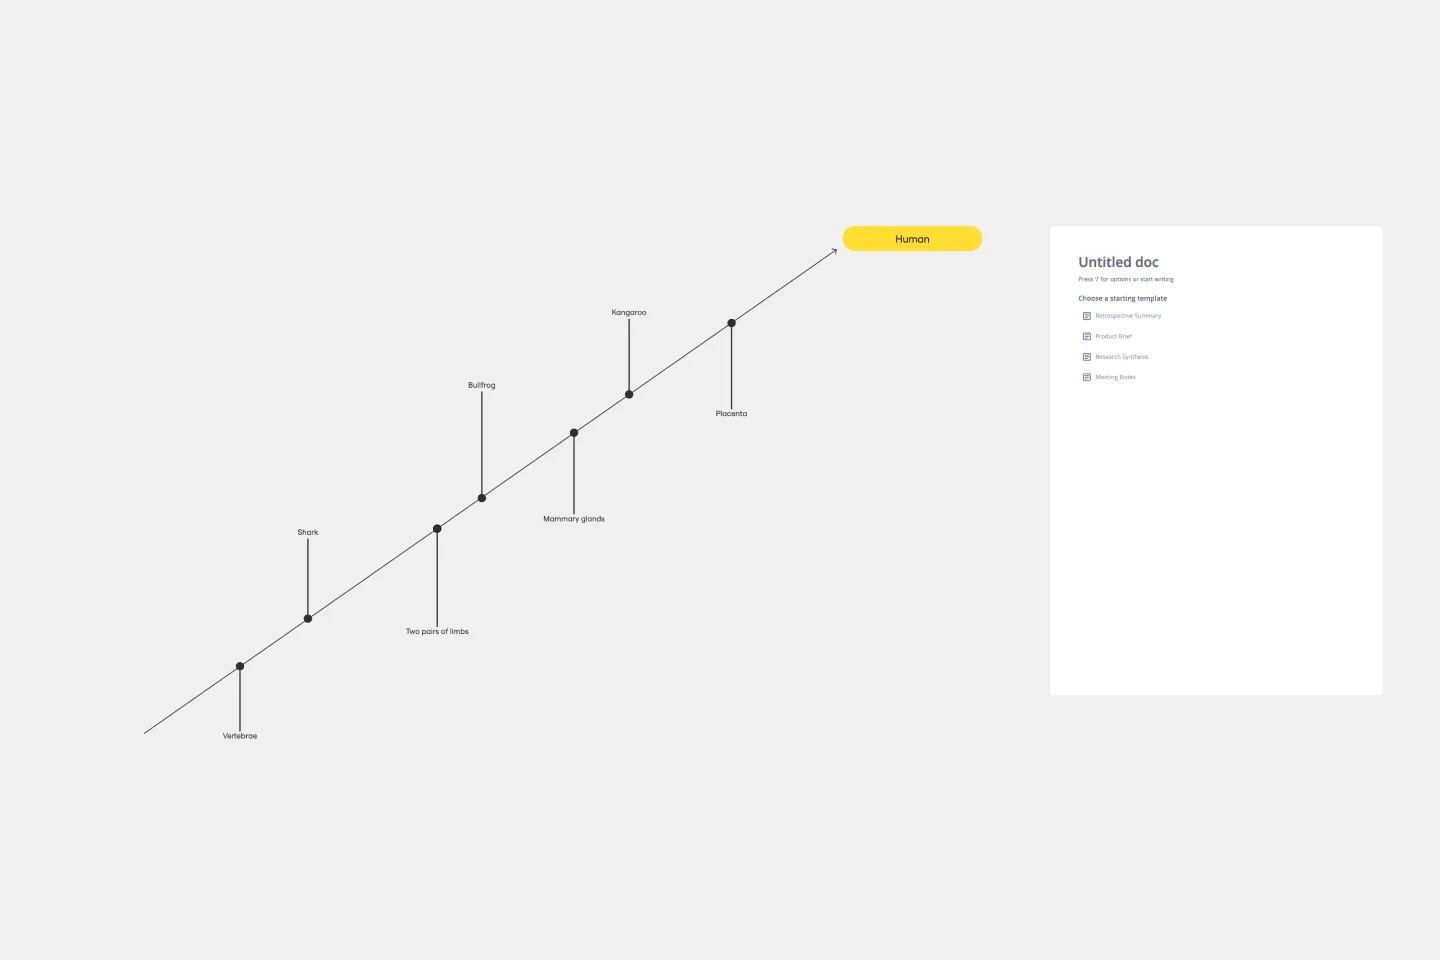
The Cladogram Template offers seamless adaptability, empowering users to change, expand, and refine evolutionary representations with ease. Its intuitive interface and automated features ensure dynamic and responsive diagrams that keep up with evolving knowledge. Say goodbye to static diagrams and welcome fluidity and adaptability with Miro's Cladogram Template.
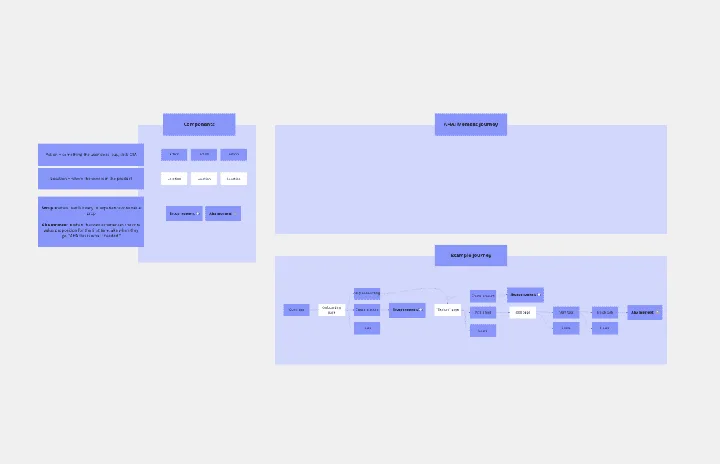
AHA! Moment Flowchart 🎈
Works best for:
Mapping, Flowcharts
The AHA! Moment Flowchart template offers a visual tool for mapping out the journey of users or customers and identifying key moments of realization or insight (AHA moments). It provides a structured framework for documenting user interactions, emotions, and pain points throughout their journey. This template enables teams to understand user experiences, identify opportunities for improvement, and enhance product or service offerings. By promoting empathy and customer-centric design, the AHA! Moment Flowchart empowers organizations to create meaningful and impactful user experiences effectively.
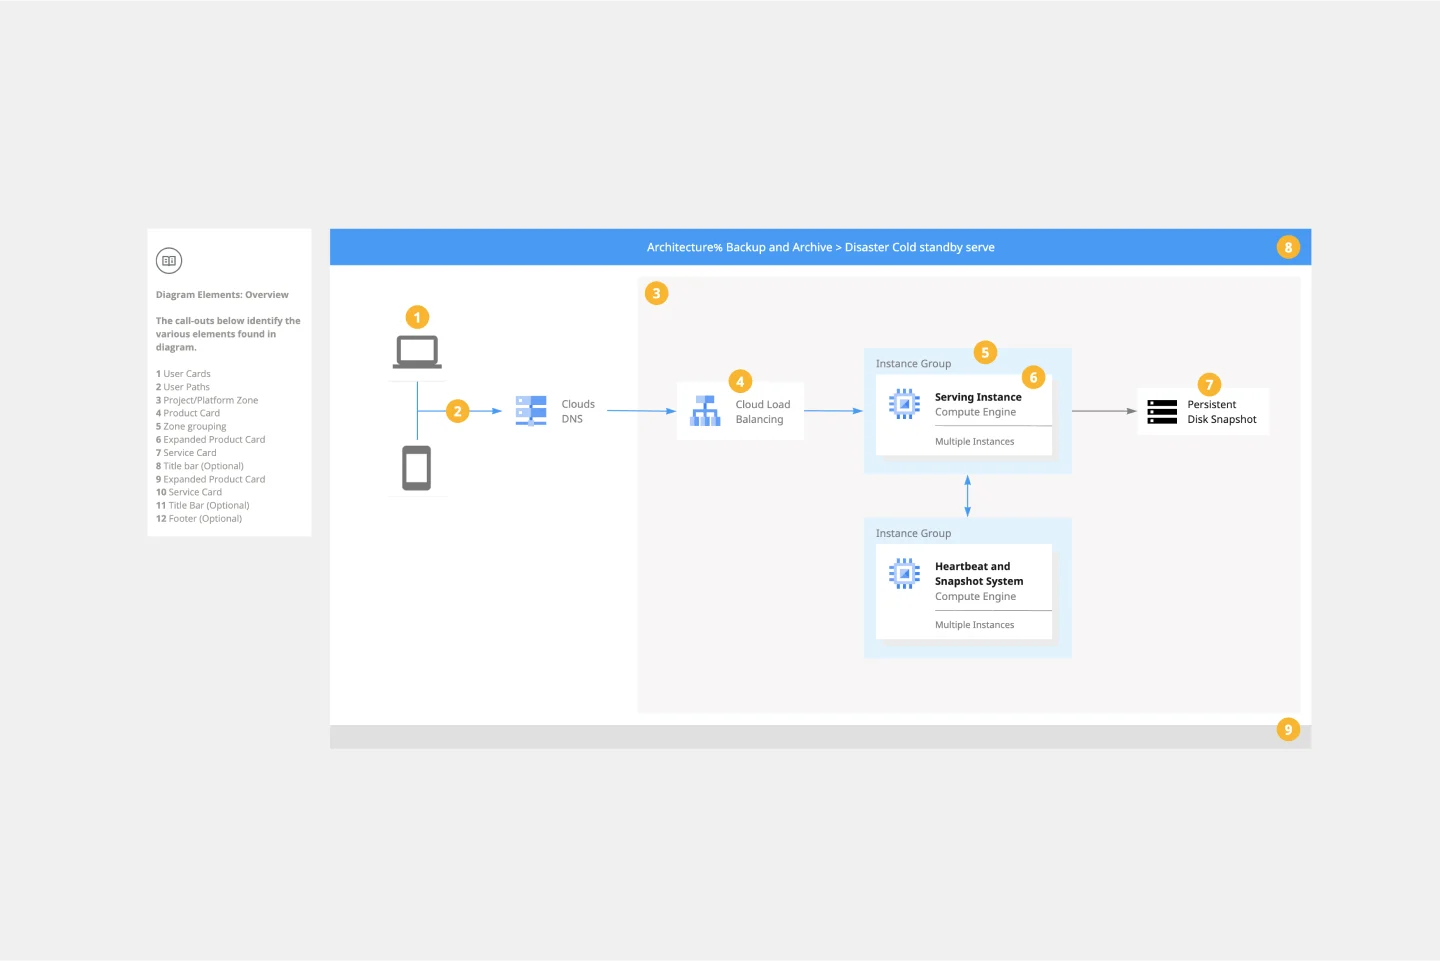
Google Cloud Architecture Diagram Template
Works best for:
Software Development, Diagrams
Use the Google Cloud Architecture Diagram template to clearly visualize the deployment of your application and allow you and your team to optimize processes. The GCP template gives you a great overview of your application architecture, and it helps you to iterate quickly and better manage your application development, deployment, and documentation. Try it out and see if it works for you.
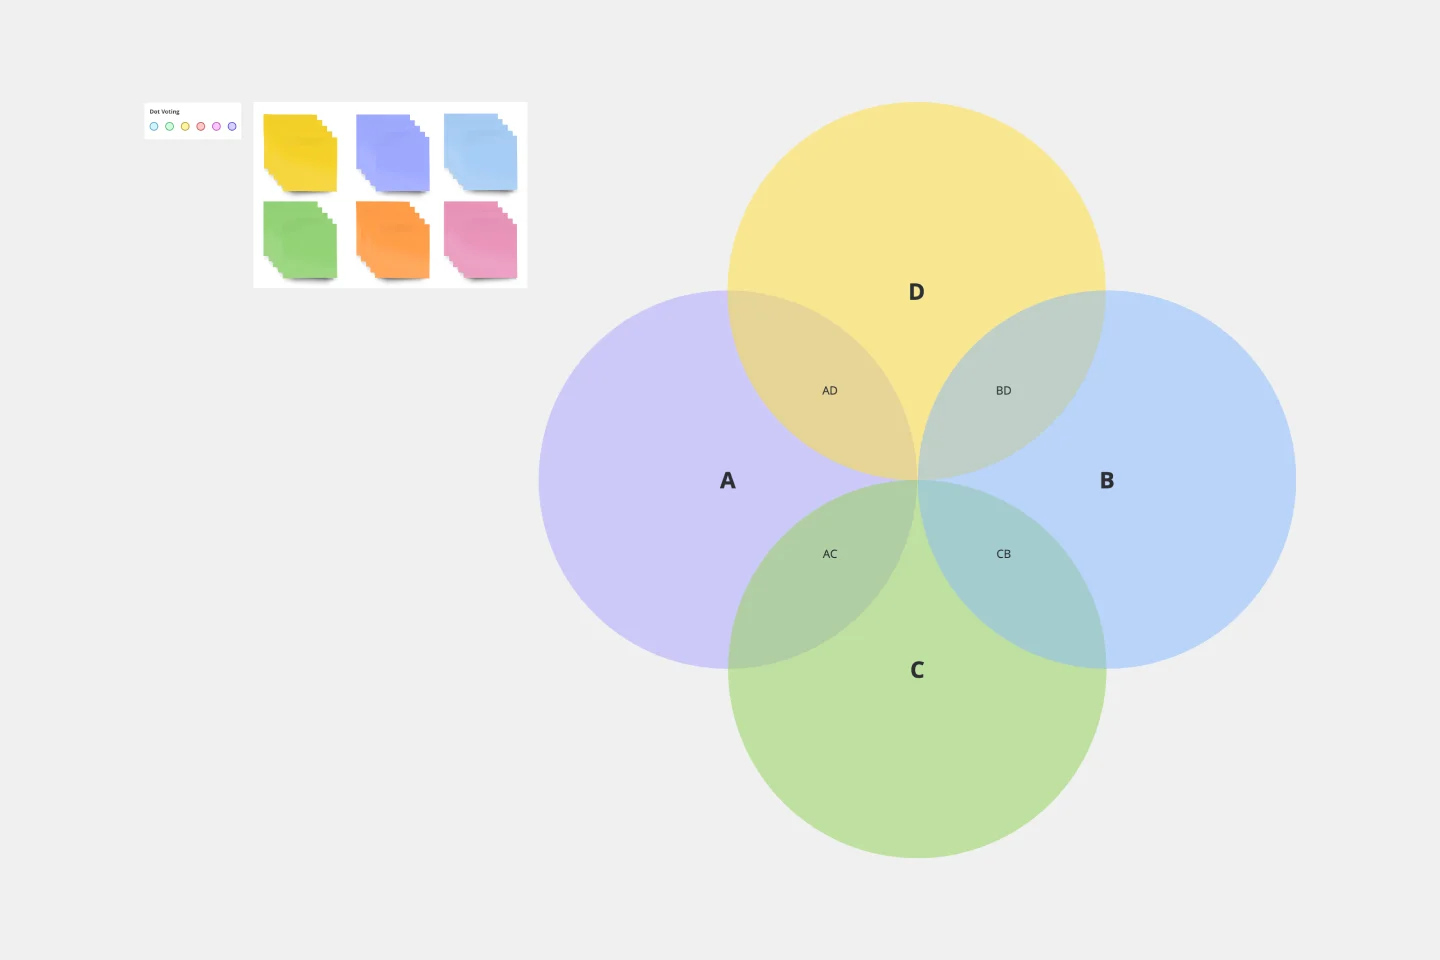
4-Circle Venn Diagram Template
Works best for:
Diagramming, Mapping, Brainstorming
The 4-Circle Venn Diagram Template has an easy, interactive, and dynamic way to visualize complex relationships between data sets. Empower your team's collaboration and communication with this powerful tool.