UML Component Diagram Template
Plan, draw, and share an object-oriented system’s elements and components using our UML component diagram template.
Available on Enterprise, Business, Education plans.
About the Component Diagram Template
Easily map out complex software systems using Miro’s fully customizable UML component diagram template. With pre-made component and interface symbols from our extensive UML shape pack, adjustable connection lines, and text boxes, you’re all set to create high-level visual overviews of anything from e-commerce systems to banking systems.
Using Miro’s component diagram template also gets you access to our powerful visual workspace — allowing you to quickly expand on the template with our automated diagramming tools and seamlessly collaborate with your team online.
We’ll walk you through how to make the most of our UML component diagram template.
How to use the component diagram template
To get started, click on the blue “Use template” button to open the component diagram template in Miro. Once you’re in, set your board up by inviting any collaborators you’d like to work on the template with. When you’re ready, follow the steps below to start filling the component diagram template out:
1. Pick a system
Decide on the system you’d like to visualize using the component diagram template — whether it’s an e-commerce system, banking system, or something else. It’s also worth aligning with your team to gather any input you might need from them to build the diagram.
2. Plot components
Once you’ve picked a system, start by visualizing its various components. The template comes with pre-made component symbols from our UML shape pack. To edit them, double-click on the pre-written text and add your own labels. For example, if you’re visualizing an e-commerce system, you might have components like “user interface,” “payment gateway,” and “product catalog.”
Need more components? Click on any component symbol to reveal blue dots on its side. Any blue dot you click on with automatically generate a connection line from that point with a matching component symbol on the other end — allowing you to quickly expand on the template.
3. Plot interfaces
The template also comes with pre-made interface symbols from our UML shape pack, with text boxes below each one. Double-click on the text boxes to replace the pre-written content with your own, allowing you to represent your system’s interfaces on the component diagram template. Going back to our e-commerce example, you might have interfaces labeled “customer interface” and “admin interface.”
4. Adjust connection lines
Use the template’s pre-made connection lines to visualize dependencies and wiring within your system. To adjust the lines, click on one to reveal two white dots on each end, and drag them until you’re happy with the position. You can use the blue dot in the middle to adjust your line’s curve.
You can also grab sticky notes or text boxes from the toolbar to give the connections some context. For example, you could add more information to the “payment gateway” component by adding a text box below it that says “handles payment processing and transactions.”
5. Customize the template
Now that you’ve visualized the key components, interfaces, and connections, it’s time to customize the component diagram template. Change colors, play with font types, and adjust the sizes of your elements — anything that might make your diagram easier to understand, or simply make it your own.
You could even change the styles of your connection lines for some visual differentiation between them. Just click on a connection line to reveal the pop-up menu, then click on “Type” to edit your line style.
6. Share the diagram
Get feedback on your completed component diagram template by inviting your team to view and comment on your Miro board. You can also export it as a PDF or image, generate a shareable link, or embed your Miro board on other sites.
Prefer to build your component diagram from scratch? Use Miro's UML component diagram tool and get access to our extensive UML shape pack.
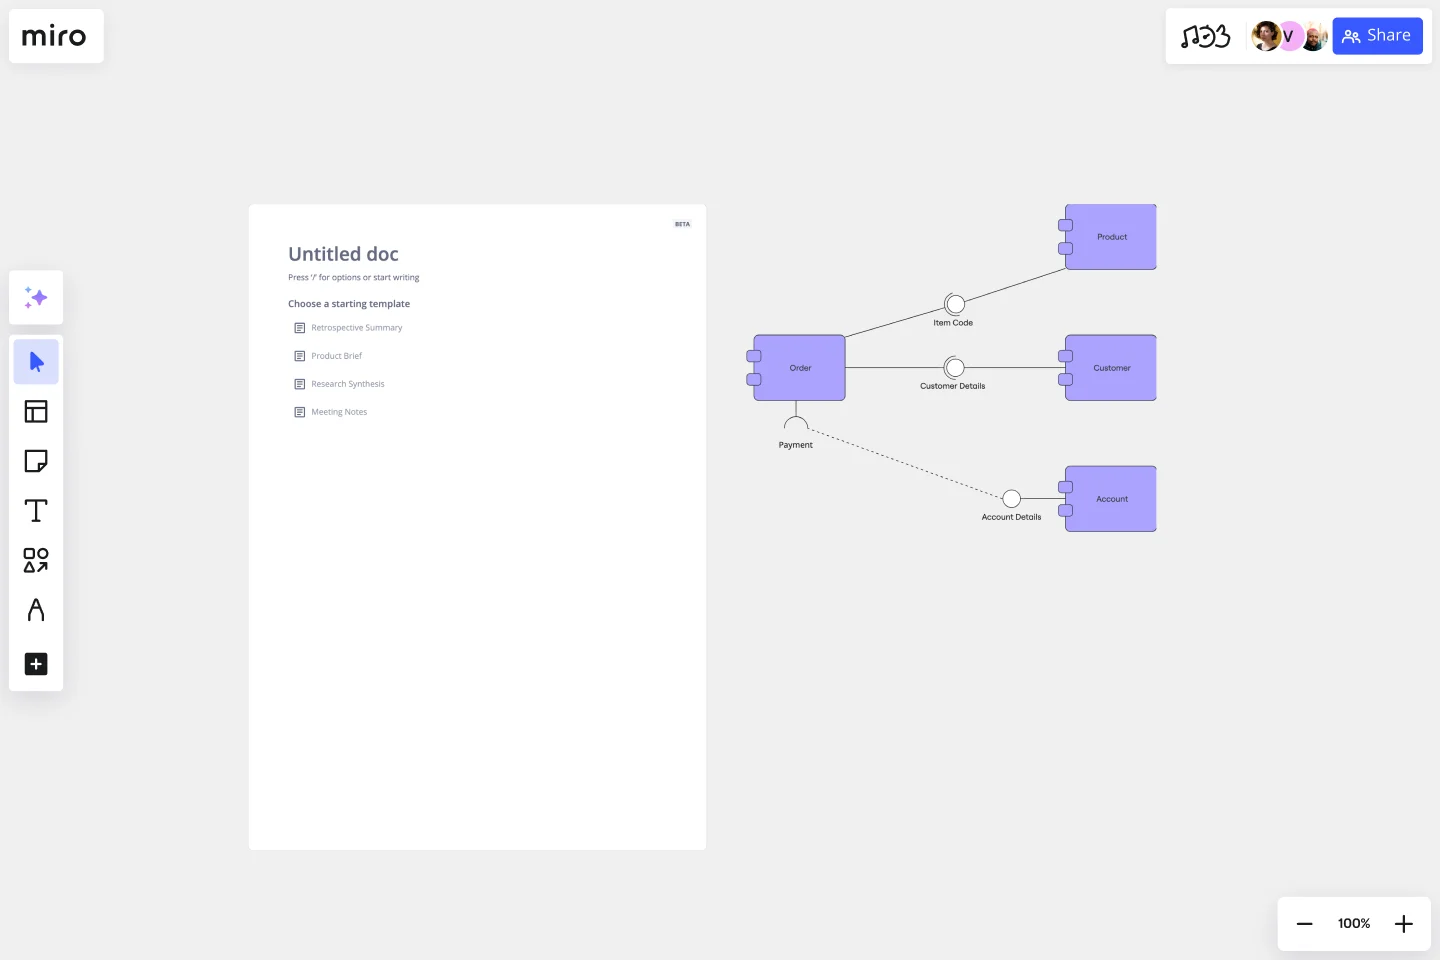
Component diagram example: e-commerce website
Let’s take a look at an example of a component diagram depicting an e-commerce website. In this case, you’d make sure the component diagram template illustrates all the physical components and artifacts that make up an e-commerce system. Here are some components you’d include:
Suppliers
Components labeled “suppliers” might refer to warehouses that stock and re-sell goods or fulfill physical orders. It could also include production facilities, like factories and workshops. Supplier components typically connect to transportation, logistics, manufacturing, and other adjacent components.
Goods
Physical goods are another common component of a diagram representing an e-commerce website. You could visualize them independently of other components, or visualize them as part of a factory, a store, or a warehouse.
The receiving customer
Since the receiving customer is a physical entity too, it’s worth representing them on the component diagram template. Though you’d likely separate them from the rest of your components since they only interact with the system and aren’t actually part of it.
When should I use a UML component diagram?
A UML component diagram shows the components and artifacts in a system and the structural relationship between these components and artifacts. You can use component diagrams to plan, create, and optimize system components at a high level — in software development, business process planning, and other complex processes across digital and business.
Can I collaborate with others on the UML component diagram template?
Yes, Miro brings teams together — whether you’re working remotely or in person. Invite your team to edit your Miro board with you in real-time or async — or get instant feedback by inviting them to view and comment on the component diagram template. You can also run live and interactive presentations right from your Miro board using Use Presentation Mode, or use TalkTrack to record immersive audio and video walkthroughs your team can watch in their own time.
Does Miro offer a shape pack for UML diagramming?
Yes, Miro offers plenty of specialized shape packs, including a UML shape pack — allowing you to fill out the component diagram template with industry-standard symbols. Get access to our UML shape pack with a Business, Enterprise, or Education plan.
Get started with this template right now. Available on Enterprise, Business, Education plans.
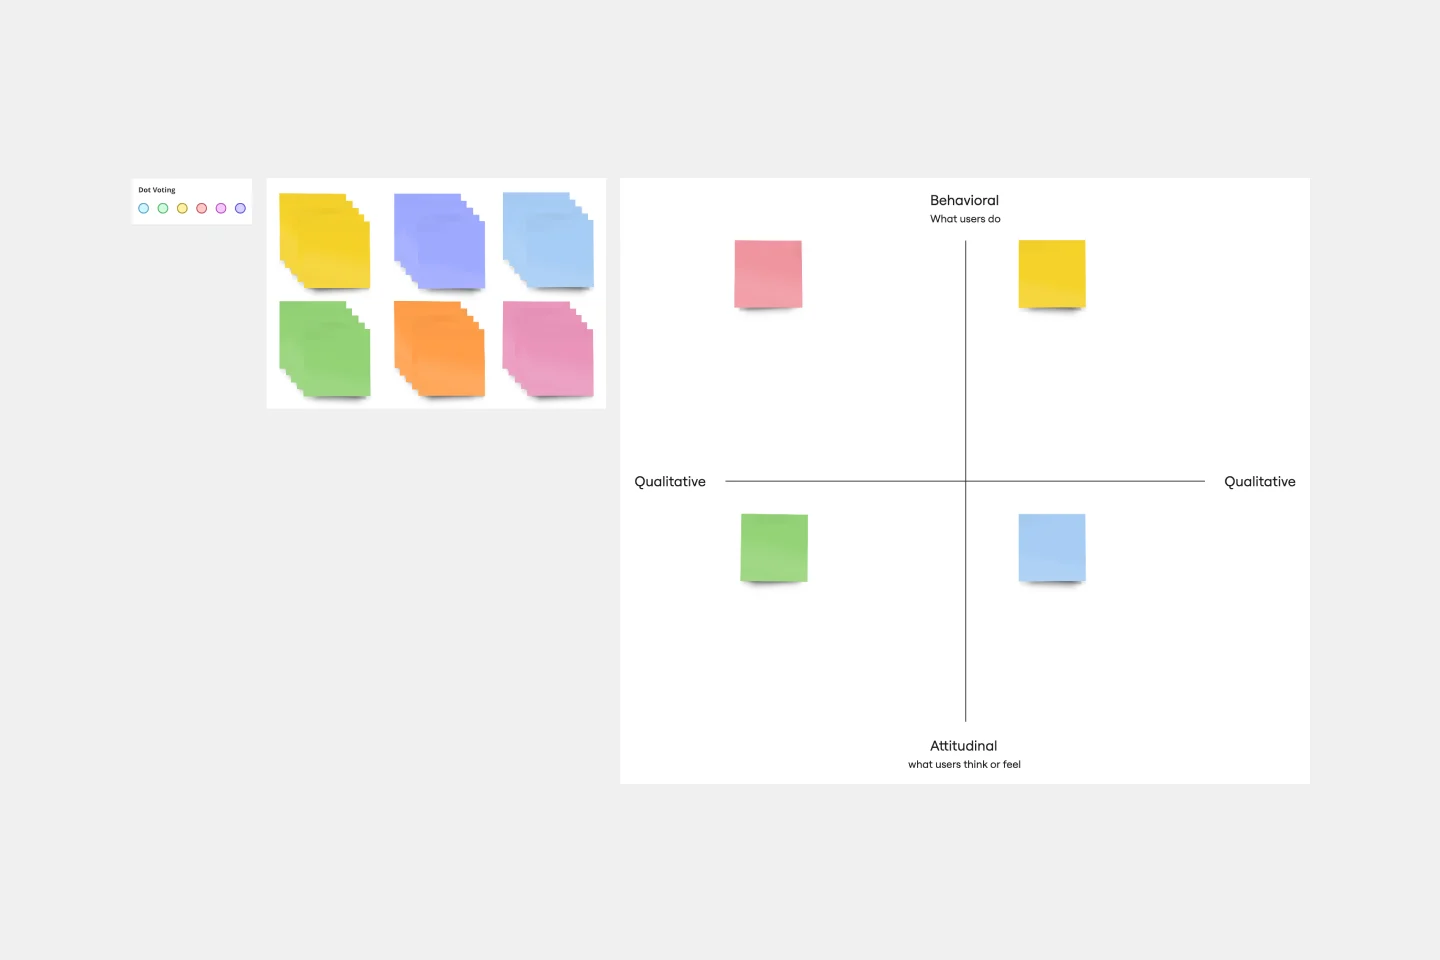
Design Research Template
Works best for:
UX Design, Design Thinking, Desk Research
A design research map is a grid framework showing the relationship between two key intersections in research methodologies: mindset and approach. Design research maps encourage your team or clients to develop new business strategies using generative design thinking. Originally designed by academic Liz Sanders, the framework is meant to resolve confusion or overlap between research and design methods. Whether your team is in problem-solving or problem space definition mode, using a research design template can help you consider the collective value of many unrelated practices.
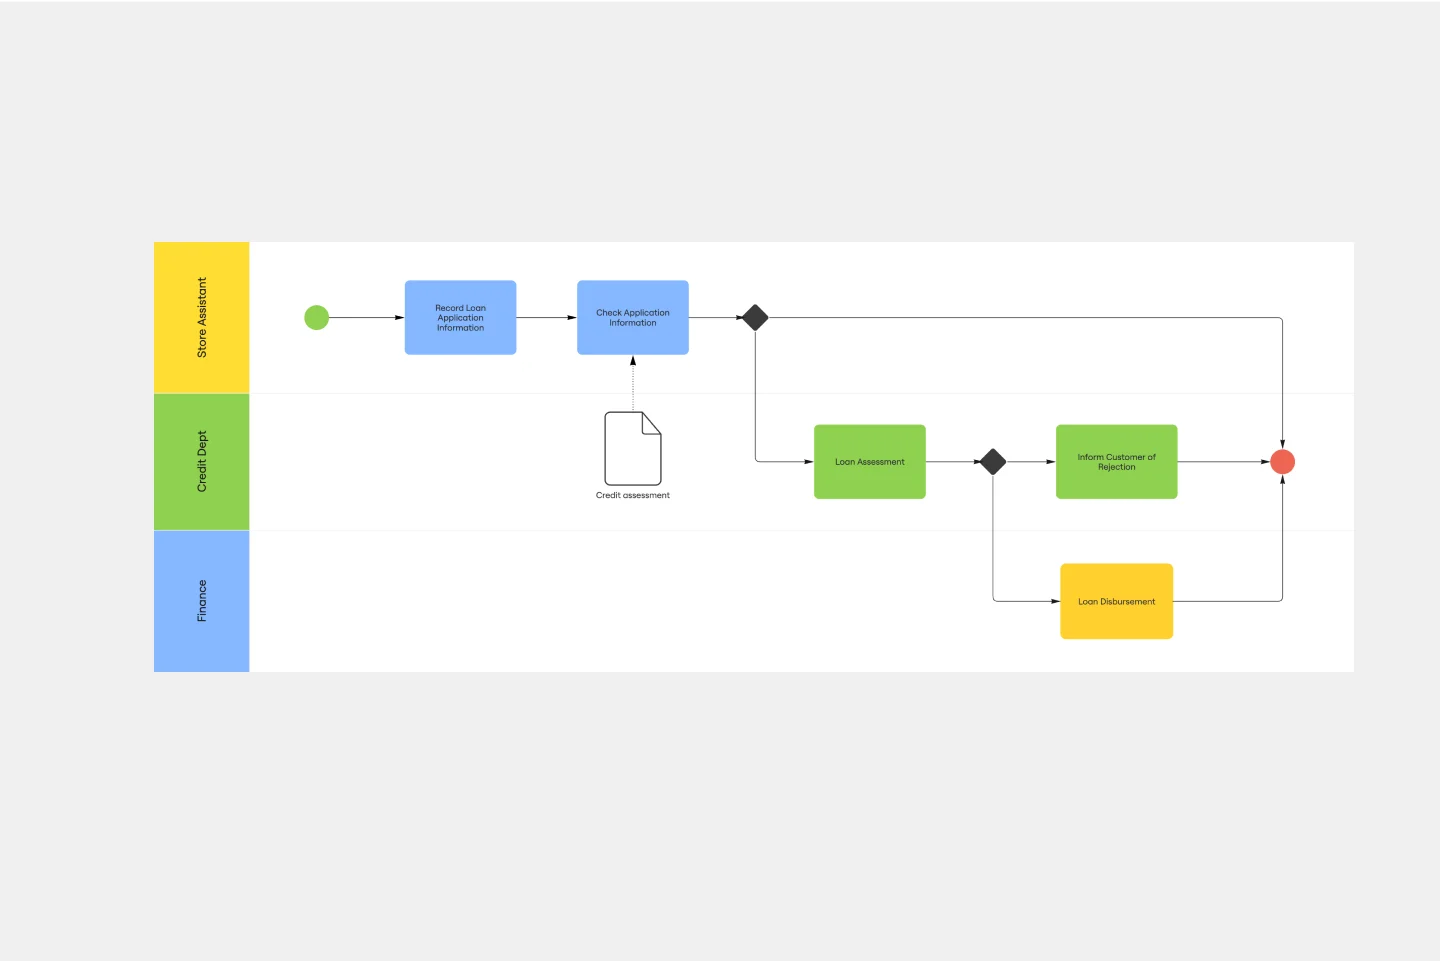
BPMN Template
Works best for:
Mapping, Diagrams, Business Management
The BPMN template helps you track and get an overview of your business processes. It’s a great way to identify any bottlenecks and make your operations more efficient. The BPMN methodology became a universal language when managing business processes, and multiple industries use it as a management tool. Project managers, business analysts, and IT administrators use the BPMN process flow diagram to manage projects, visually communicate the process flows, and keep track of process constraints. Try it for yourself and see improvements in your organization’s agility.
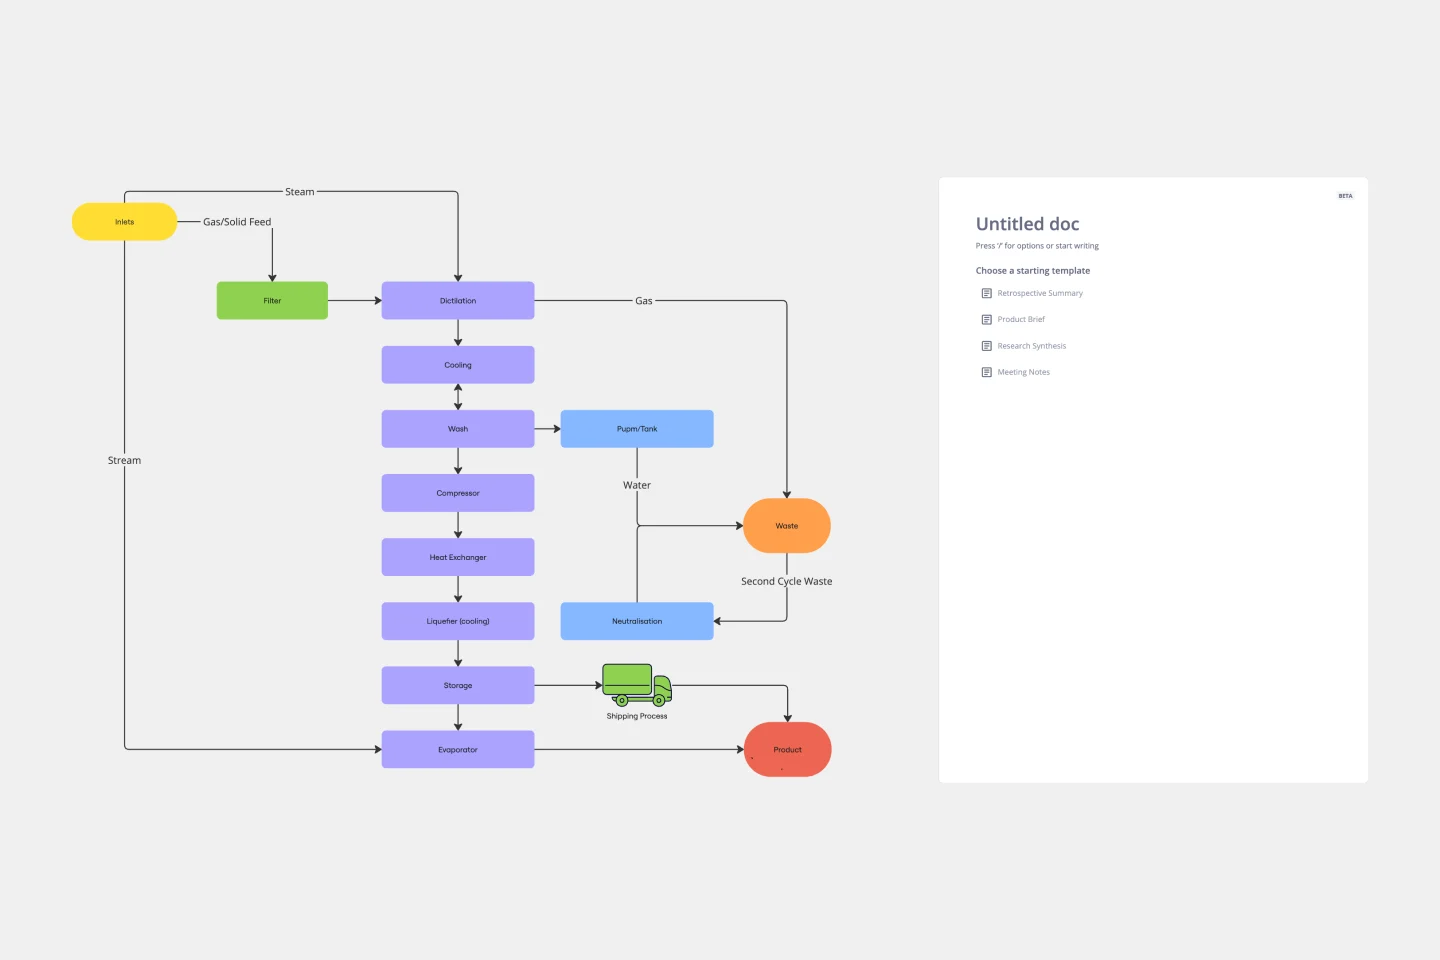
Block Diagram Template
Works best for:
Mapping, Software Development, Diagrams
Use this template to illustrate technical systems. Blocks represent important objects in the system, and arrows demonstrate how the objects relate to each other. Perfect for engineers, workflow managers, or anyone trying to build a better process.
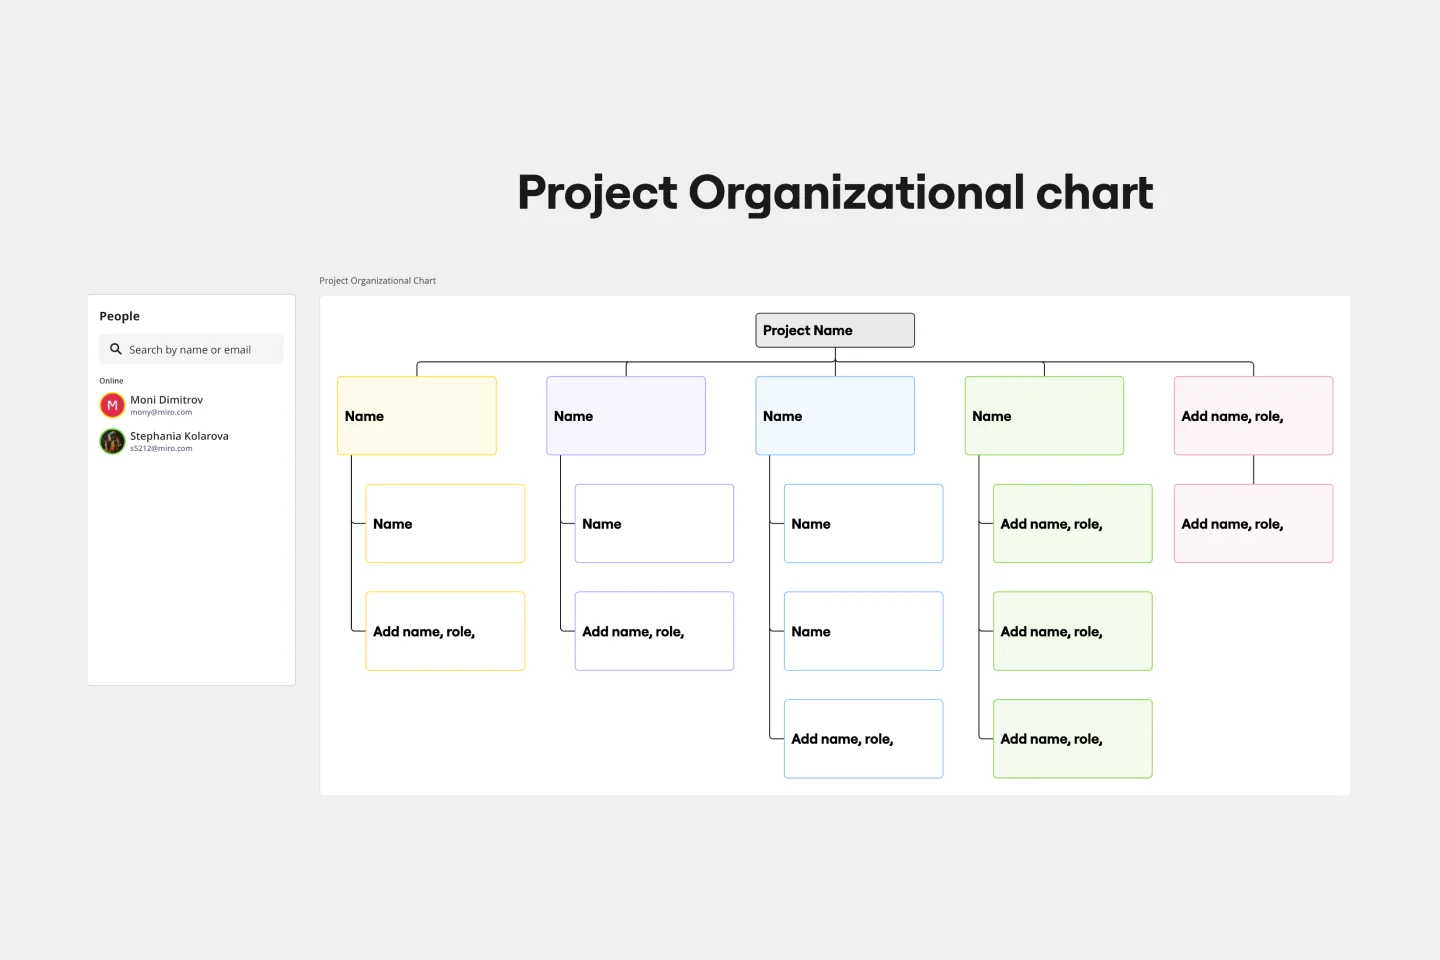
Project Organizational Chart Template
Works best for:
Project Management, Documentation, Org Charts
When you’re embarking on a long, complex project, you will inevitably hit roadblocks and obstacles. It’s important to have your project organizational chart on hand to overcome those challenges. A project organizational chart is a visual diagram that illustrates who is on your team and the role they play in a given project. It documents the structure of the project organization, the hierarchy between team members, and the relationships between employees. Project organizational charts are useful tools for clarifying who does what, securing buy-in, and setting expectations for the group.
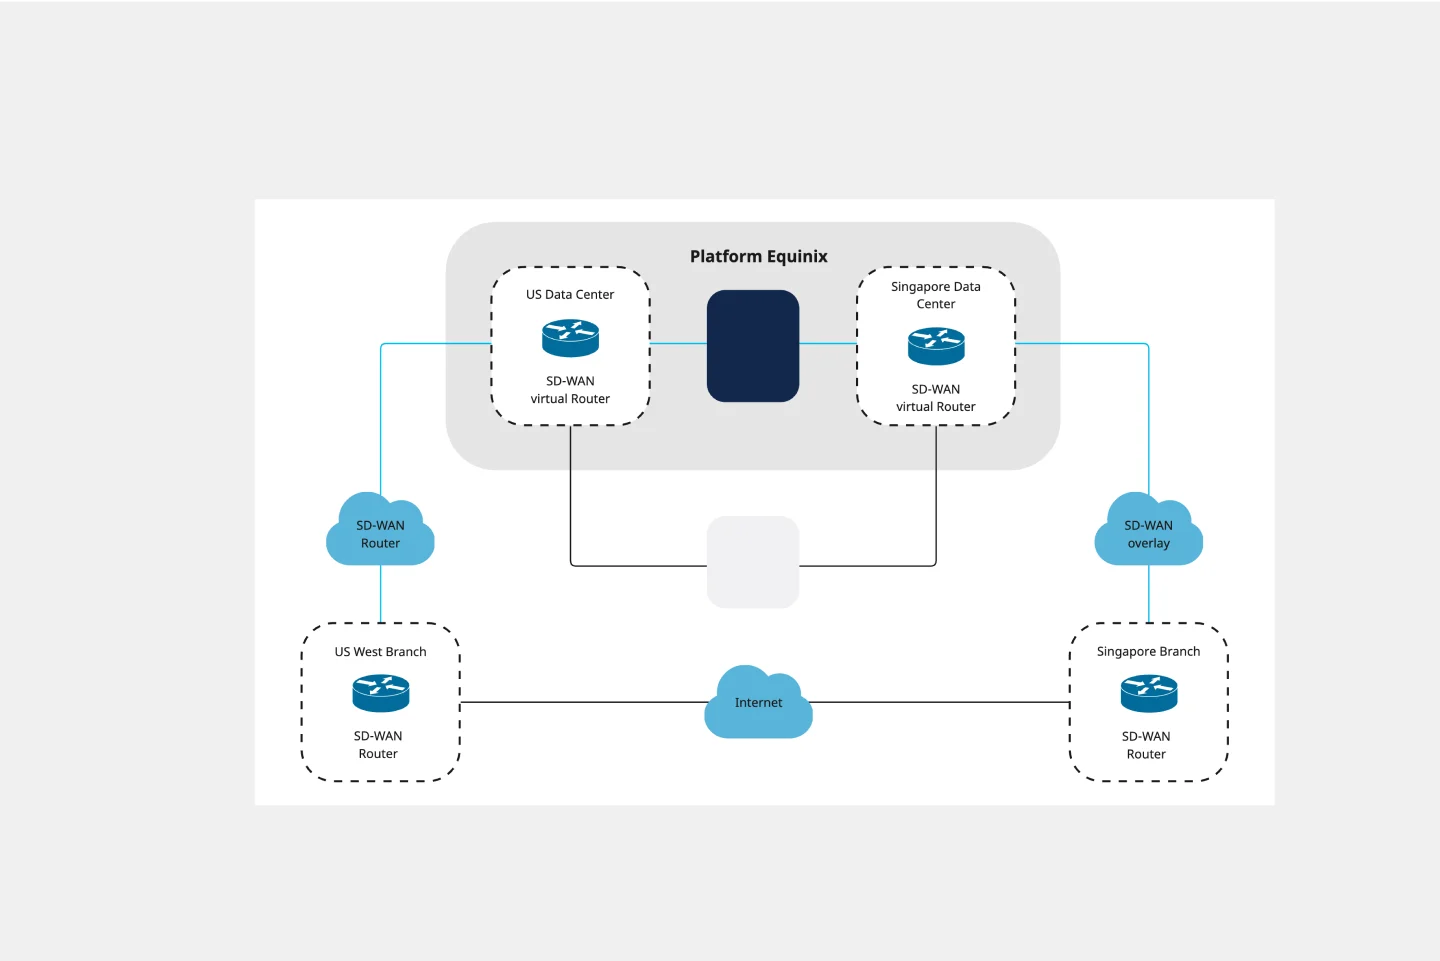
Cisco Data Network Diagram Template
Works best for:
Software Development
Cisco offers data center and access networking solutions built for scale with industry-leading automation, programmability, and real-time visibility. The Cisco Data Network Diagram uses Cisco elements to show the network design of Cisco Data Networks visually.
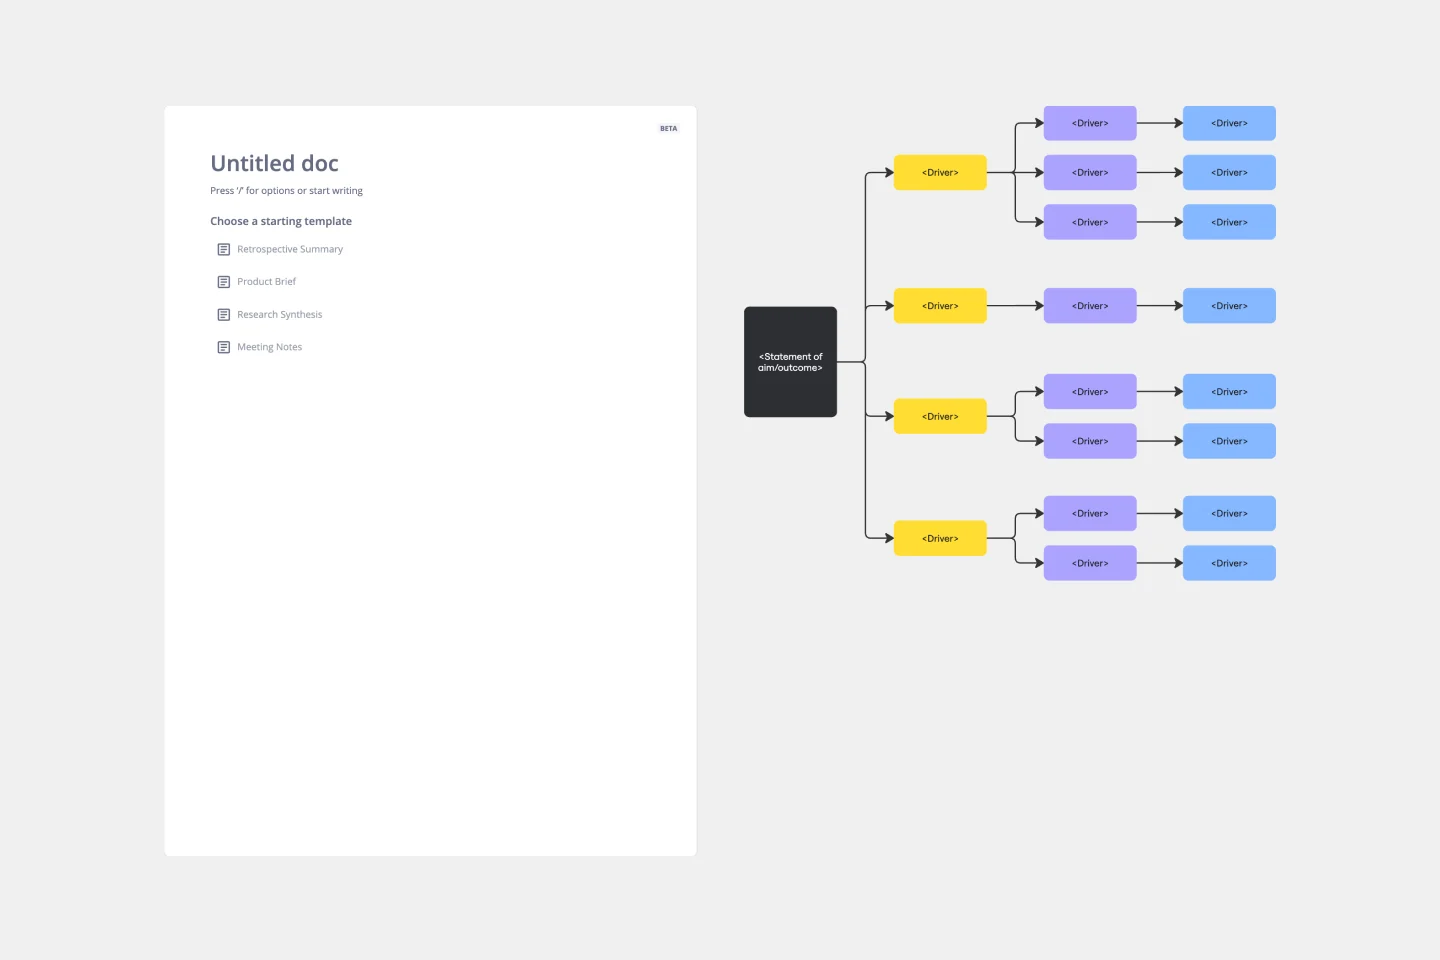
Driver Diagram Template
Works best for:
Diagramming
The driver diagram template is a strategic visual tool that helps teams map out their primary objectives and break them down into actionable components. It presents goals, drivers, and specific change ideas in a coherent and interconnected format, ensuring clarity of objective. By doing so, every team member is aligned towards a common endpoint, fostering unified efforts. The visual nature of the template simplifies complex objectives, making it easier for teams to stay on track and measure their progress effectively.