UML Class Diagram by Dmitry Ermakov
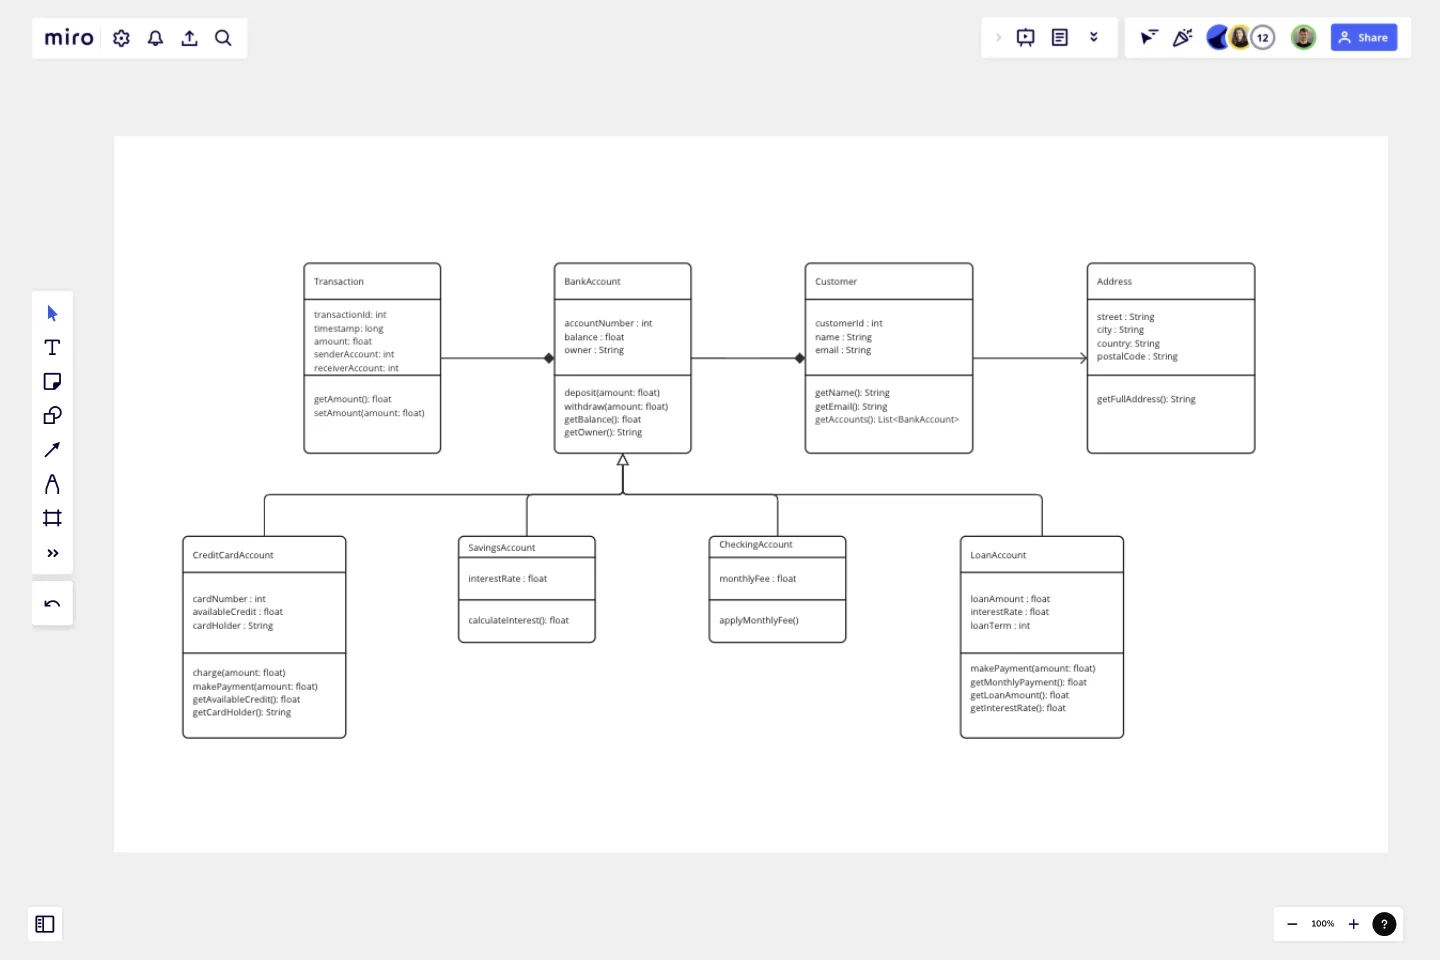
A UML (Unified Modeling Language) Class diagram is a visual representation that shows the structure and relationships of classes in a system or software application.
It provides an overview of the objects or entities in the system, their attributes (data), and their relationships with other classes.
In simple terms, you can think of a UML Class diagram as a blueprint or a map that helps you understand how different parts of a system or program are connected. It shows the building blocks of the system (classes) and how they interact with each other.
What to pay attention to
In a Class diagram, each class is represented as a box with three sections:
The top section contains the class name.
The middle section lists the attributes or properties of the class.
The bottom section shows the methods or behaviors that the class can perform.
The relationships between classes are represented by lines connecting the boxes. These relationships can include associations (connections between classes), generalization or inheritance (when one class inherits from another), aggregation or composition (when one class contains or is composed of another), and more.
Who this template is for
Overall, a UML Class diagram helps developers, designers, and stakeholders visualize and understand the structure of a system, the interactions between classes, and the behavior of objects within the system. It serves as a powerful communication tool for discussing, designing, and documenting software systems.
How to use a template
Use a template by adding it to a new or an exiting Miro board, and follow the intsructions on the board.
This template was created by Dmitry Ermakov.
Get started with this template right now.
Pie Chart Template
Works best for:
Education, Operations
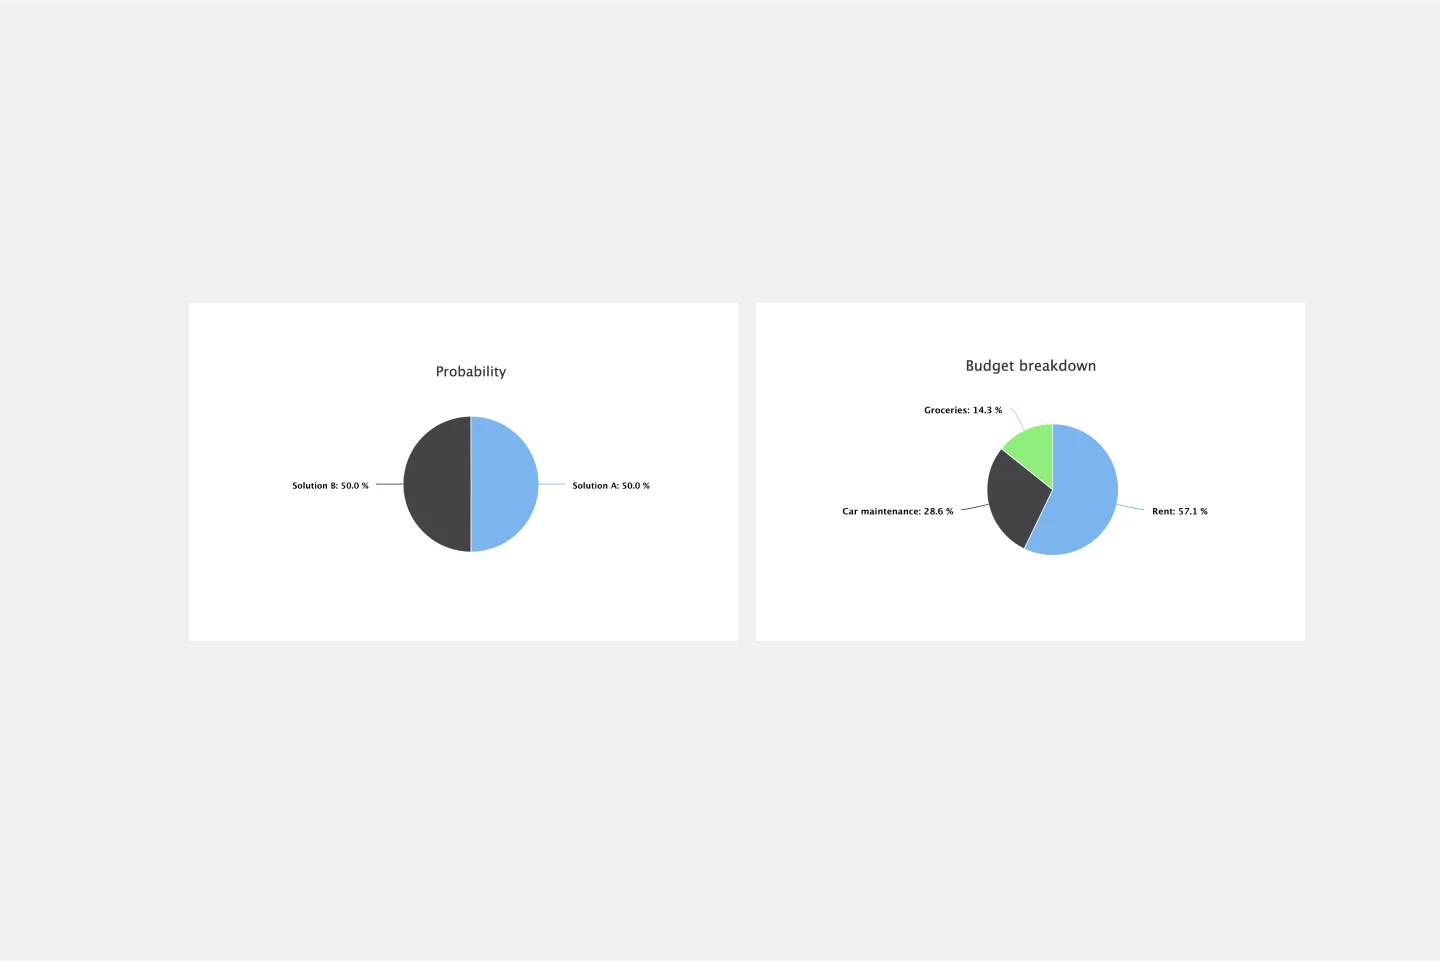
Pie charts are an excellent way to present relationships between datasets graphically, where you can quickly compare information and see contrast right away. Professionals from many fields use pie charts to support their presentations and enrich their storytelling as it’s one of the most commonly used data charts.

BPM
Works best for:
Diagramming
The BPM (Business Process Management) template is a visual tool for modeling, analyzing, and optimizing business processes. It provides a structured framework for documenting process flows, identifying bottlenecks, and improving efficiency. This template enables organizations to streamline operations, enhance productivity, and drive business performance. By promoting process transparency and agility, the BPM template empowers teams to achieve operational excellence and deliver value to stakeholders.
UML Sequence Diagram Template
Works best for:
Software Development, Mapping, Diagrams
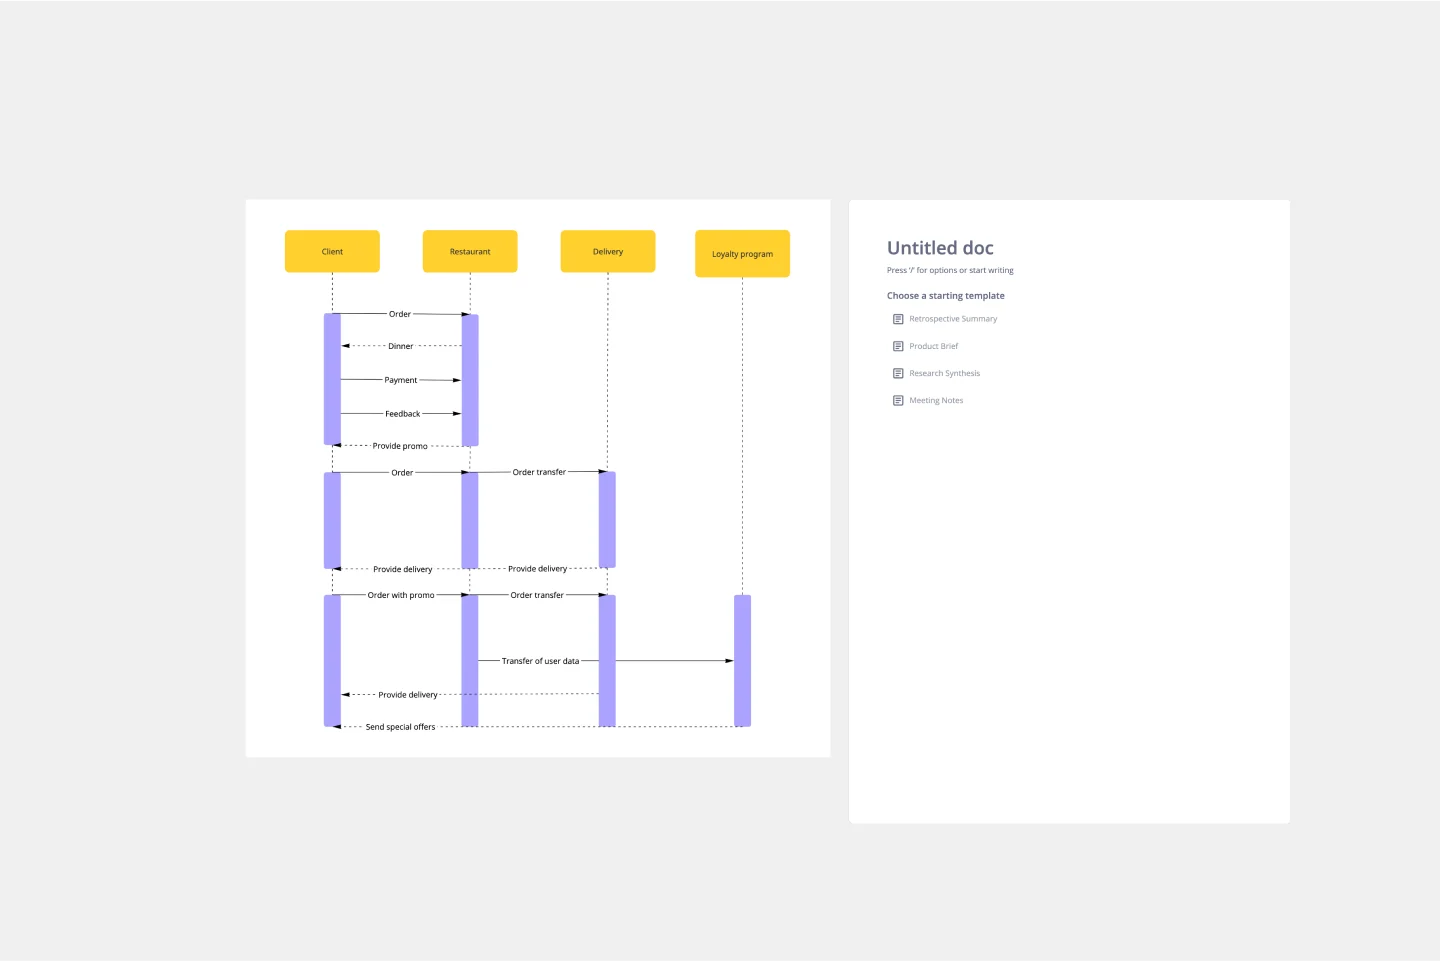
Analyze and showcase how external entities interact with your system using a sequence diagram. Get a bird’s-eye view of your work processes, business functions, and customer interactions using this diagram. Also, identify any potential problems early and solve them before implementation.
Value Network Mapping (1.0)
The Value Network Mapping (1.0) template is a visual tool for analyzing and optimizing the relationships and interactions between stakeholders within a network. It provides a structured framework for mapping out value exchanges, dependencies, and opportunities for collaboration. This template enables teams to gain insights into the dynamics of their ecosystem, identify key actors, and align strategies for mutual benefit. By promoting transparency and collaboration, Value Network Mapping empowers organizations to enhance value creation and foster strategic partnerships.
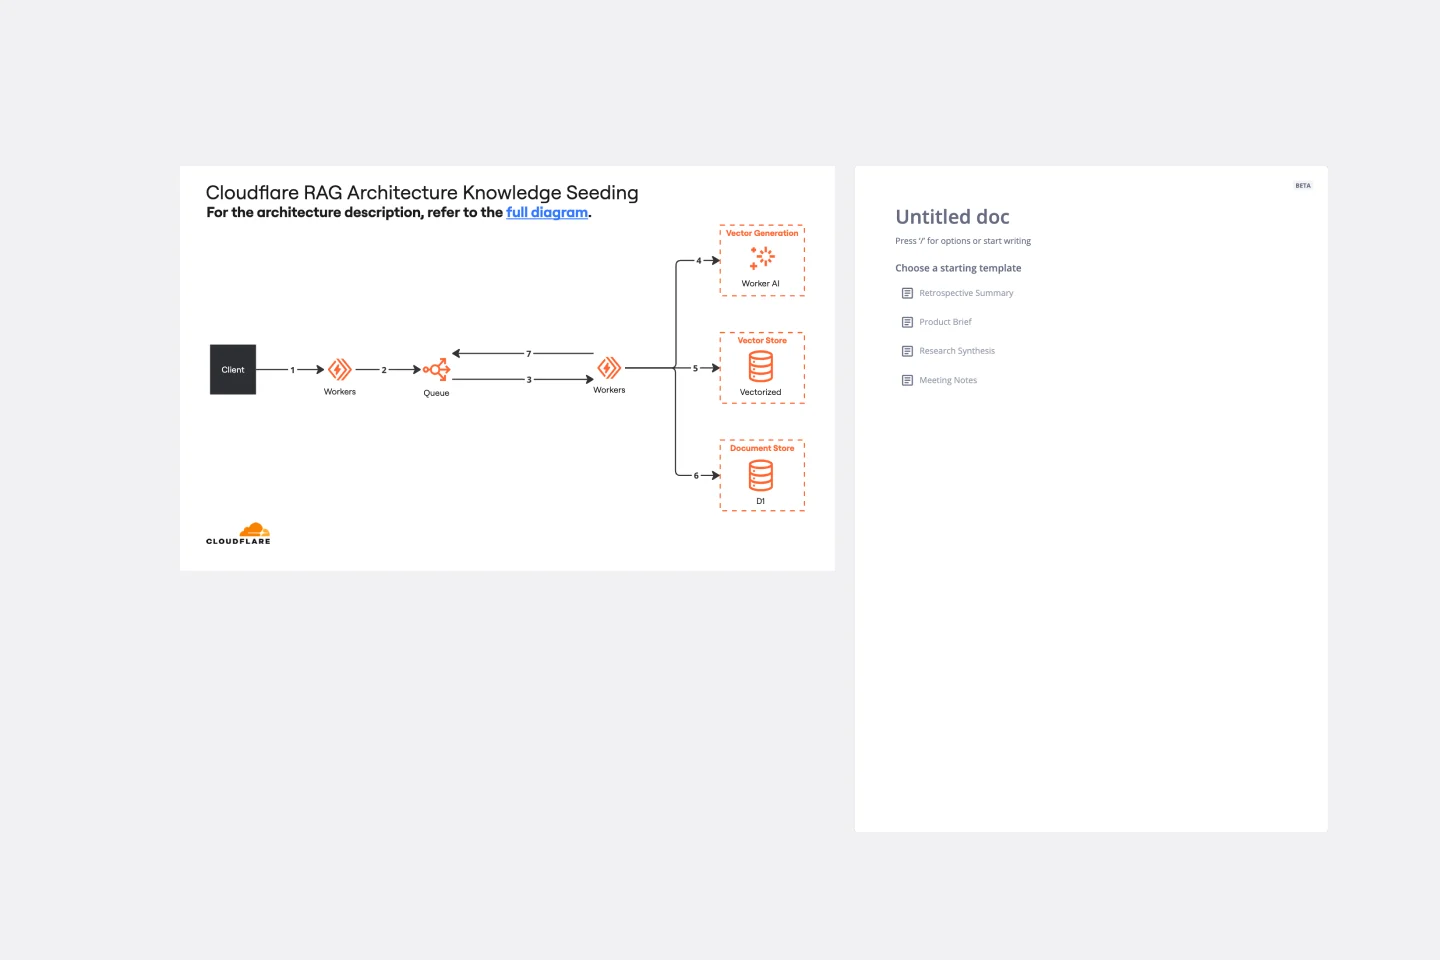
Cloudflare RAG Architecture Knowledge Seeding Template
The Cloudflare RAG Architecture Knowledge Seeding template in Miro streamlines the sharing and visualization of cloud architecture knowledge, making it ideal for tasks like cloud infrastructure optimization and diagram creation. This template enables straightforward documentation and collaboration, ensuring complex information is accessible to all team members.
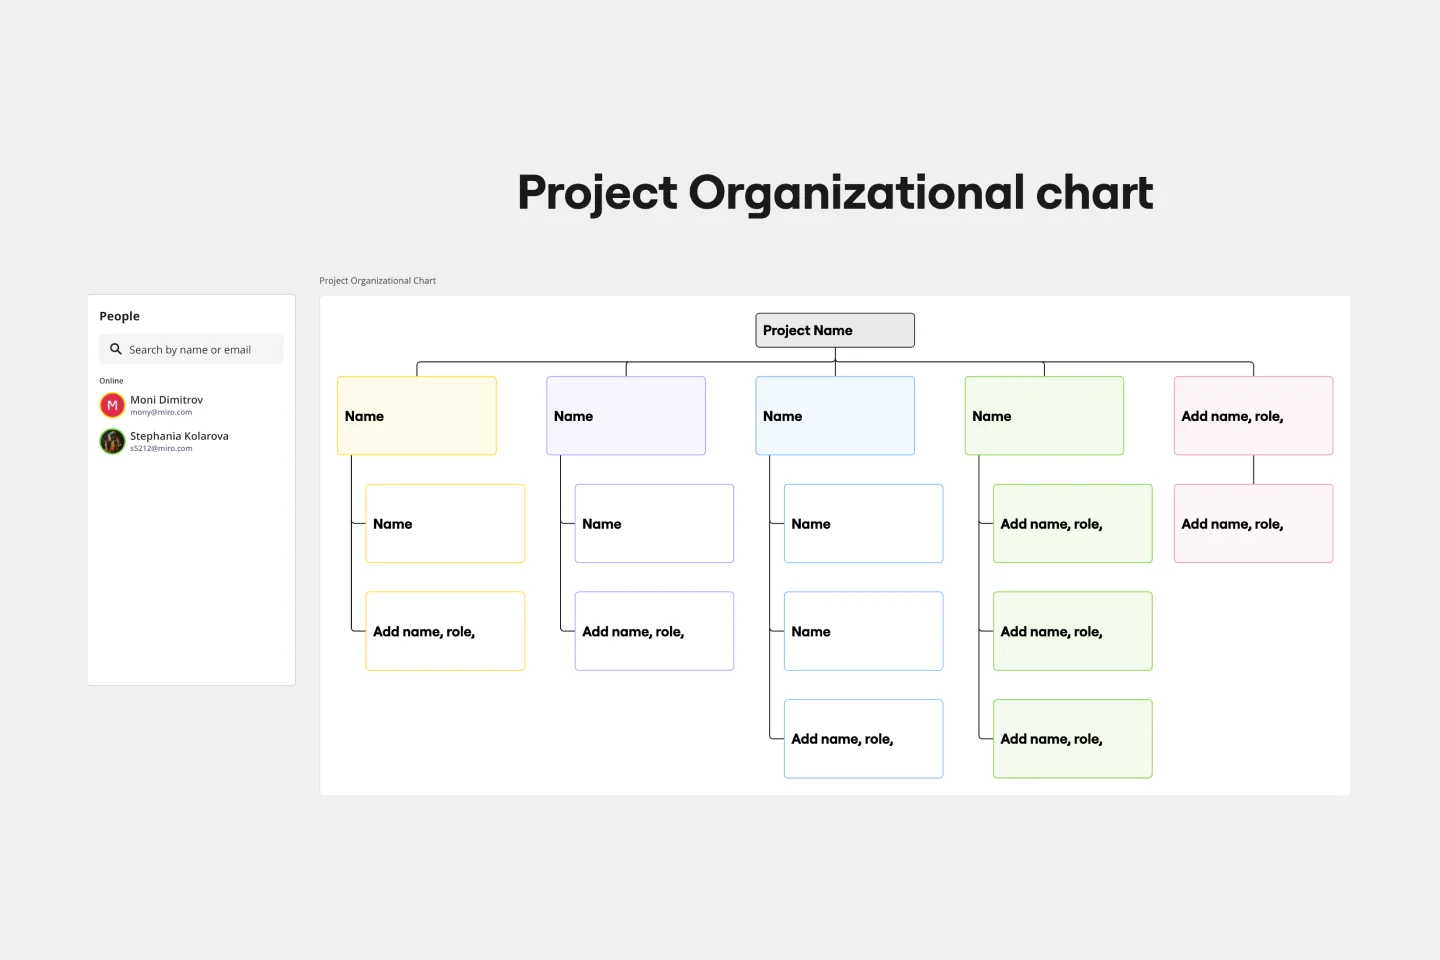
Project Organizational Chart Template
Works best for:
Project Management, Documentation, Org Charts
When you’re embarking on a long, complex project, you will inevitably hit roadblocks and obstacles. It’s important to have your project organizational chart on hand to overcome those challenges. A project organizational chart is a visual diagram that illustrates who is on your team and the role they play in a given project. It documents the structure of the project organization, the hierarchy between team members, and the relationships between employees. Project organizational charts are useful tools for clarifying who does what, securing buy-in, and setting expectations for the group.