Turtle Diagram for BA
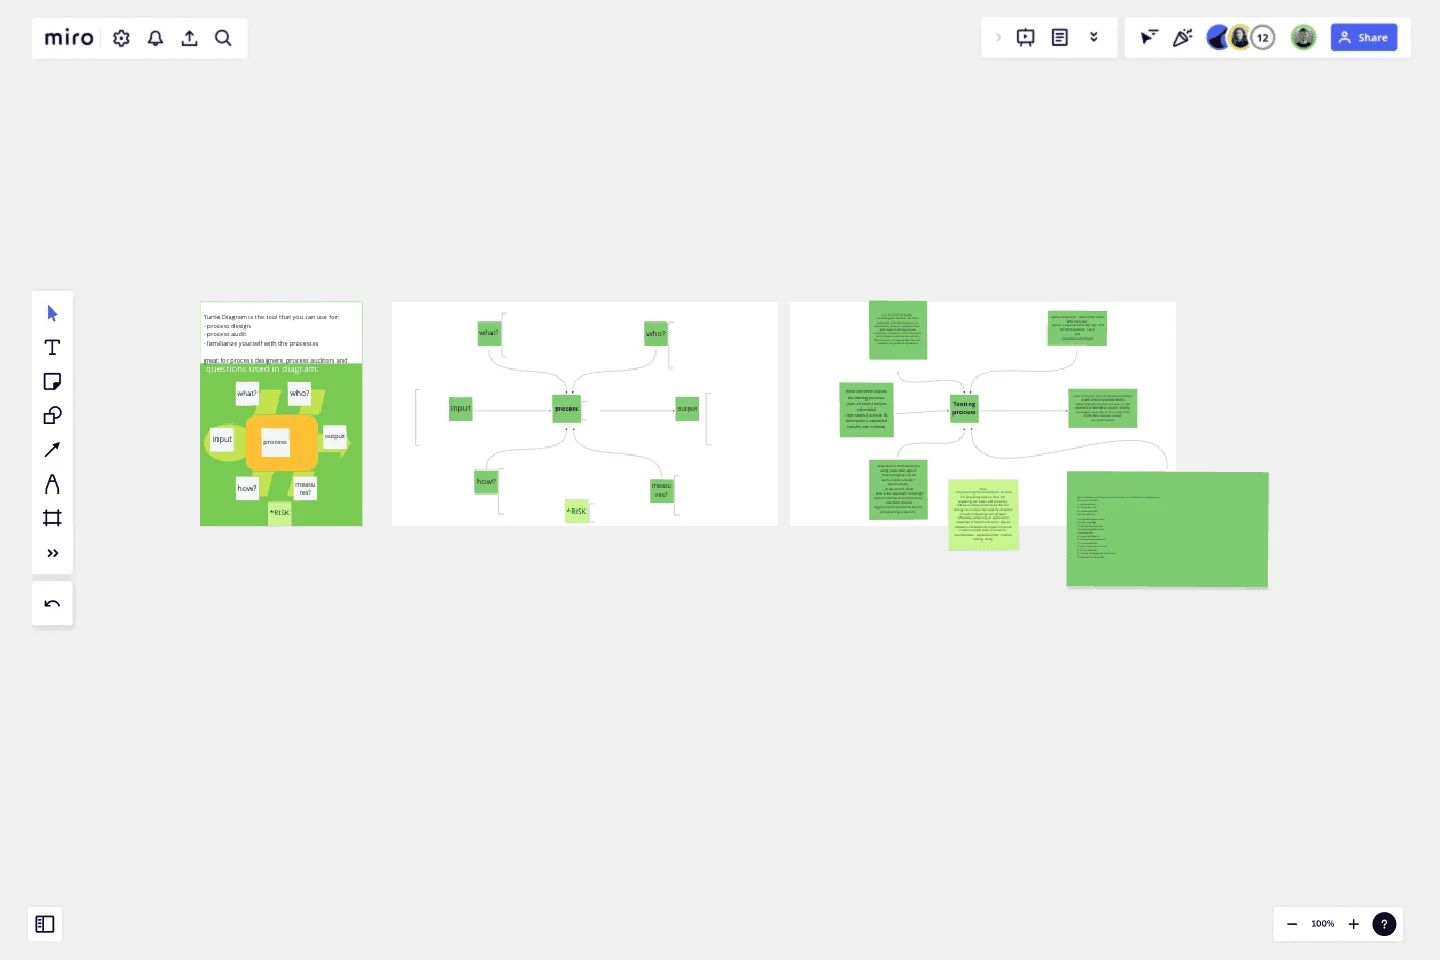
We present the Turtle diagram, which is a great tool for building and managing processes, but also for understanding them.
I present to you the Turtle diagram, which is a great tool for building and managing processes, but also for understanding them. The tool may be useful for:
requirements elicitation (Business Analysts),
process design ( Process Designers),
brainstorming (Quality Team meetings) and,
audits (internal and external Auditors).
The diagram consists of identifications basic of data such as:
name
input and
output of the process.
Additionally, it allows you to name and assign information related to the process, answering questions such as:
what is necessary to perform process?
who is performing process?
how is the process performing?
measures? what is the goal and what kind of KPIs we use?
In the case of more complex problems or more detailed requirements, a perspective on the risks that may occur in the process can be added.
The prepared diagram includes an explanation, along with a map and description, as well as an example of use.
Get started with this template right now.
OutSystems Architecture Diagram
Works best for:
Diagramming
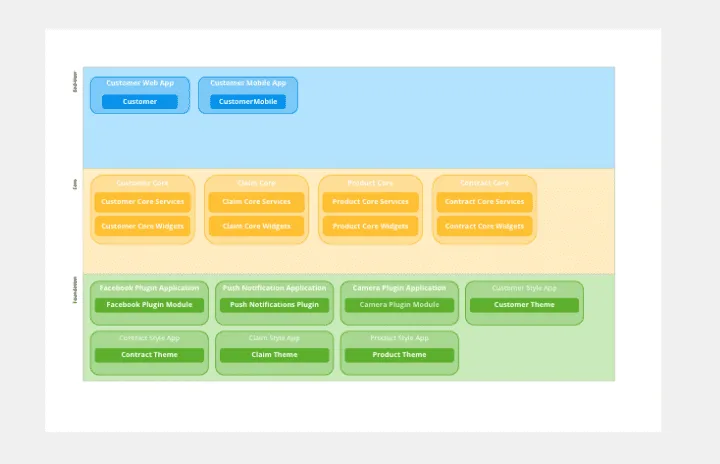
The OutSystems Architecture Diagram template offers a visual tool for designing and documenting software architectures using the OutSystems platform. It provides elements for modeling application components, data structures, and integration points. This template enables teams to visualize and communicate the architecture of their OutSystems applications, facilitating collaboration and alignment among developers and stakeholders. By promoting clarity and understanding of system architecture, the OutSystems Architecture Diagram empowers teams to build scalable, maintainable, and high-performance applications effectively.
Security Automations for AWS WAF Template
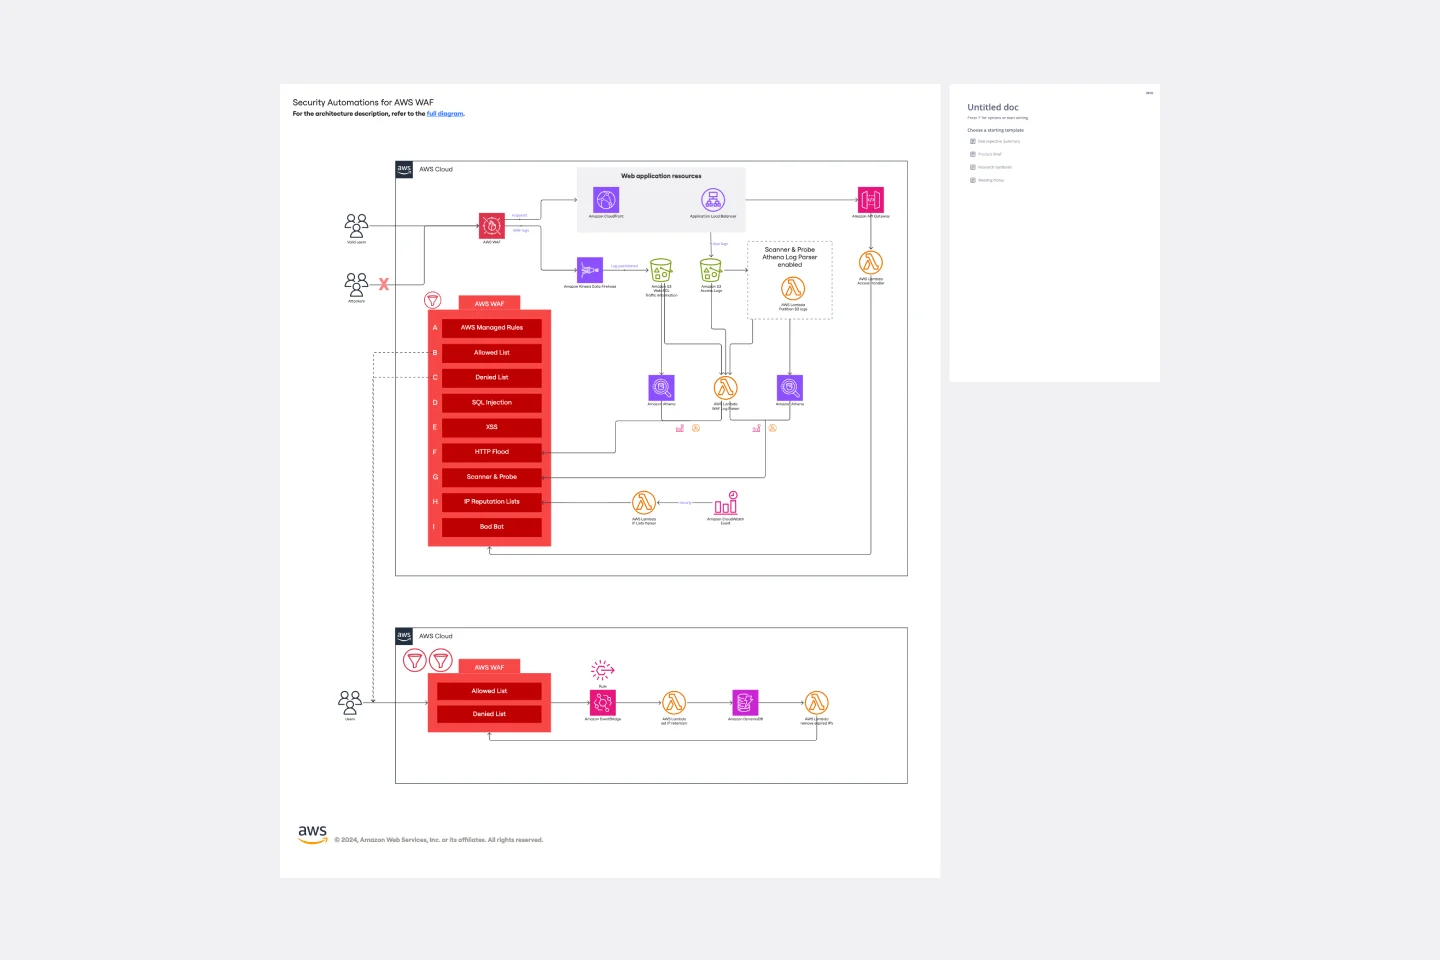
The Security Automations for AWS WAF template is designed to streamline the process of enhancing the security of your AWS applications. It allows teams to collaboratively design, visualize, and refine AWS WAF configurations to protect against common web exploits effectively. This template includes various components such as automated deployment pipelines, instance schedulers, and serverless image handlers, providing a robust framework for managing AWS WAF security automations. By using this template, teams can improve collaboration, achieve a clear visual representation of their AWS WAF configurations, enhance efficiency in managing AWS WAF rules, and customize the template to meet specific application security needs.
ERD Supply Chain Management System Template
Works best for:
ERD
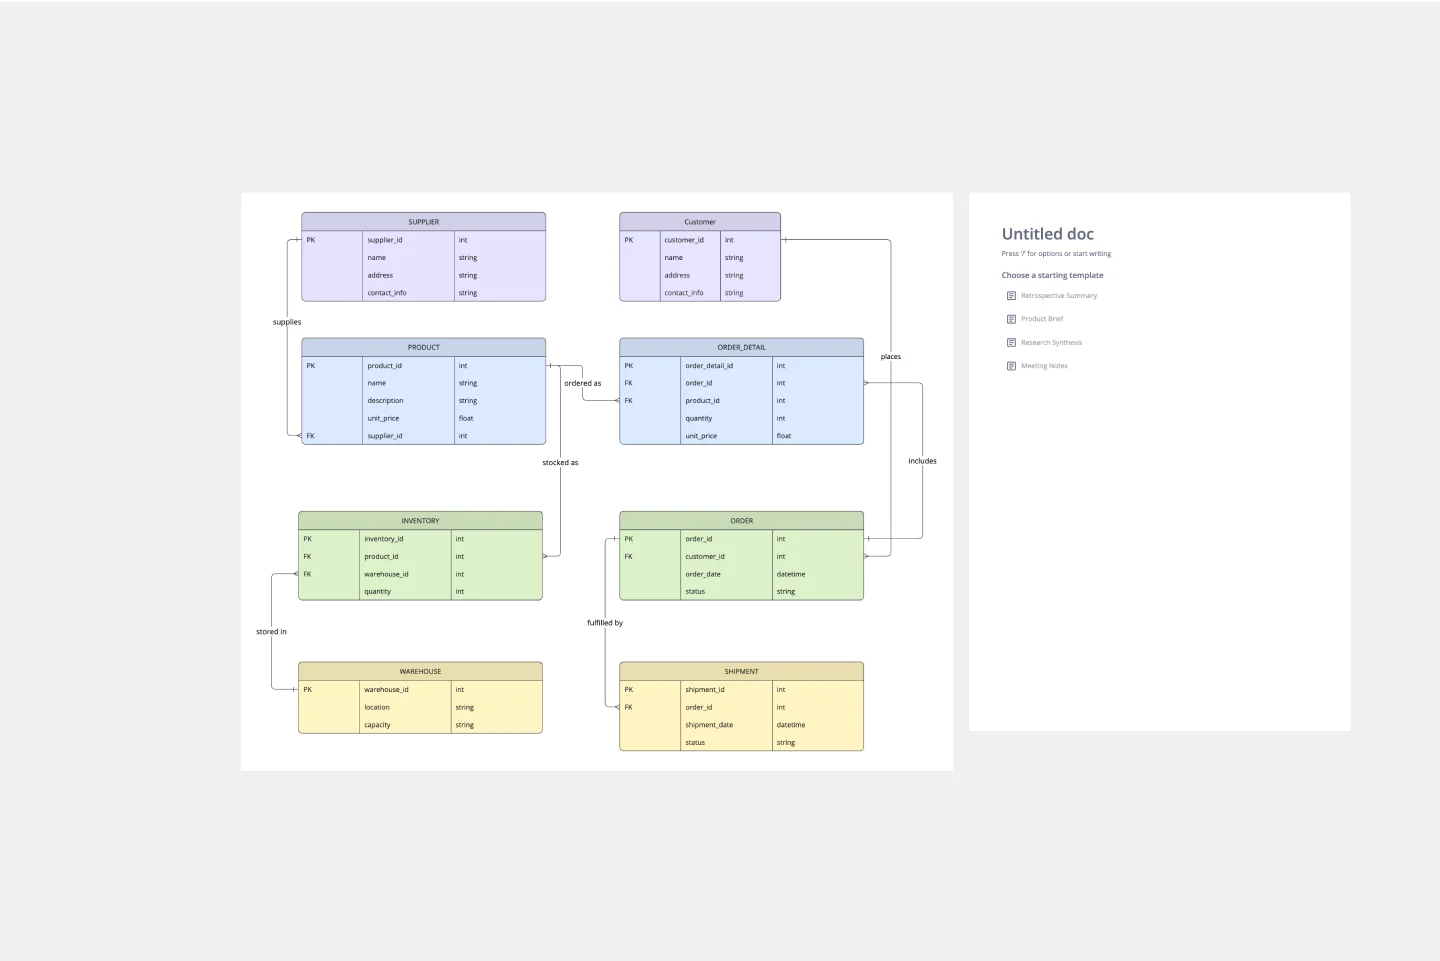
The ERD Supply Chain Management System Template streamlines and optimizes supply chain operations. It serves as a visual support that helps businesses understand and manage the complex relationships between different entities within their supply chain, such as suppliers, products, inventory, orders, and shipments. By providing a clear visualization of these relationships, the template enables users to identify inefficiencies and areas for improvement, facilitating strategic decision-making.
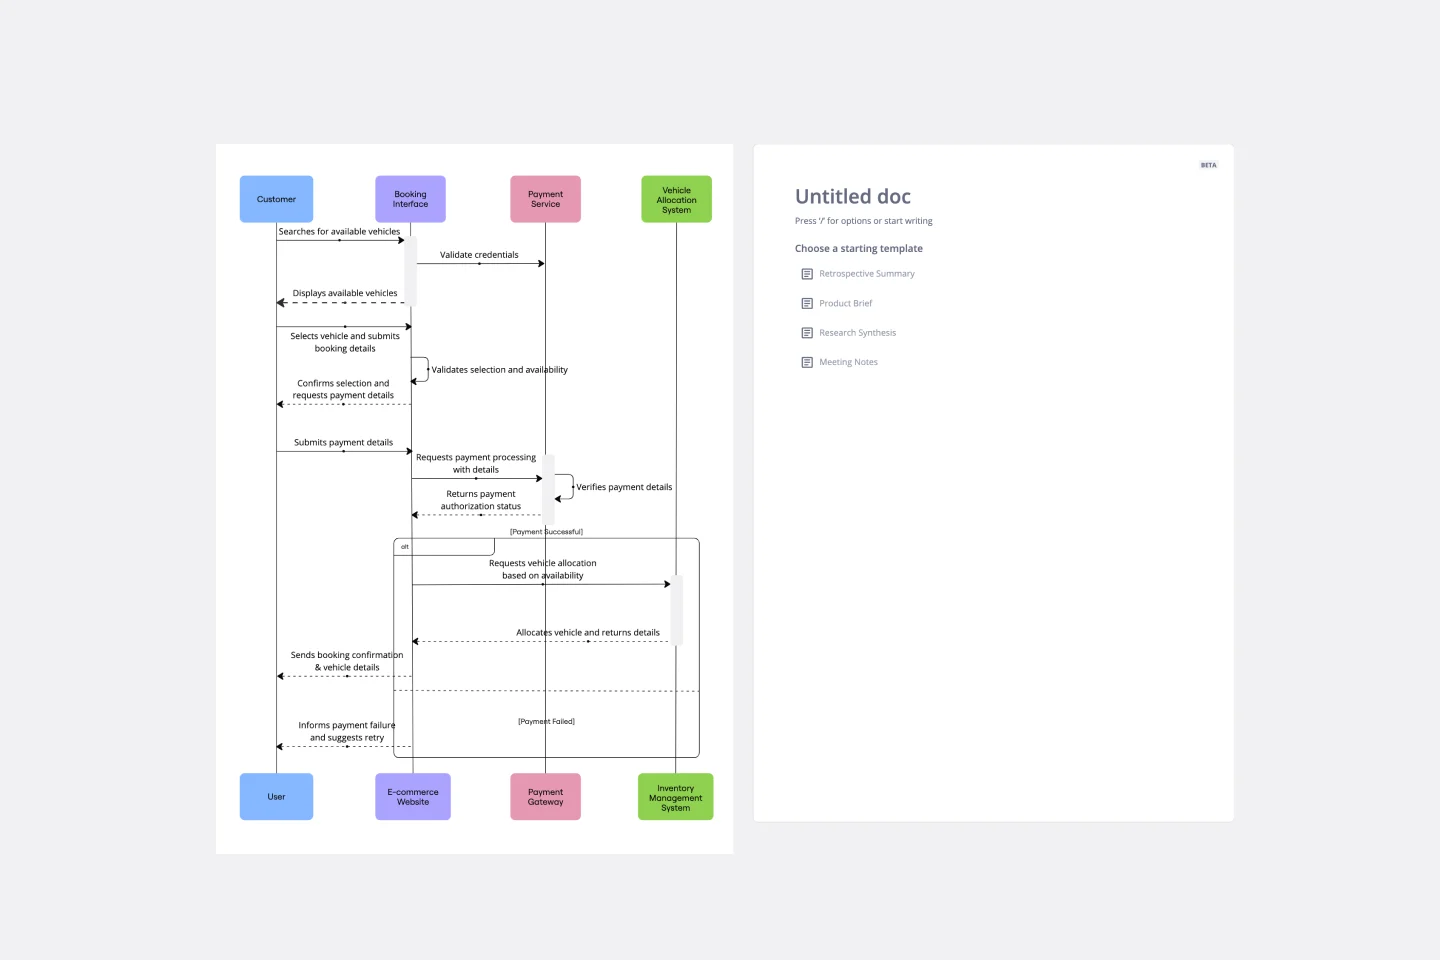
UML Sequence Rental Booking System Template
Works best for:
UML
The UML Sequence Rental Booking System Template streamlines the process of documenting and visualizing the interactions within a car rental booking system. This template maps out the communication flow between the customer, user interface, payment service, and vehicle allocation system, ensuring a smooth and efficient workflow. By providing a clear visual representation of these interactions, the template helps in improving understanding among team members and stakeholders, promoting efficient design and collaboration.
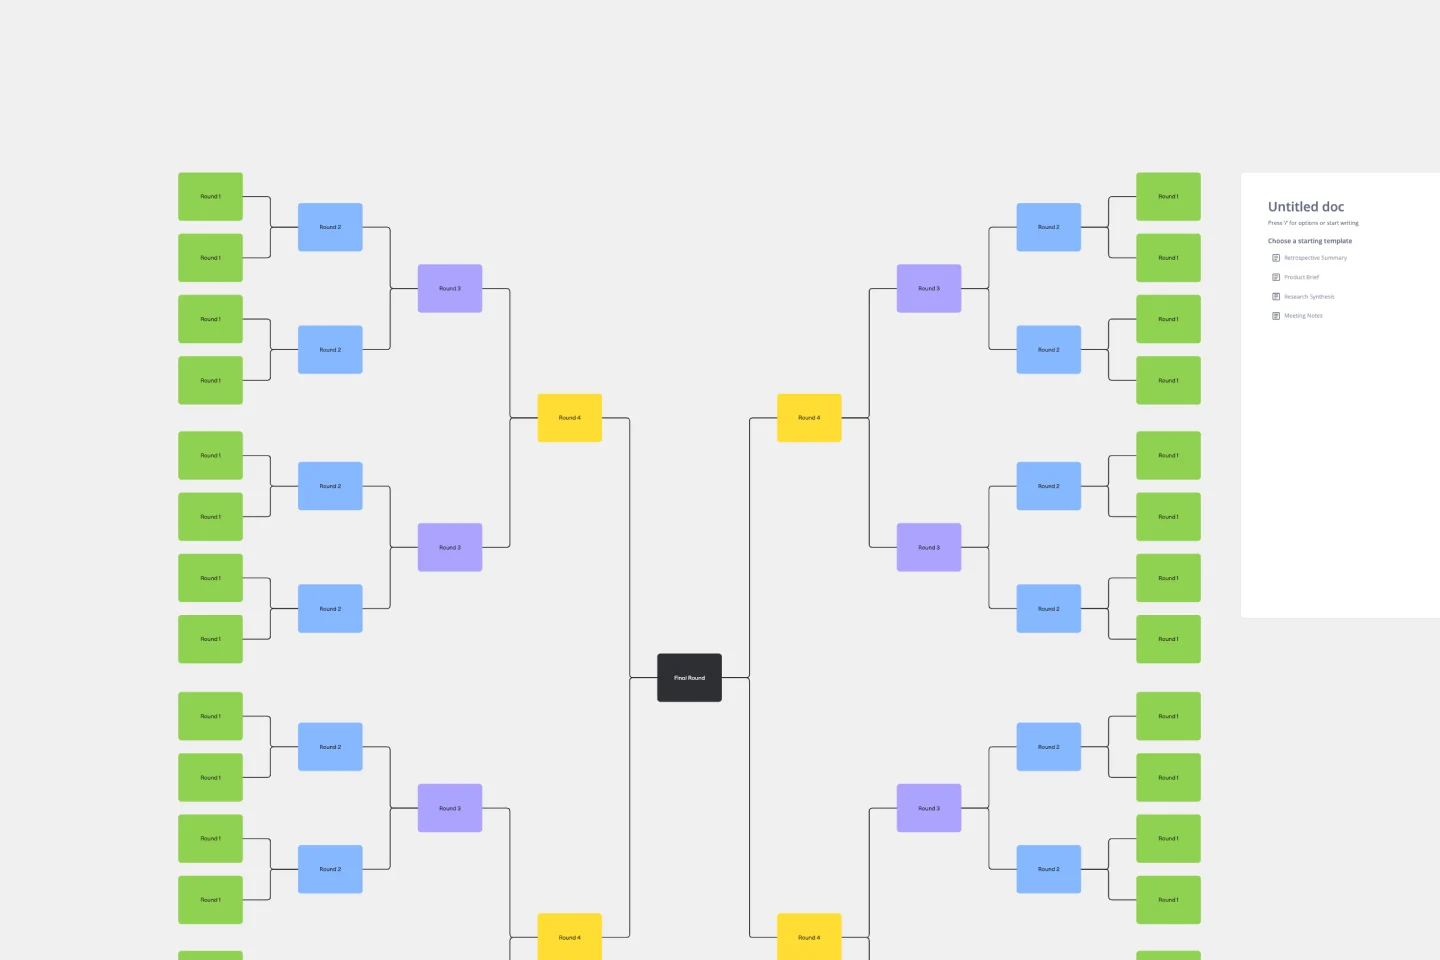
Bracket Template
Works best for:
Diagramming
The Bracket Template is a dynamic visualization tool that helps to organize and rank ideas, entities, or teams in a sequential and competitive manner. It is structured like a tree, starting with multiple entries on either side, which then face off in successive rounds, leading to a single winner or conclusion. One of its standout benefits is its ability to simplify complex decision-making processes. Breaking down choices into smaller, head-to-head comparisons, makes the path to a final decision clearer, ensuring clarity and fostering engagement among participants. Moreover, the Bracket Template is particularly useful when there are multiple options to consider and when there is a need to compare and contrast those options. It is an effective way to streamline decision-making, making it easier and more efficient.
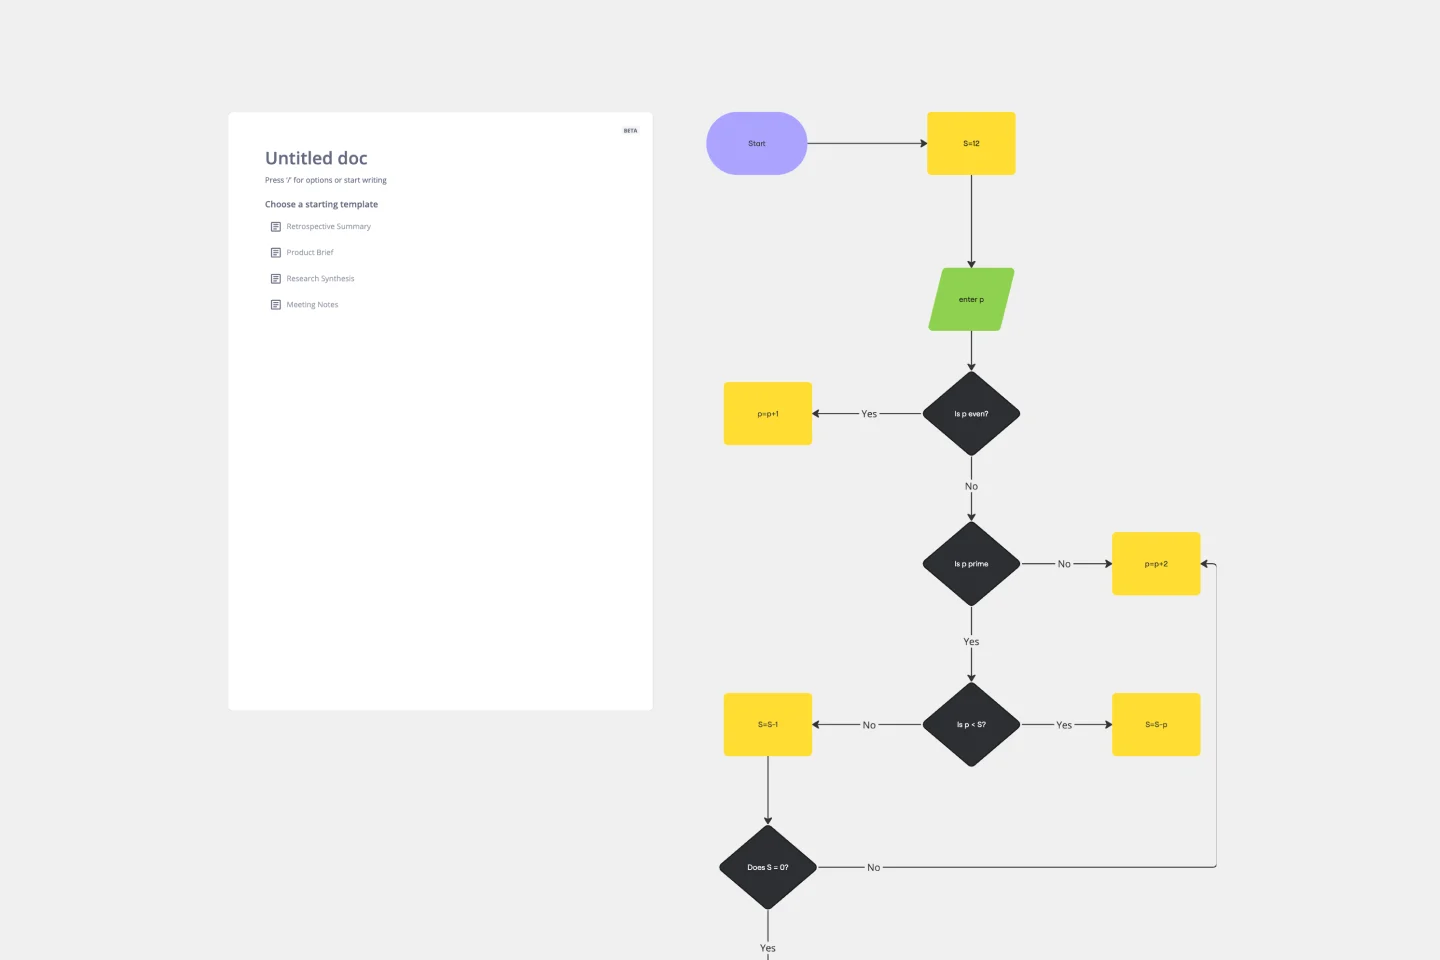
Algorithm Flowchart Template
Works best for:
Flowcharts
The Algorithm Flowchart Template is a useful tool for simplifying the process of creating and understanding complex algorithms. Its pre-structured format makes it easy to lay out each operation and decision point in a clear and easily understandable visual format. This is particularly helpful for explaining intricate processes to team members who may not be as technically proficient in the subject matter. With each step clearly defined within its designated shape, the flowchart promotes clarity and makes it easy to identify the logical flow at a glance. This clarity is the template's most significant advantage, reducing cognitive load and enabling a more inclusive and straightforward approach to discussing and refining algorithmic solutions.