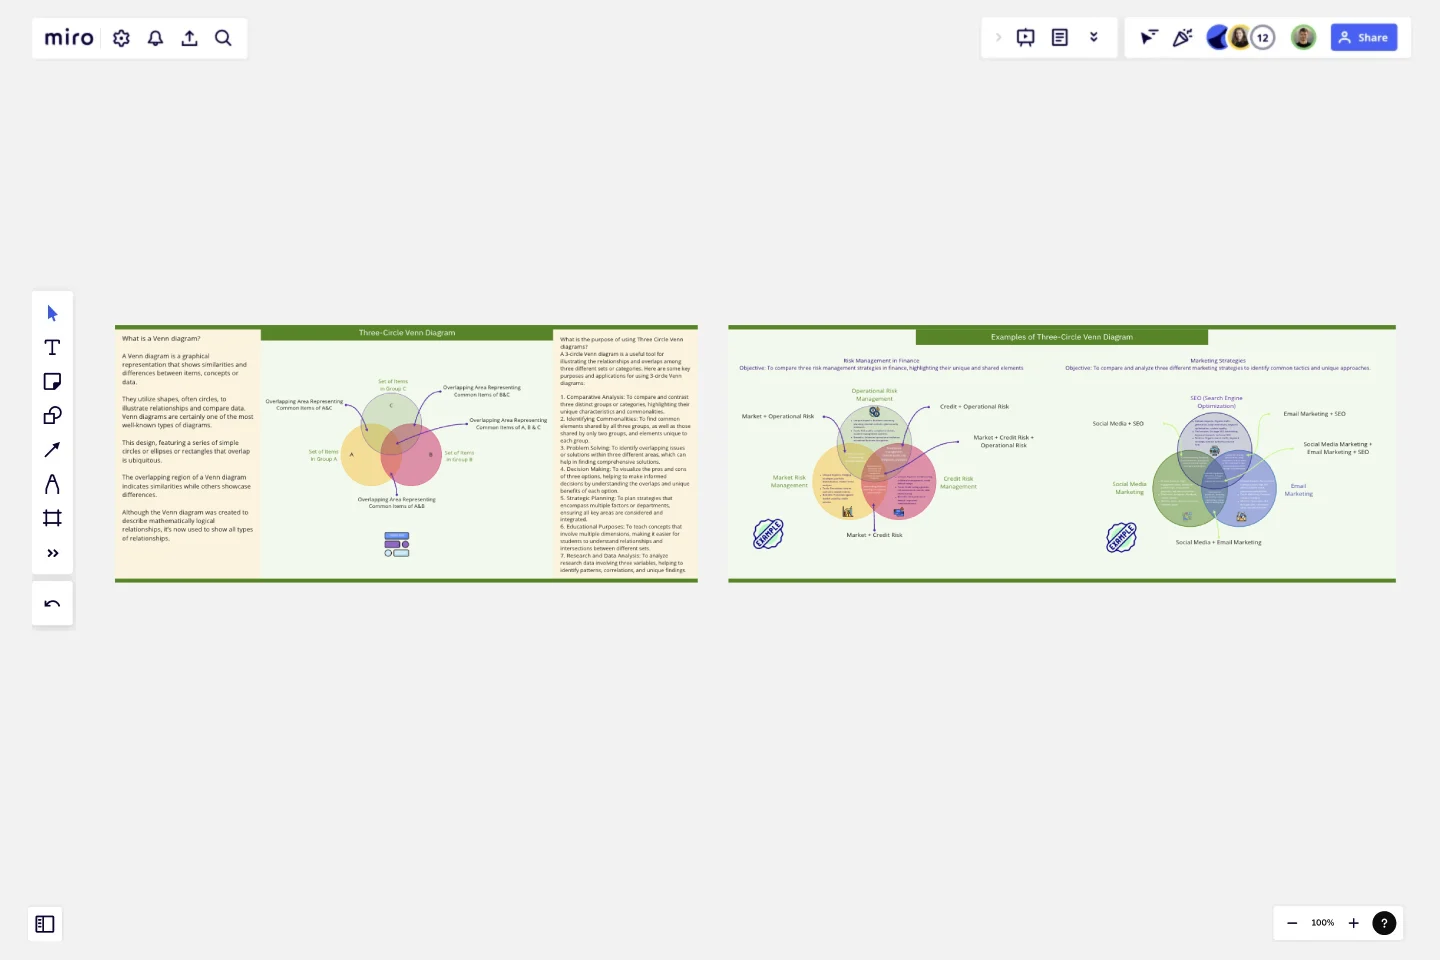
Three-Circle Venn Diagram
A Venn diagram is a graphical representation that shows similarities and differences between items, concepts or data.
Overview
A Venn diagram is a graphical representation that shows similarities and differences between items, concepts or data. They utilize shapes, often circles, to illustrate relationships and compare data.
Venn diagrams are certainly one of the most well-known types of diagrams. This design, featuring a series of simple circles or ellipses or rectangles that overlap is ubiquitous. The overlapping region of a Venn diagram indicates similarities while others showcase differences. Although the Venn diagram was created to describe mathematically logical relationships, it’s now used to show all types of relationships.
Purpose of using Three Circle Venn diagrams
A 3-circle Venn diagram is a useful tool for illustrating the relationships and overlaps among three different sets or categories. Here are some key purposes and applications for using 3-circle Venn diagrams:
1. Comparative Analysis: To compare and contrast three distinct groups or categories, highlighting their unique characteristics and commonalities.
2. Identifying Commonalities: To find common elements shared by all three groups, as well as those shared by only two groups, and elements unique to each group.
3. Problem Solving: To identify overlapping issues or solutions within three different areas, which can help in finding comprehensive solutions.
4. Decision Making: To visualize the pros and cons of three options, helping to make informed decisions by understanding the overlaps and unique benefits of each option.
5. Strategic Planning: To plan strategies that encompass multiple factors or departments, ensuring all key areas are considered and integrated.
6. Educational Purposes: To teach concepts that involve multiple dimensions, making it easier for students to understand relationships and intersections between different sets.
7. Research and Data Analysis: To analyze research data involving three variables, helping to identify patterns, correlations, and unique findings.
Along with step by step guide, two examples have also been provided to help you understand the concept of using 3-circle venn diagram. These can just be copy/paste to your own board.
Regards
Khawaja Rizwan
Get started with this template right now.
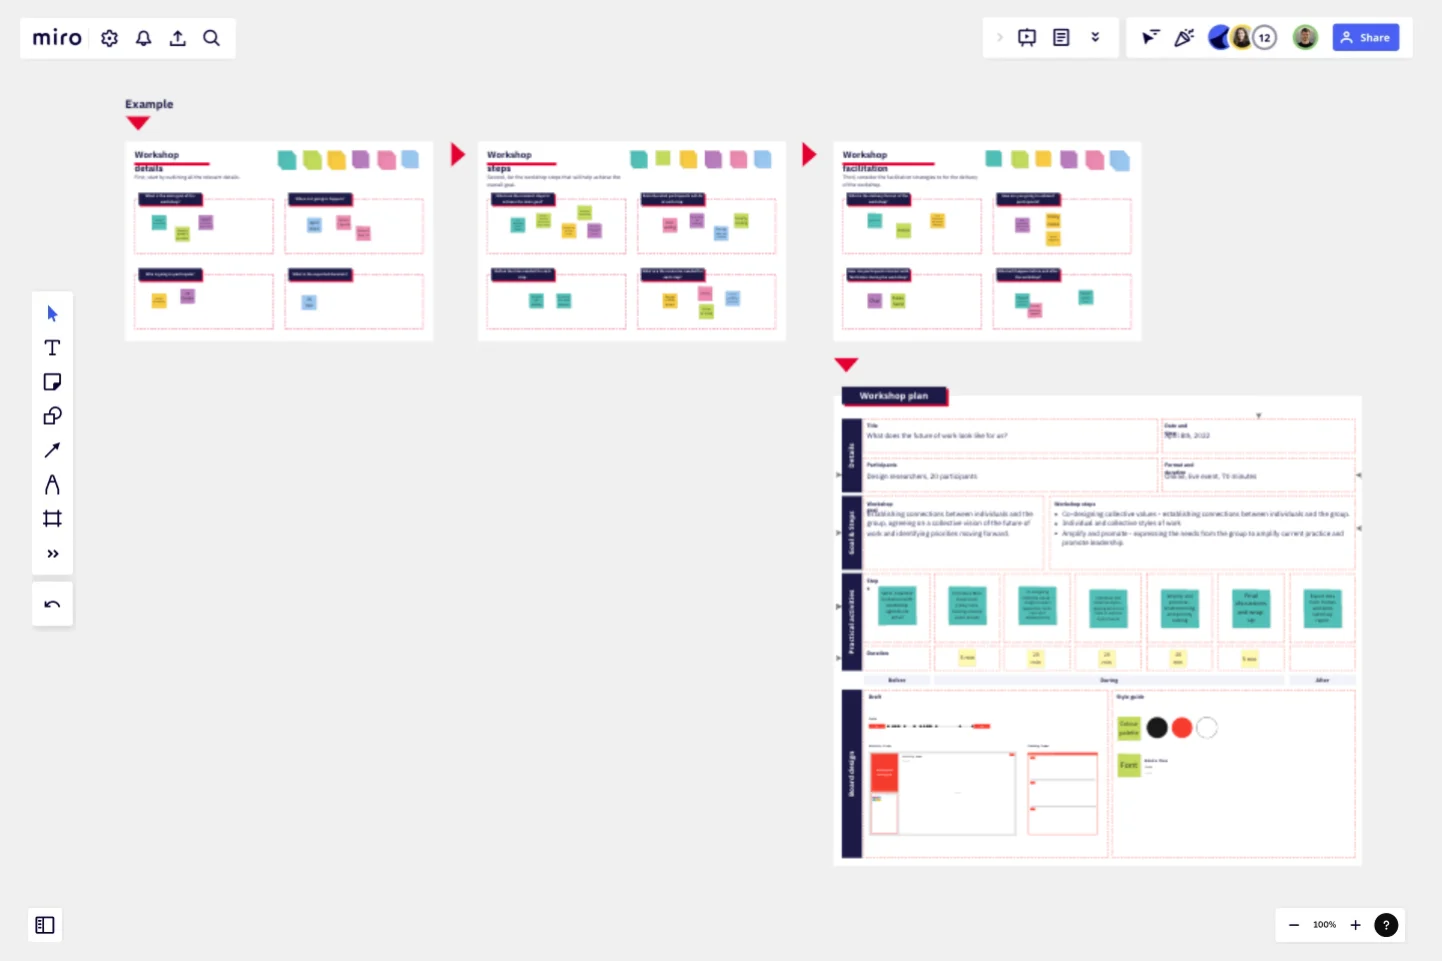
Workshop Planner
Works best for:
Planning, Strategy
Workshop Planner template helps you organize and plan effective workshops. It allows you to outline activities, set timelines, and allocate resources, ensuring your workshops run smoothly and achieve their objectives.

Four-Circle Venn Diagram
Works best for:
Venn Diagrams
The Four Circle Venn Diagram template offers a robust tool for detailed data comparison involving four sets. Use it to identify common and unique attributes across multiple categories. This template is perfect for complex analysis in research, strategic planning, and education. It helps visualize relationships clearly, making it easier to draw insights and communicate findings. Ideal for professionals and educators needing advanced comparative tools.

Venn Diagram for Learning and Education
Works best for:
Venn Diagram
Enhance learning and teaching with the Venn Diagram for Learning and Education template. Use it to compare concepts, illustrate relationships, and facilitate discussions. This template helps students and educators organize information visually, making complex ideas easier to understand and retain. It's an excellent tool for classrooms, study groups, and professional training sessions, promoting deeper understanding and active learning.
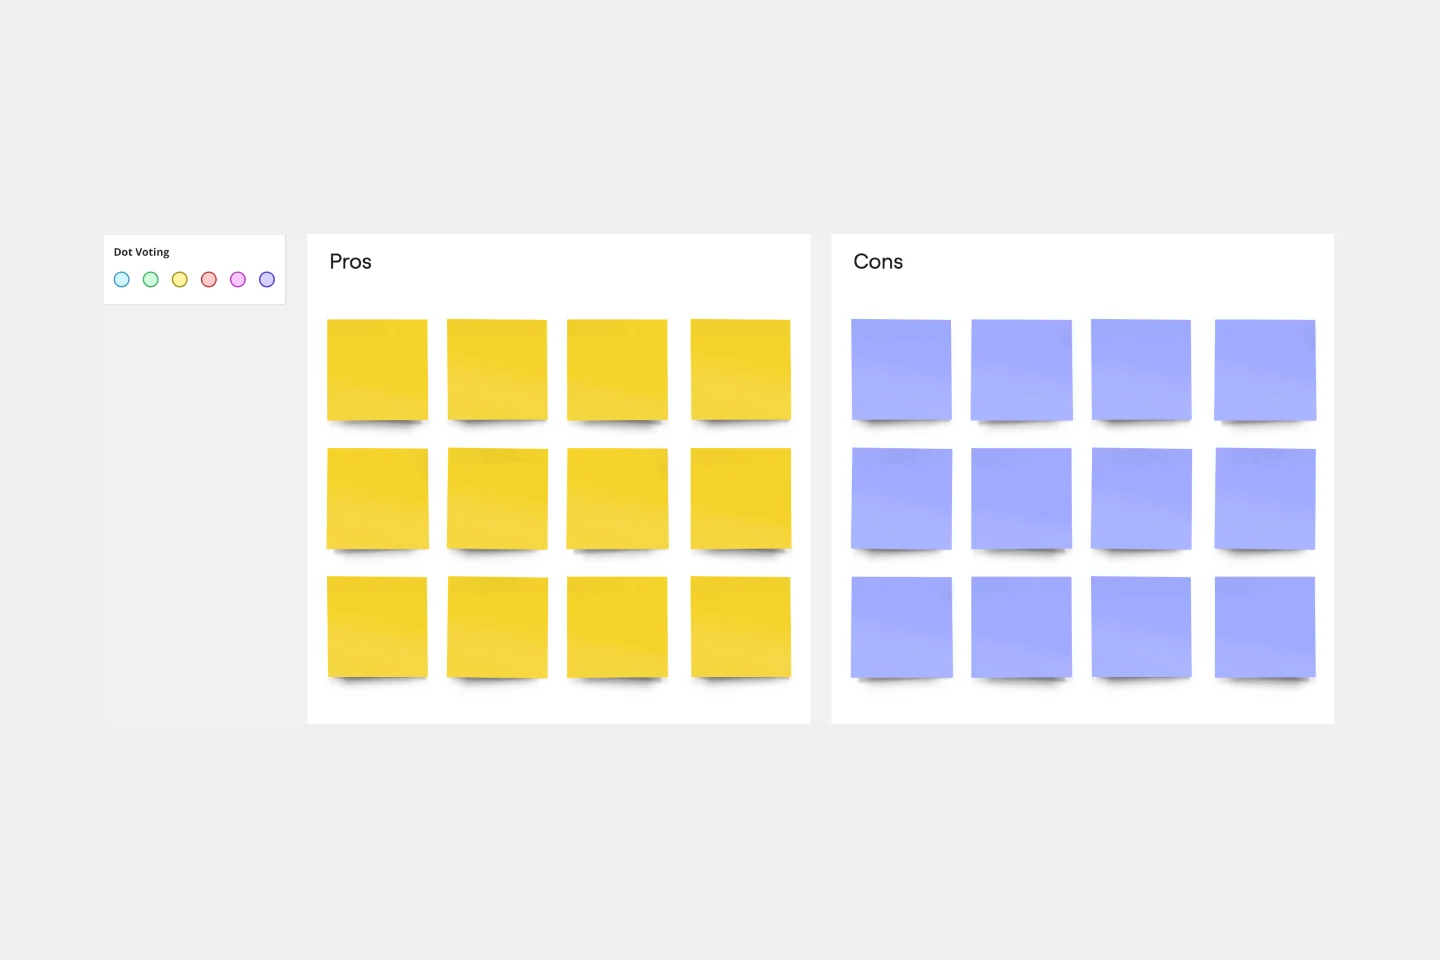
Pros and Cons List Template
Works best for:
Decision Making, Documentation, Strategic Planning
A pros and cons list is a simple but powerful decision-making tool used to help understand both sides of an argument. Pros are listed as arguments in favor of making a particular decision or action. Cons are listed arguments against it. By creating a list that details both sides of the argument, it becomes easier to visualize the potential impact of your decision. To make your pros and cons list even more objective, it can help to weight each pro and con against the others. You can then present your decision with confidence, making a strong argument for why it’s the right one.
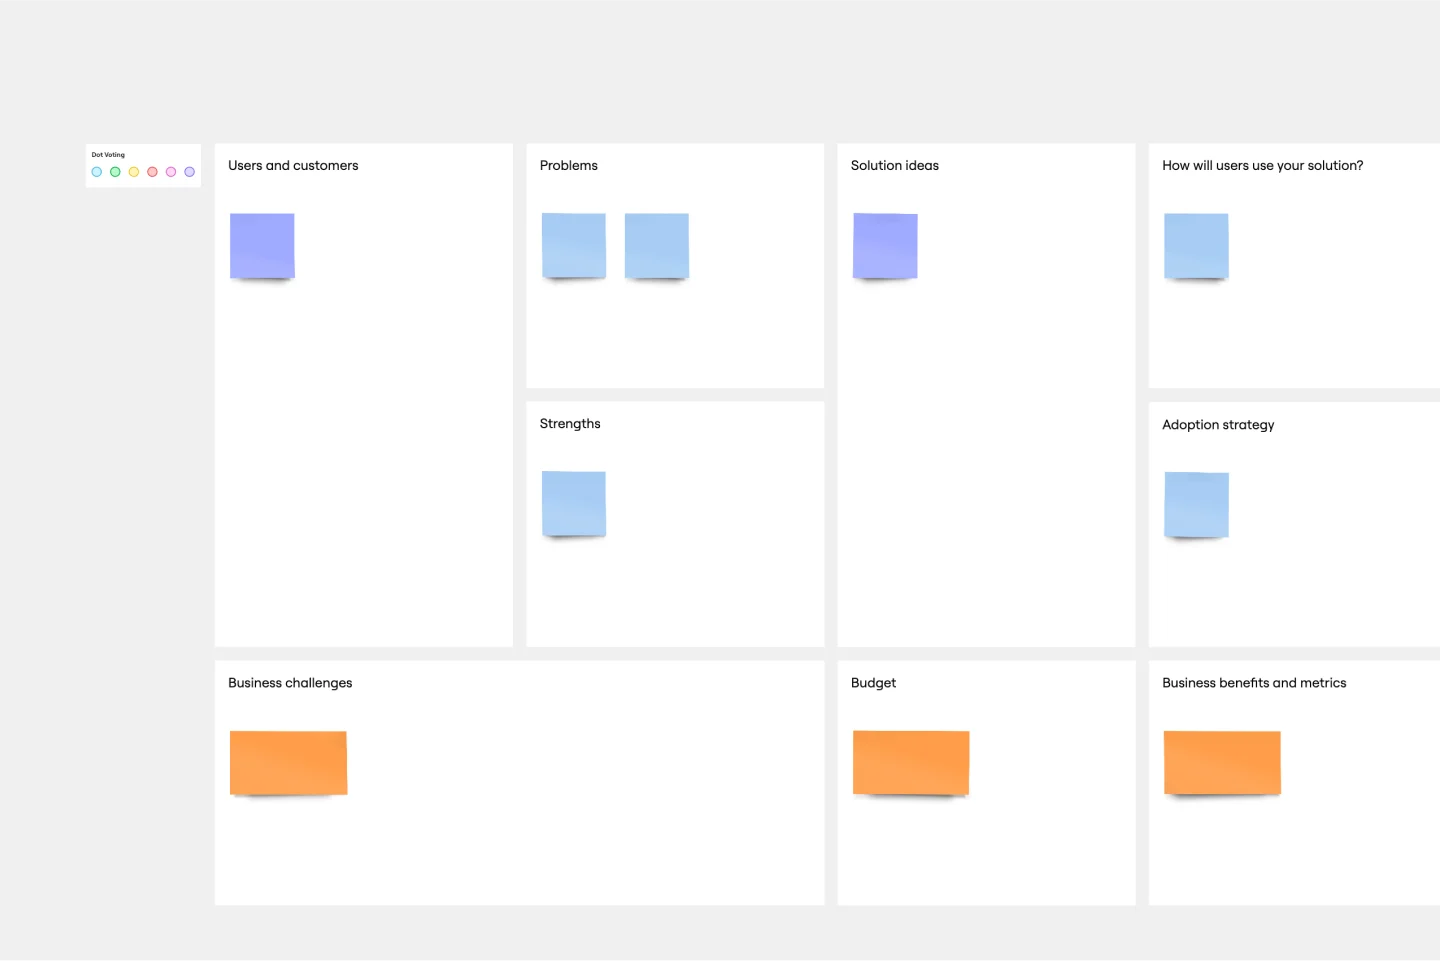
Opportunity Canvas Template
Works best for:
Leadership, Decision Making, Strategic Planning
Features and capabilities — they make or break a product, which is why companies spend so much time and effort focusing on them. Sound like you? Try it with an Opportunity Canvas. This streamlined one-pager gives you and your team the power to improve your product by exploring the use cases, potential setbacks, strategies, challenges, and metrics. An Opportunity Canvas is ideal if you’ve already built a product, because you don’t need to consider the operational or revenue model.
Fishbone RCA
Works best for:
Problem solving, Strategy
Use the Fishbone RCA template to conduct a thorough root cause analysis (RCA) for any problem. This template helps you break down complex issues into manageable categories, enabling you to identify the underlying causes. It's an effective tool for improving processes, solving problems, and preventing future issues.