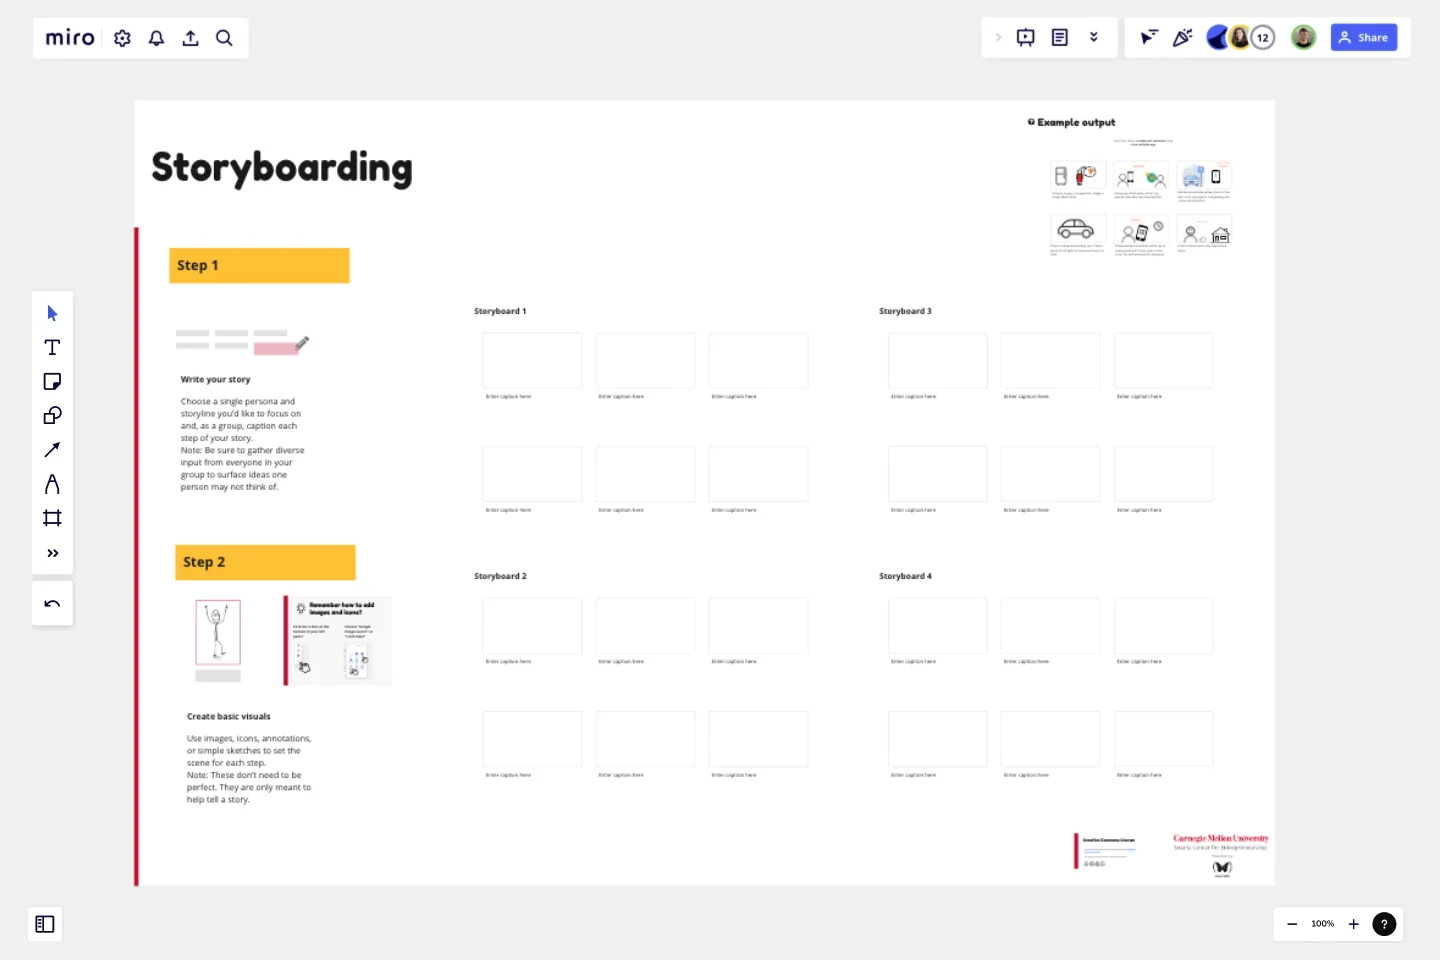
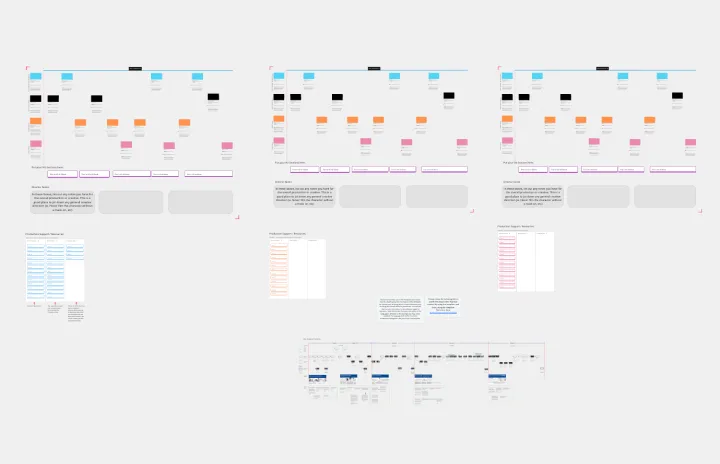
Storyboards
Storyboards are a great tool to map out either an experience that you want to create or an experience that you are imagining.
Storyboards are a great tool to map out either an experience that you want to create or an experience that you are imagining. This process allows you to put it back in front of users to validate whether the needs you are expressing in the storyboard actually exist. What are the key moments, milestones, or ideas in an experience that we can react to? Get creative and put it out there!
Start by writing your story. Choose a single persona and storyline you’d like to focus on and, as a group, caption each step of your story. Be sure to gather diverse input from everyone in your group to surface ideas one person may not think of.
Next, you’ll want to create some basic visuals. Use images, icons, annotations, or simple sketches to set the scene for each step. These don’t need to be perfect. It’s important to keep in mind that they are only meant to help tell a story.
Collaborate with your team to find the best story!
Get started with this template right now.
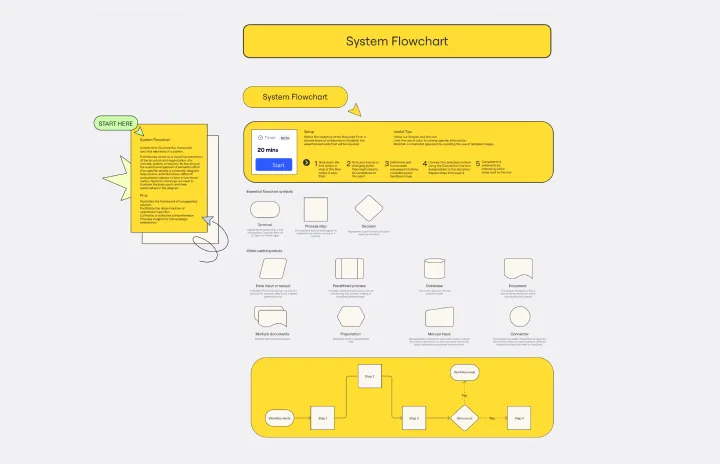
System Flowchart Template
The System Flowchart Template is a visual representation of the structure and organization of a concept, system, or solution. It helps teams understand how different components interact to form a functional system by focusing on the overall arrangement of elements rather than specific details. Symbolic drawings are used to illustrate the basic parts and their relationships in the diagram.
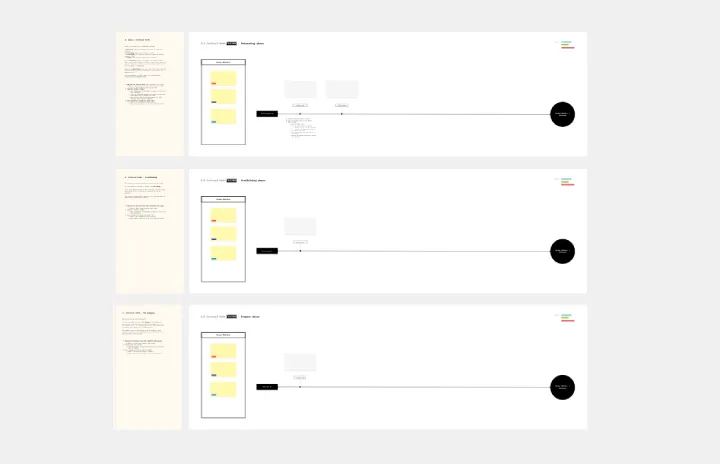
Practical Customer Journey Mapping
Works best for:
Customer Journey Map
Today, customers hold companies to high standards for product quality and user experience.
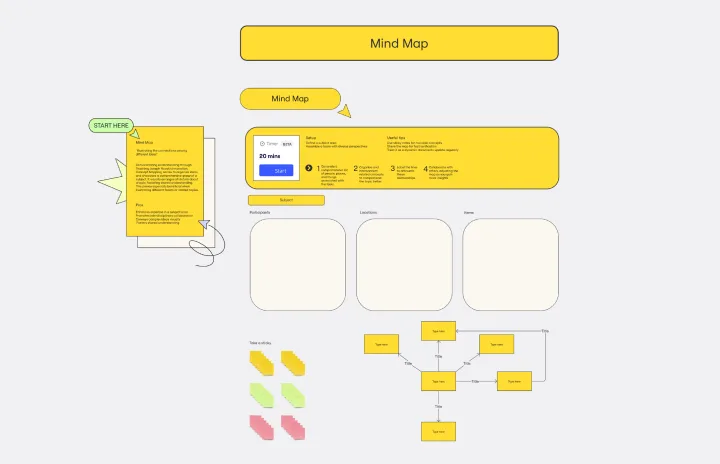
Mind Map Template
Works best for:
Design
Based on Joseph Novak's innovation, Concept Mapping, this template helps to organize ideas and demonstrate a comprehensive understanding of a subject. It visually arranges all the details about a topic, which fosters shared understanding. This technique is particularly useful when explaining different facets or related topics.
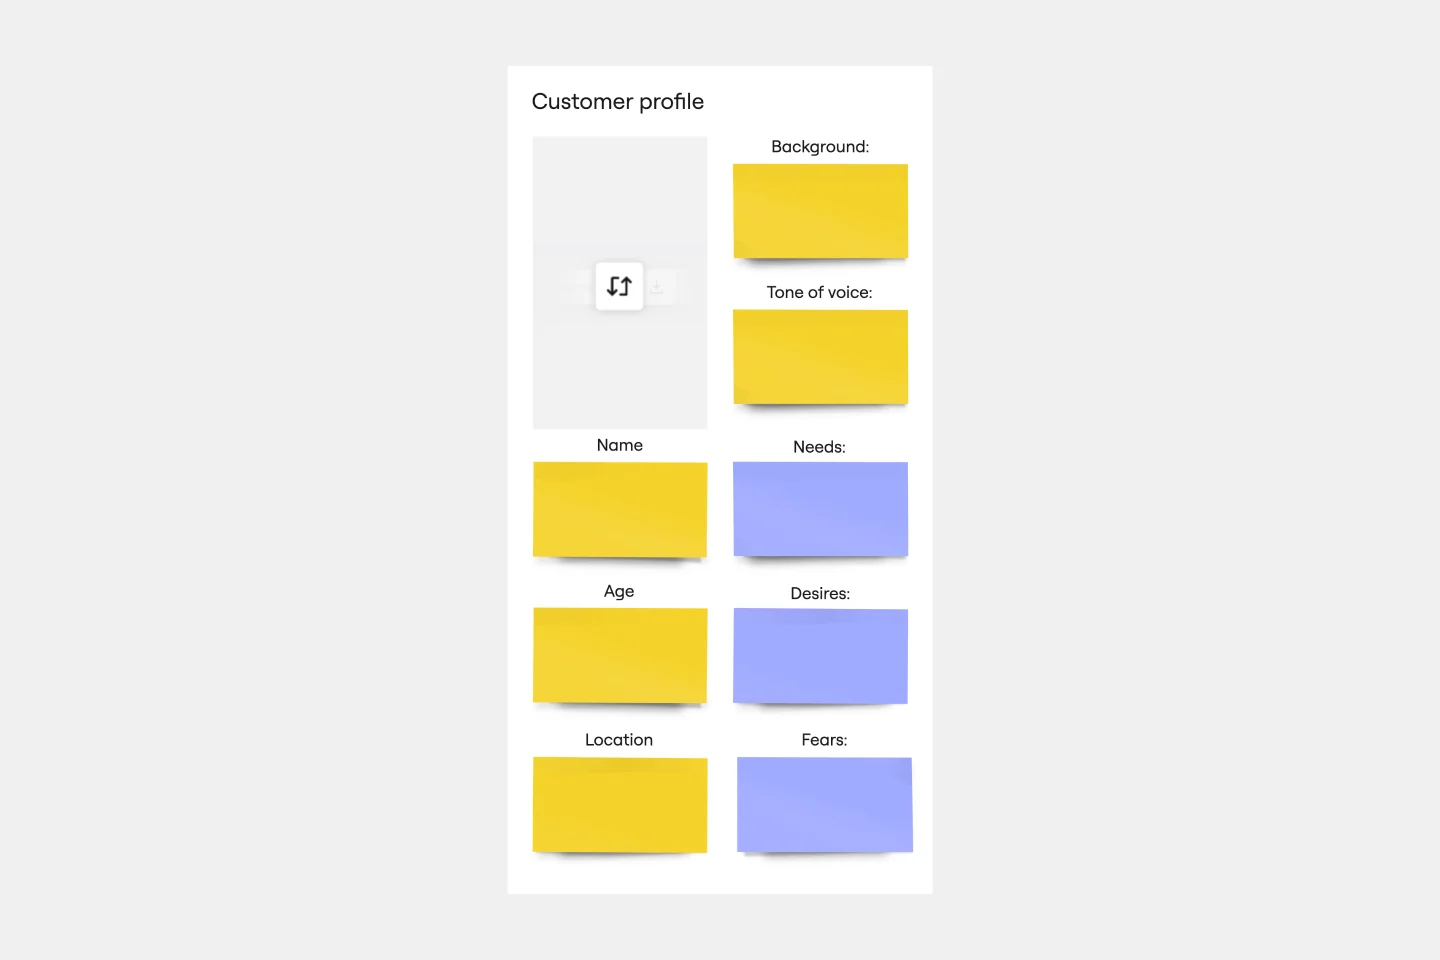
Proto Persona Template
Works best for:
UX, UX Research, Product Design
The Proto Persona Template is tailored to capture the essence of hypothetical user segments. It encapsulates key attributes such as user needs, behaviors, and potential pain points. One of its standout benefits is its ability to foster empathy. By visualizing and understanding these preliminary user profiles, design and strategy teams can tap into a deeper connection with their target audience, ensuring that solutions resonate authentically and address genuine needs.
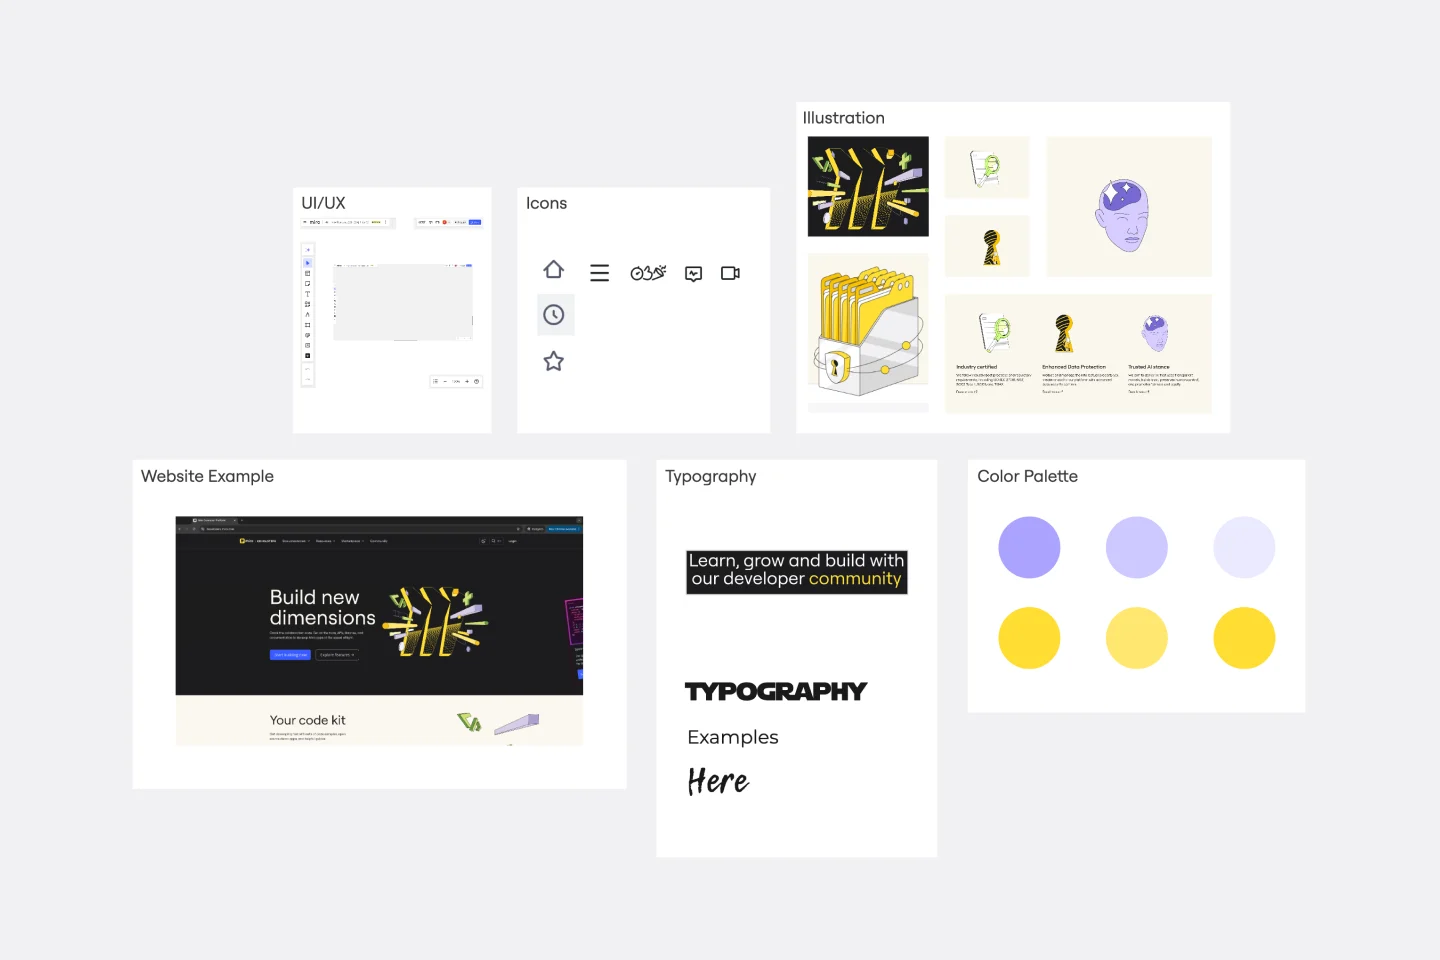
Mood Board Template
Works best for:
Design, Brainstorming, Ideation
When you’re kicking off a creative project, it’s sometimes important to communicate the mood you’re trying to evoke — but it’s so hard to do it with words. So create a mood board and use images, color palettes, textures, and typography. Mood boards are also perfect for gathering inspiration and sketching out and pitching ideas, and they’re not just for designers — your content writers, sales teams, and product teams can use them too, and this template makes it easy for all of you to get started.
Filmmakers Storyboard
Works best for:
Storyboard, Design, Planning
Bring your film projects to life with the Filmmakers Storyboard template. Designed for directors, producers, and cinematographers, this template helps you plan every aspect of your film, from scene composition to shot sequences. It includes detailed sections for visual elements, camera angles, and dialogue, ensuring a smooth production process. Use this template to create a clear visual guide that communicates your vision and enhances collaboration among your film crew.