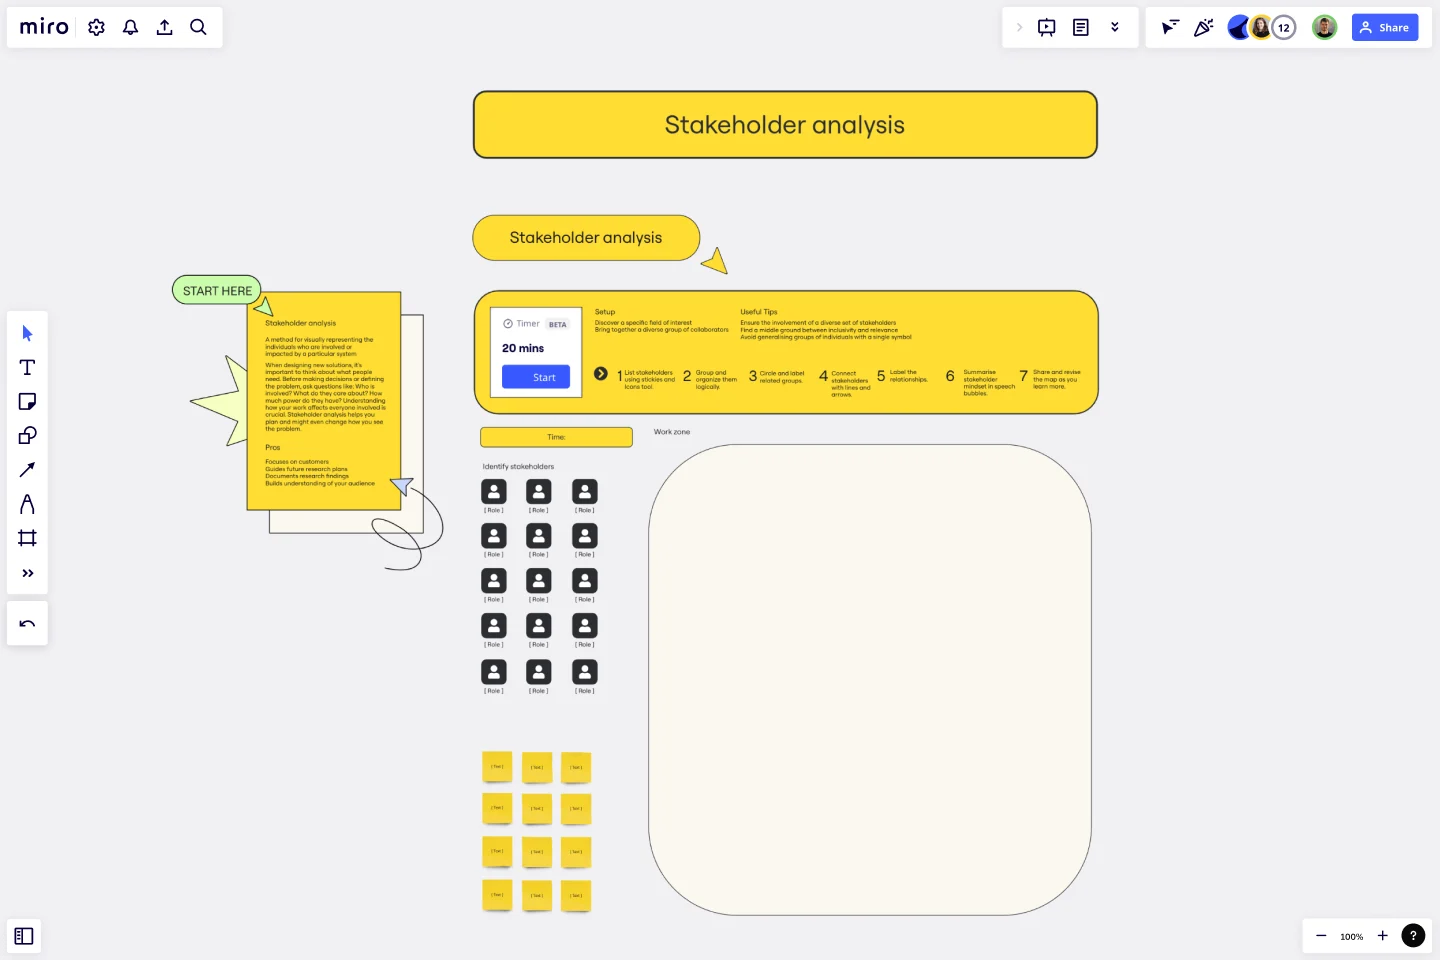
Stakeholder Analysis Template
When designing new solutions, thinking about what people need is important. Before deciding or defining the problem, ask questions like: Who is involved? What do they care about? How much power do they have? Understanding how your work affects everyone involved is crucial. Stakeholder analysis helps you plan and might change how you see the problem.
About the Stakeholder Analysis Template
When designing new solutions, it is essential to take a detailed and comprehensive approach that considers the needs and requirements of all stakeholders involved. Before making any decisions or defining the problem, it is crucial to conduct a thorough analysis that considers various factors, such as the identity of the stakeholders, their concerns and priorities, and the level of influence they wield.
Understanding how your work affects everyone involved is vital to the success of your project. By conducting a stakeholder analysis, you can better understand the various perspectives and interests and use this information to plan and strategize more effectively.
Stakeholder analysis can be a powerful tool that helps you plan and leads to a paradigm shift in your approach to the problem. By taking the time to understand the needs and requirements of all stakeholders involved, you can create solutions that are more effective, efficient, and sustainable in the long run.
Benefits of using the template
Focus on customers.
Guide future research plans.
Document research findings.
Build an understanding of your audience.
How to use the template in Miro
List stakeholders using stickies and Icons tool.
Group and organize them logically.
Circle and label related groups.
Connect stakeholders with lines and arrows.
Label the relationships.
Summarise stakeholder mindset in speech bubbles.
Share and revise the map as you learn more.
Setup
Discover a specific field of interest.
Bring together a diverse group of collaborators.
Useful tips
Ensure the involvement of a diverse set of stakeholders.
Find a middle ground between inclusivity and relevance.
Avoid generalizing groups of individuals with a single symbol.
Get started with this template right now.
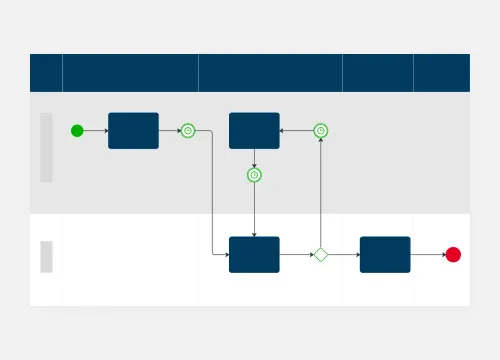
BPM
Works best for:
Diagramming
The BPM (Business Process Management) template is a visual tool for modeling, analyzing, and optimizing business processes. It provides a structured framework for documenting process flows, identifying bottlenecks, and improving efficiency. This template enables organizations to streamline operations, enhance productivity, and drive business performance. By promoting process transparency and agility, the BPM template empowers teams to achieve operational excellence and deliver value to stakeholders.
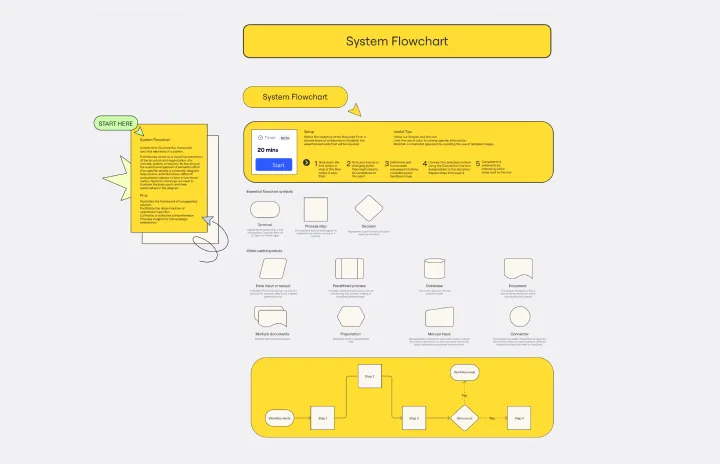
System Flowchart Template
The System Flowchart Template is a visual representation of the structure and organization of a concept, system, or solution. It helps teams understand how different components interact to form a functional system by focusing on the overall arrangement of elements rather than specific details. Symbolic drawings are used to illustrate the basic parts and their relationships in the diagram.
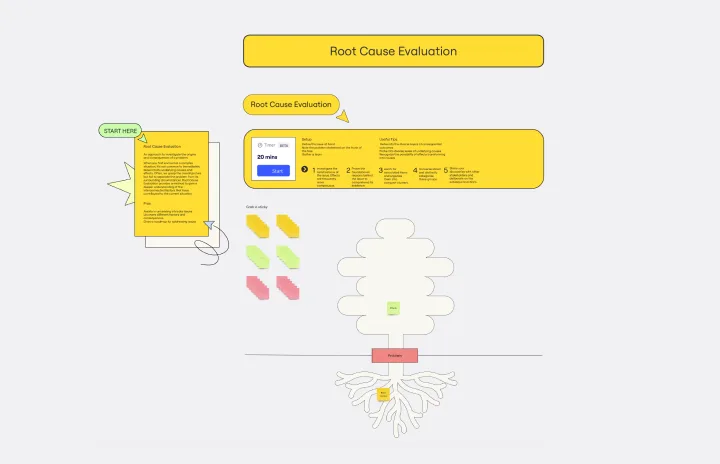
Root Cause Evaluation Template
When you first encounter a complex situation, it's not common to immediately delve into its underlying causes and effects. Often, we grasp the overall picture but fail to separate the problem from its surrounding circumstances. Root Cause Evaluation provides a method to better understand the interconnected factors that have contributed to the current situation.
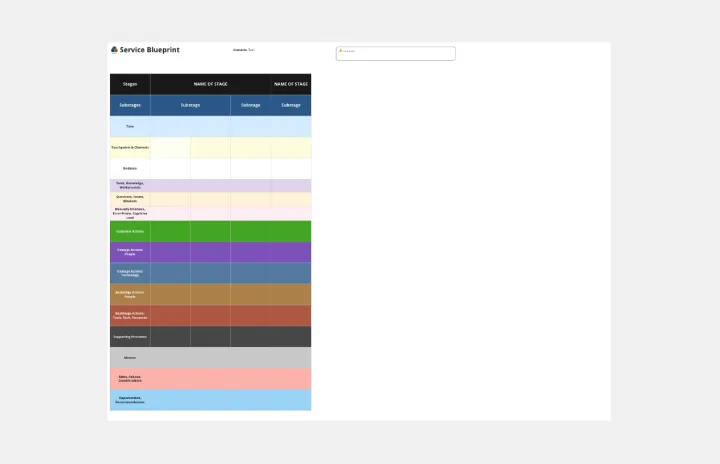
Expanded Service Blueprint
Works best for:
Research & Design
The Expanded Service Blueprint provides a detailed view of your service processes and interactions. This template is ideal for comprehensive service analysis and improvement. Use it to align teams, visualize the customer journey, and identify opportunities for optimization. It's perfect for enhancing service delivery, fostering collaboration, and ensuring a seamless and efficient service experience for your customers.
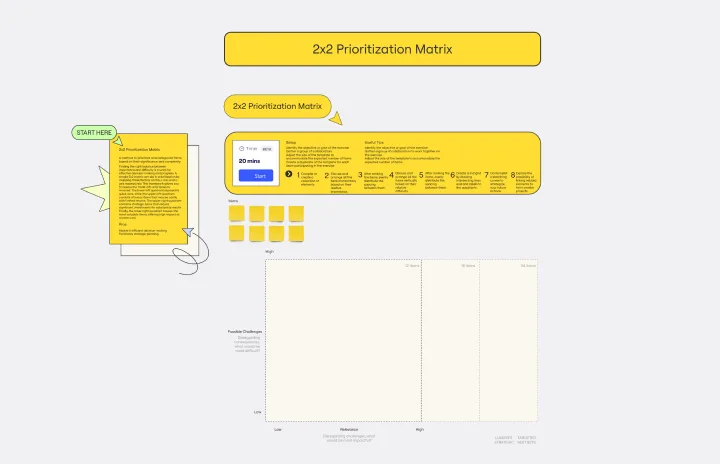
2x2 Prio Matrix Template
Works best for:
Design
Understanding the balance between importance and difficulty is crucial for effective decision-making and progress. To aid in prioritization, a simple 2x2 matrix can map these factors on the x-axis and y-axis, respectively. This framework allows you to assess the trade-offs and tensions involved. The lower left quadrant represents quick wins, while the upper left quadrant consists of luxury items that may be costly with limited returns. The upper right quadrant contains strategic items that require significant investments for substantial results. Finally, the lower right quadrant houses the most valuable items, offering high impact at a lower cost.
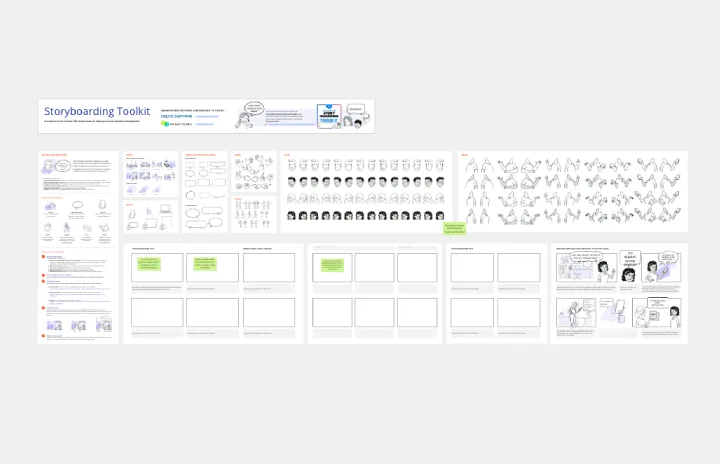
Storyboarding Toolkit
Works best for:
Storyboard, Design, Planning
Streamline your storytelling process with the Storyboarding Toolkit. This comprehensive template provides all the tools you need to create detailed storyboards, including scene planning, character development, and timeline management. It's perfect for filmmakers, designers, and marketing teams looking to create cohesive and engaging narratives. Use this toolkit to organize your ideas, ensure consistency, and bring your stories to life with clarity and precision.