Spider Chart Template
Spider Charts (or star plots) prioritize thoughts and ideas by importance.
About the Spider Chart Template
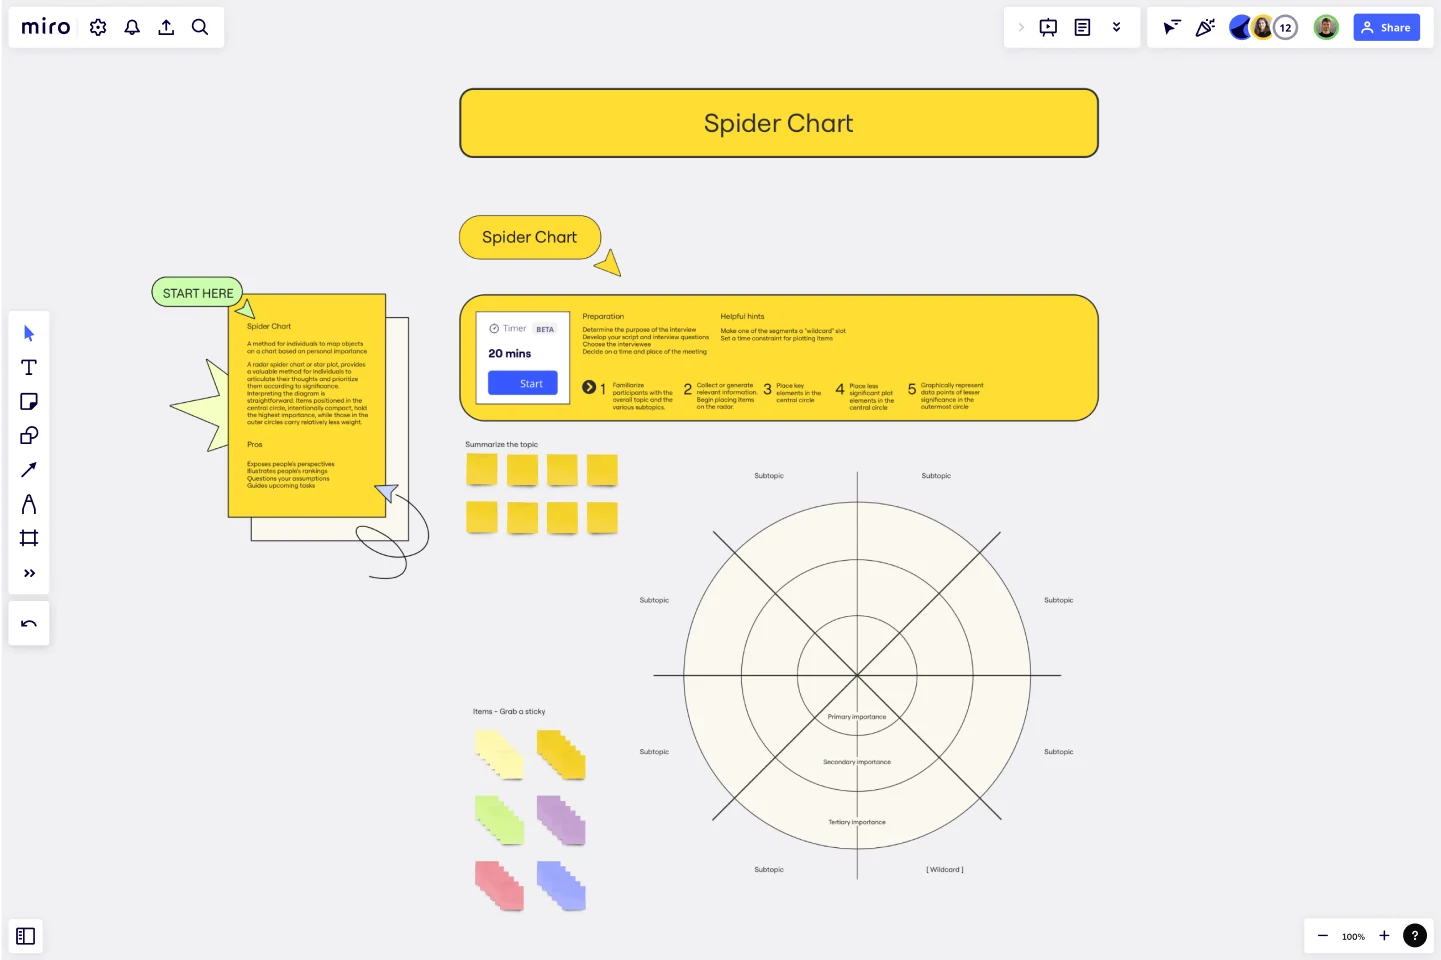
The Spider Charts, also known as star plots, present an effective way for people to express their thoughts and ideas while prioritizing them based on their relative importance.
This type of diagram is valuable when dealing with complex information, as it allows for a clear visualization of the most significant items positioned in the central circle. Meanwhile, less important items are placed in the outer circles, which are progressively farther from the center. By using a radar spider chart, people can better understand the relationships between different pieces of information and make more informed decisions.
Benefits of using the Spider Chart Template
Expose people's perspectives.
Illustrate people's rankings.
Question your assumptions.
Guide upcoming tasks.
How to use the template in Miro
Familiarize participants with the overall topic and the various subtopics.
Collect or generate relevant information. Begin placing items on the radar.
Place key elements in the central circle.
Place less significant plot elements in the central circle.
Graphically represent data points of lesser significance in the outermost circle.
Setup
Determine the purpose of the interview.
Develop your script and interview questions.
Choose the interviewee.
Decide on a time and place of the meeting.
Useful tips
Make one of the segments a "wildcard" slot.
Set a time constraint for plotting items.
Get started with this template right now.
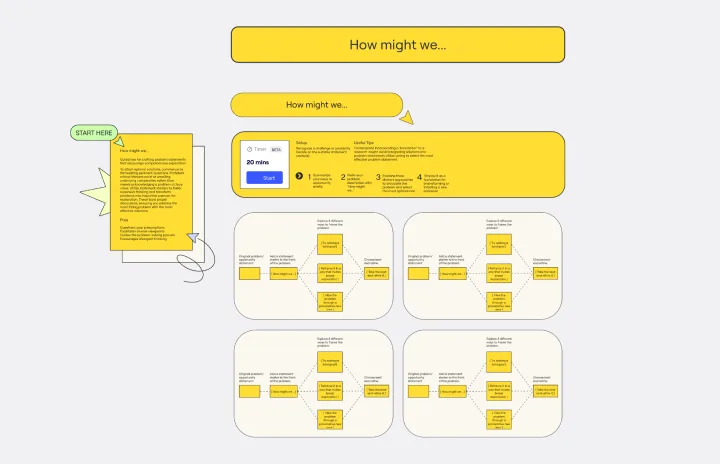
How Might We Template
It's crucial to ask the right questions to find the best solutions. Skilled critical thinkers can uncover the underlying complexities of a problem instead of just accepting it at face value. One way to encourage this type of thinking is by using statement starters, such as the How Might We Template. These tools can help you explore more open-ended problems and have more productive discussions, ultimately leading to the most effective solutions.
Empathy Mapping
Works best for:
Market Research, Research & Design
Atlassian Empathy Mapping is designed to help teams understand user perspectives. By mapping out user experiences, you can identify pain points and opportunities for improvement. This template is ideal for collaborative workshops and user research.

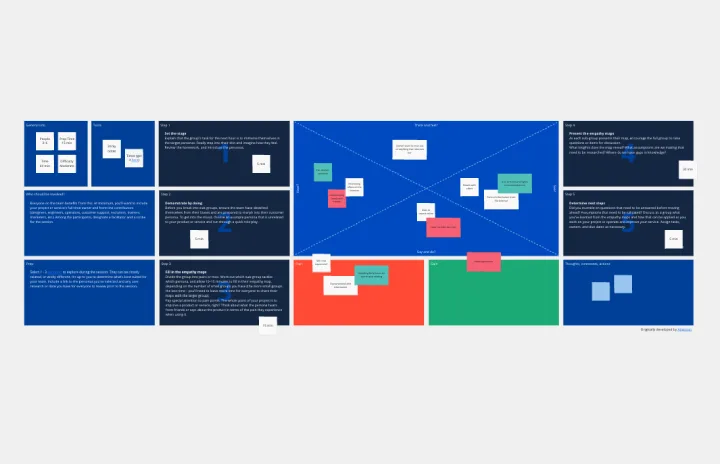
Service Blueprinting Workshop
Works best for:
Agile
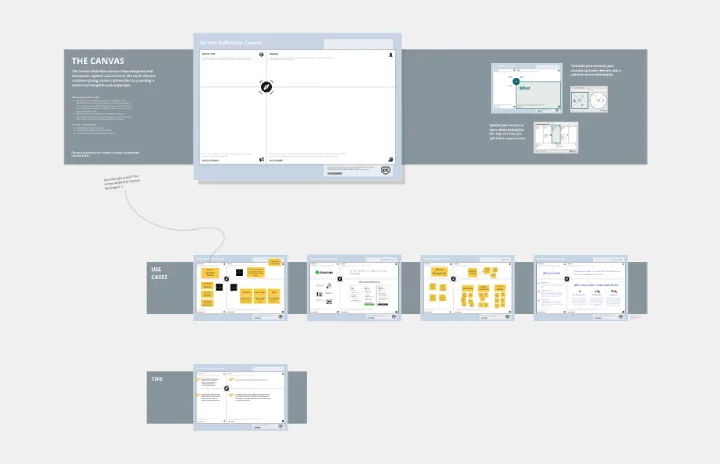
The Service Blueprinting Workshop template helps teams visualize and improve service processes. It includes ice breakers, context canvas, empathy maps, and action plans for service transitions. Use it to align teams, identify opportunities, and prototype service delivery from a macro to microscopic level, ensuring a comprehensive understanding of service orchestration and seamless collaboration. Ideal for remote and dispersed teams.
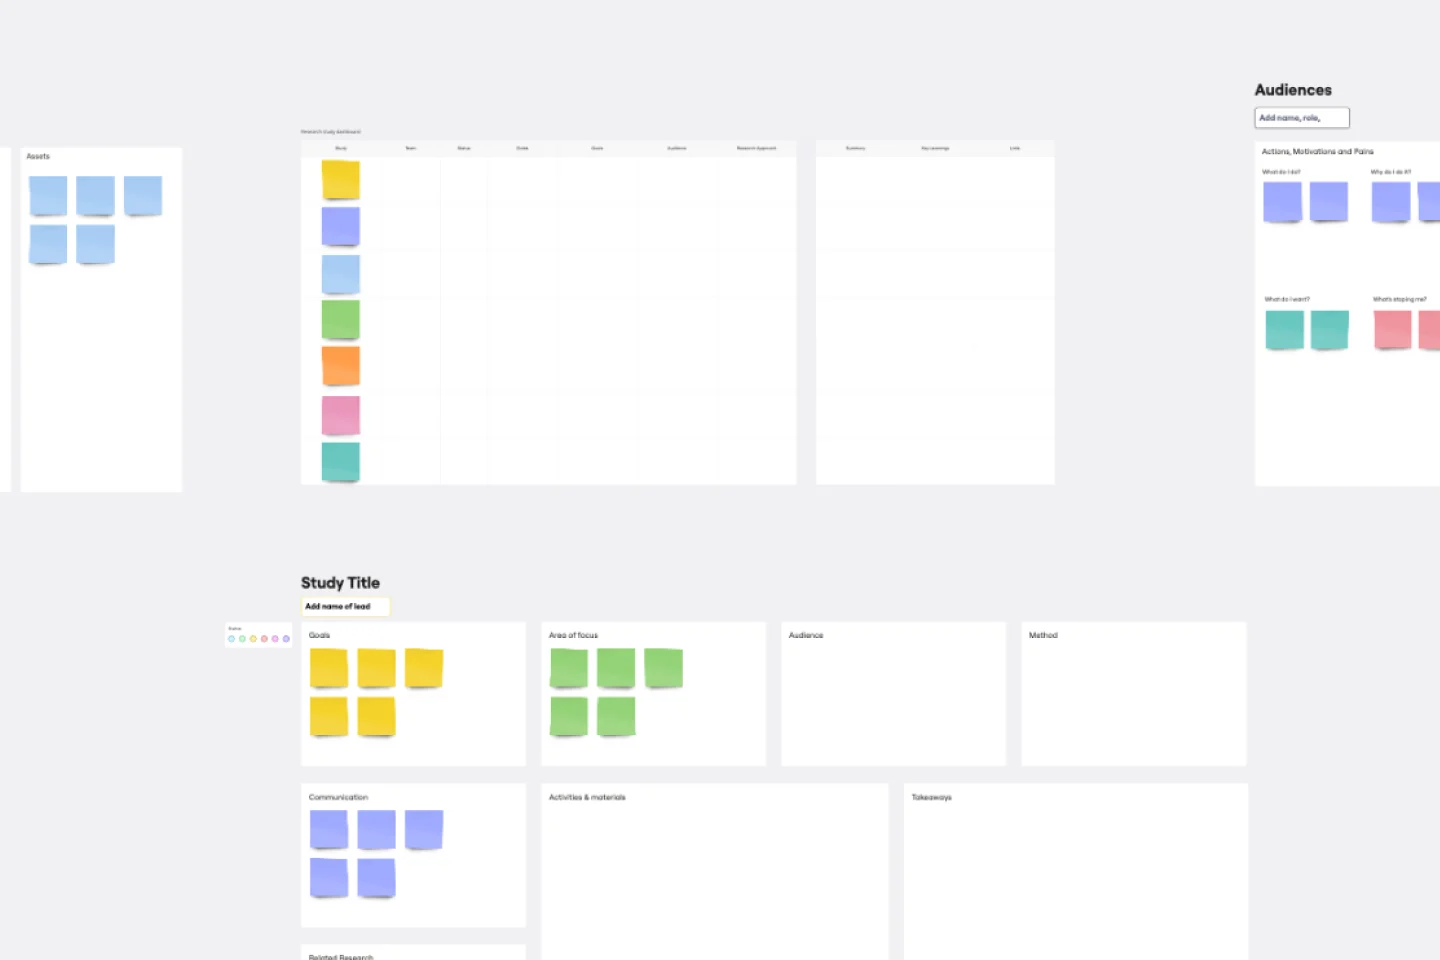
UX Research Repository Template
Works best for:
UX Design, User Experience
Empower your organization with customer knowledge and build a centralized research hub. From UX designers to product managers, enable everyone to get insights using the Research Repository Template.
Design Sprint Kit Template
Works best for:
Agile Methodology, UX Design, Sprint Planning
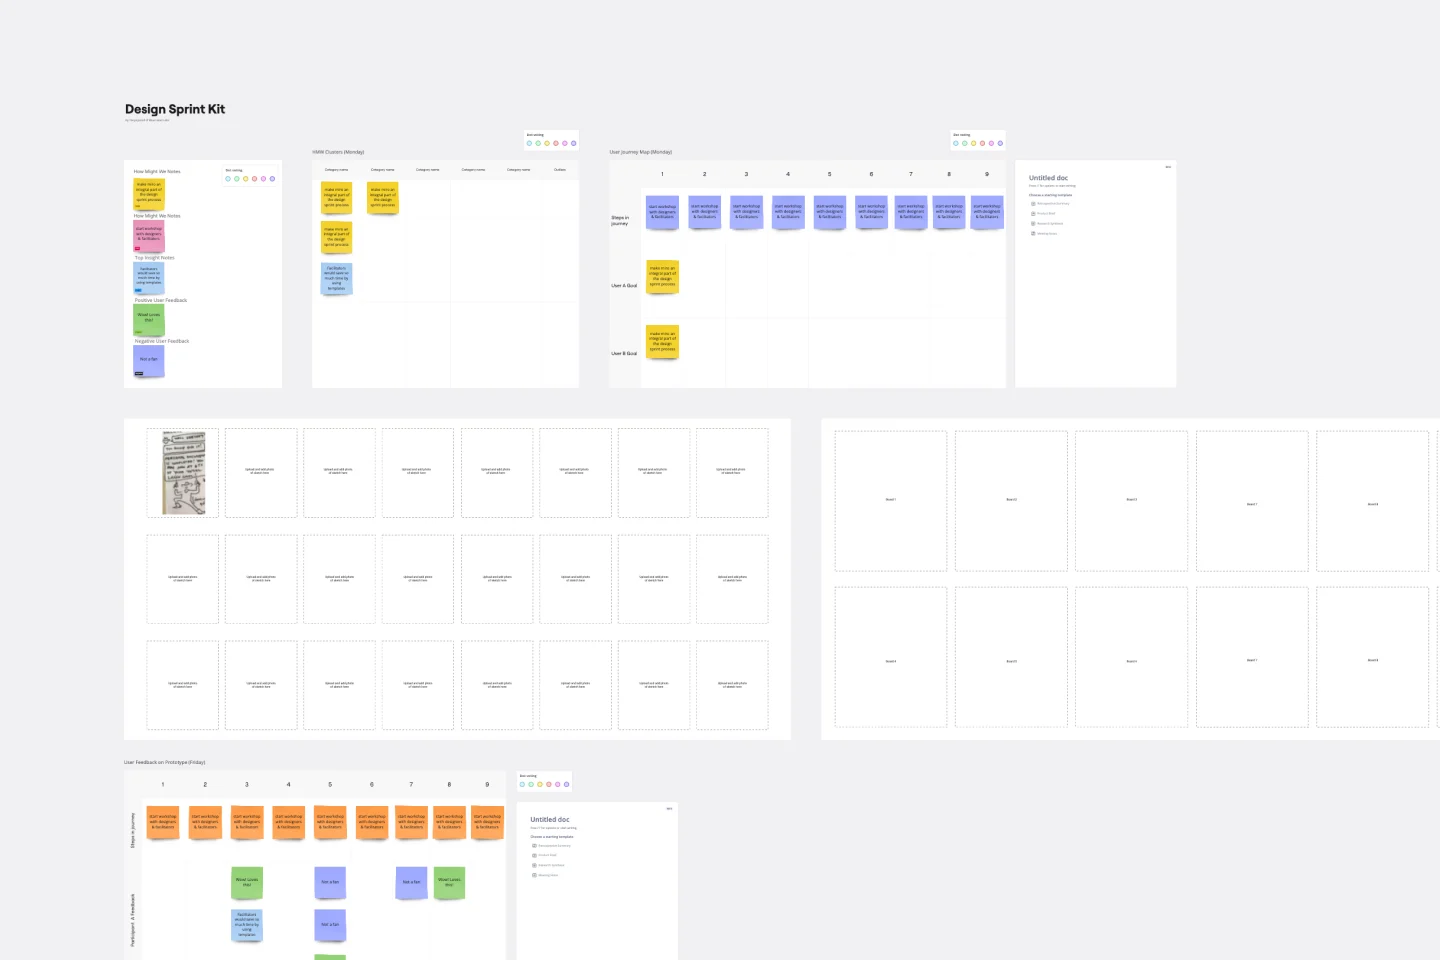
With the right focused and strategic approach, five days is all it takes to address your biggest product challenges. That’s the thinking behind Design Sprint methodology. Created by Tanya Junell of Blue Label Labs, this Design Sprint Kit provides a set of lightweight templates that support the Design Sprint’s collaborative activities and voting—and maintains the energy, team spirit, and momentum that was sparked in the session. Virtual sprint supplies and prepared whiteboards make this kit especially useful for remote Design Sprint Facilitators.
Service Definition Canvas
Works best for:
Research & Design
The Service Definition Canvas helps you define and visualize the core components of your service. This template is perfect for outlining service interactions, identifying improvement areas, and aligning teams. Use it to create a clear and comprehensive service blueprint that enhances customer experience and operational efficiency. It's ideal for strategic planning and ensuring a cohesive understanding of service delivery among stakeholders.