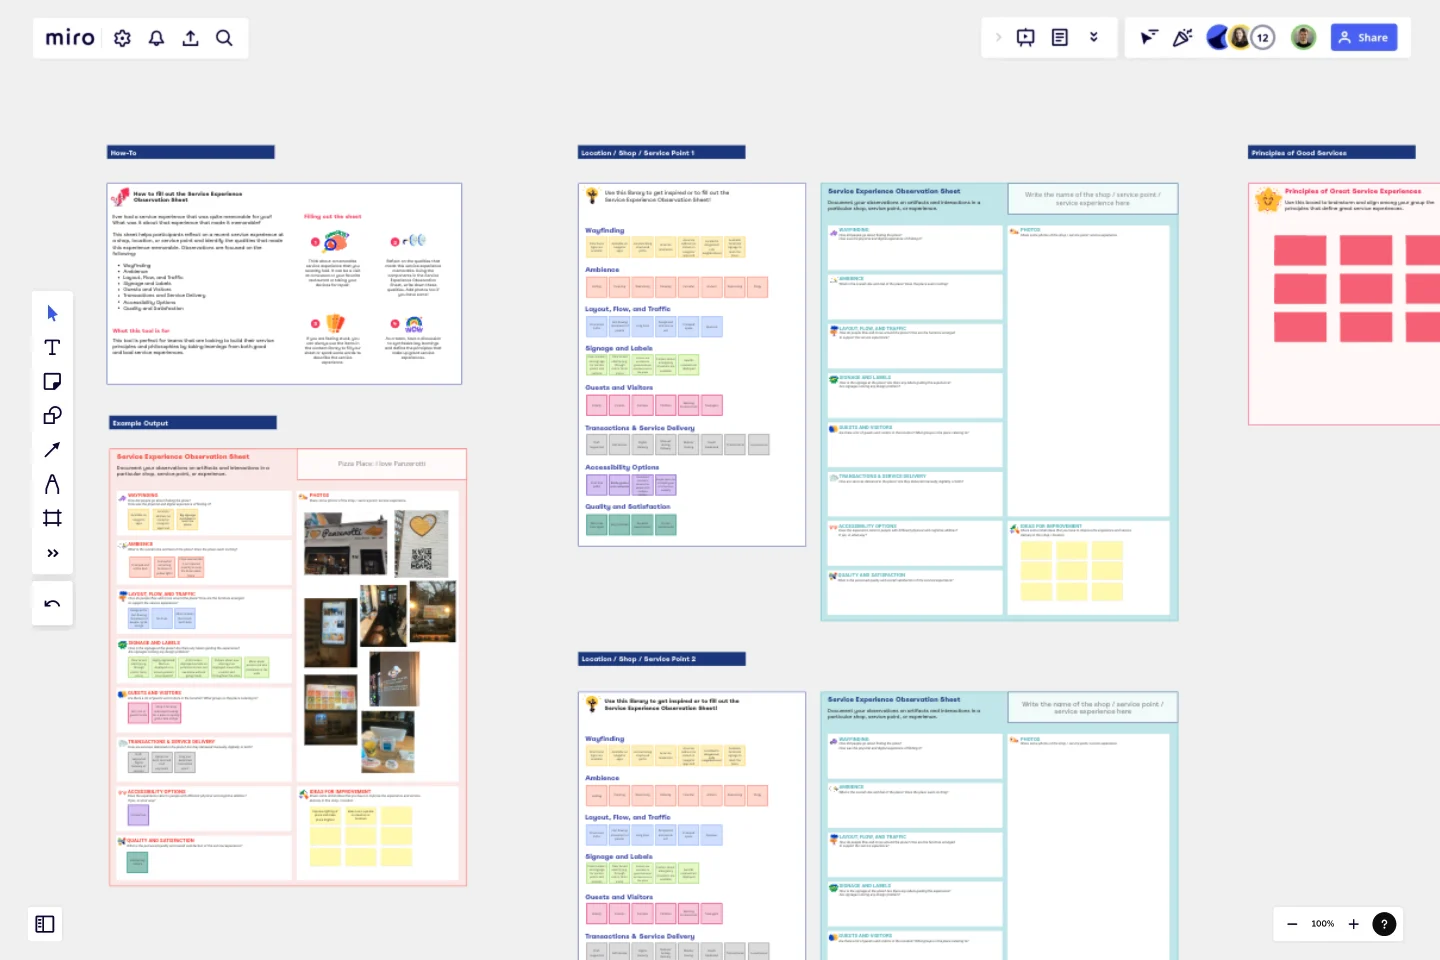
Service Experience Observation Sheet
Formulate your service essentials.
Ever had a service experience that was quite memorable for you? What was it about that experience that made it memorable?
This sheet helps participants reflect on a recent service experience at a shop, location, or service point and identify the qualities that made this experience memorable. Observations are focused on the following:
Wayfinding
Ambiance
Layout, Flow, and Traffic
Signage and Labels
Guests and Visitors
Transactions and Service Delivery
Accessibility Options
Quality and Satisfaction
This tool is perfect for teams that are looking to build their service principles and philosophies by taking learnings from both good and bad service experiences.
An example is also provided on the board to serve as a guide on how to fill out the sheet. You can also see a content library that contains example answers to the components in the sheet.
After participants have filled out their sheets, a group discussion is encouraged to synthesize key learnings and align on the principles that make up great service experiences.
Get started with this template right now.
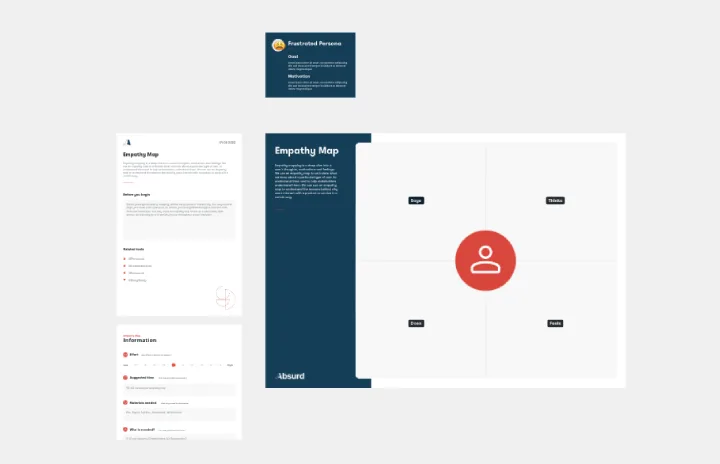
Empathy Map [Research]
Works best for:
Market Research, Research & Design
Empathy Map Research template helps you gather in-depth user insights. It’s designed for teams who want to understand user behaviors and needs better. Use this template to inform your design decisions and create user-centered products.
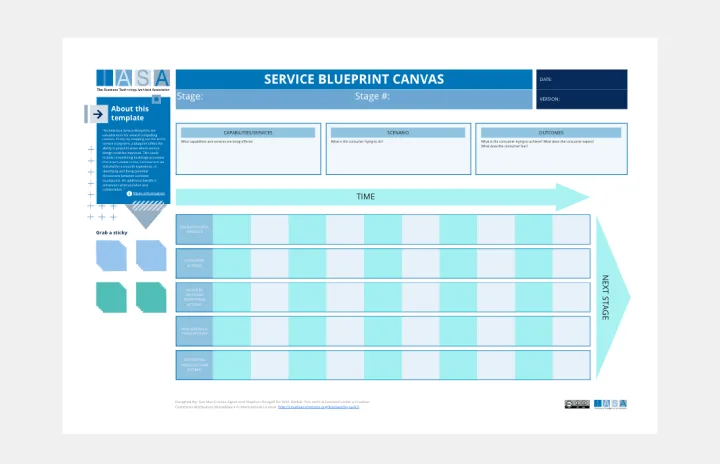
IASA - Service Blueprint Canvas
Works best for:
Research & Design
The IASA Service Blueprint Canvas helps visualize service interactions and processes in detail. This template is perfect for analyzing and improving service delivery. Use it to align teams, identify pain points, and enhance customer experiences. It's ideal for creating a shared understanding of service dynamics and fostering collaboration among stakeholders, ensuring a seamless and efficient service delivery process.
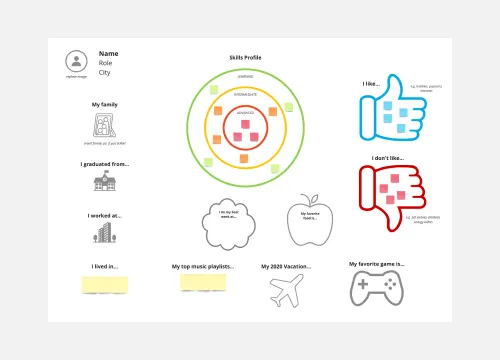
Team Norms + Personal Profiles
Works best for:
Agile
The Team Norms + Personal Profiles template fosters team alignment and cohesion by defining shared norms and understanding individual preferences. It provides a structured framework for collaboratively establishing team norms, values, and communication protocols. Additionally, it allows team members to create personal profiles to share their strengths, preferences, and working styles. By promoting transparency and mutual respect, this template empowers teams to build trust, leverage diversity, and enhance collaboration, driving collective success and performance improvement.
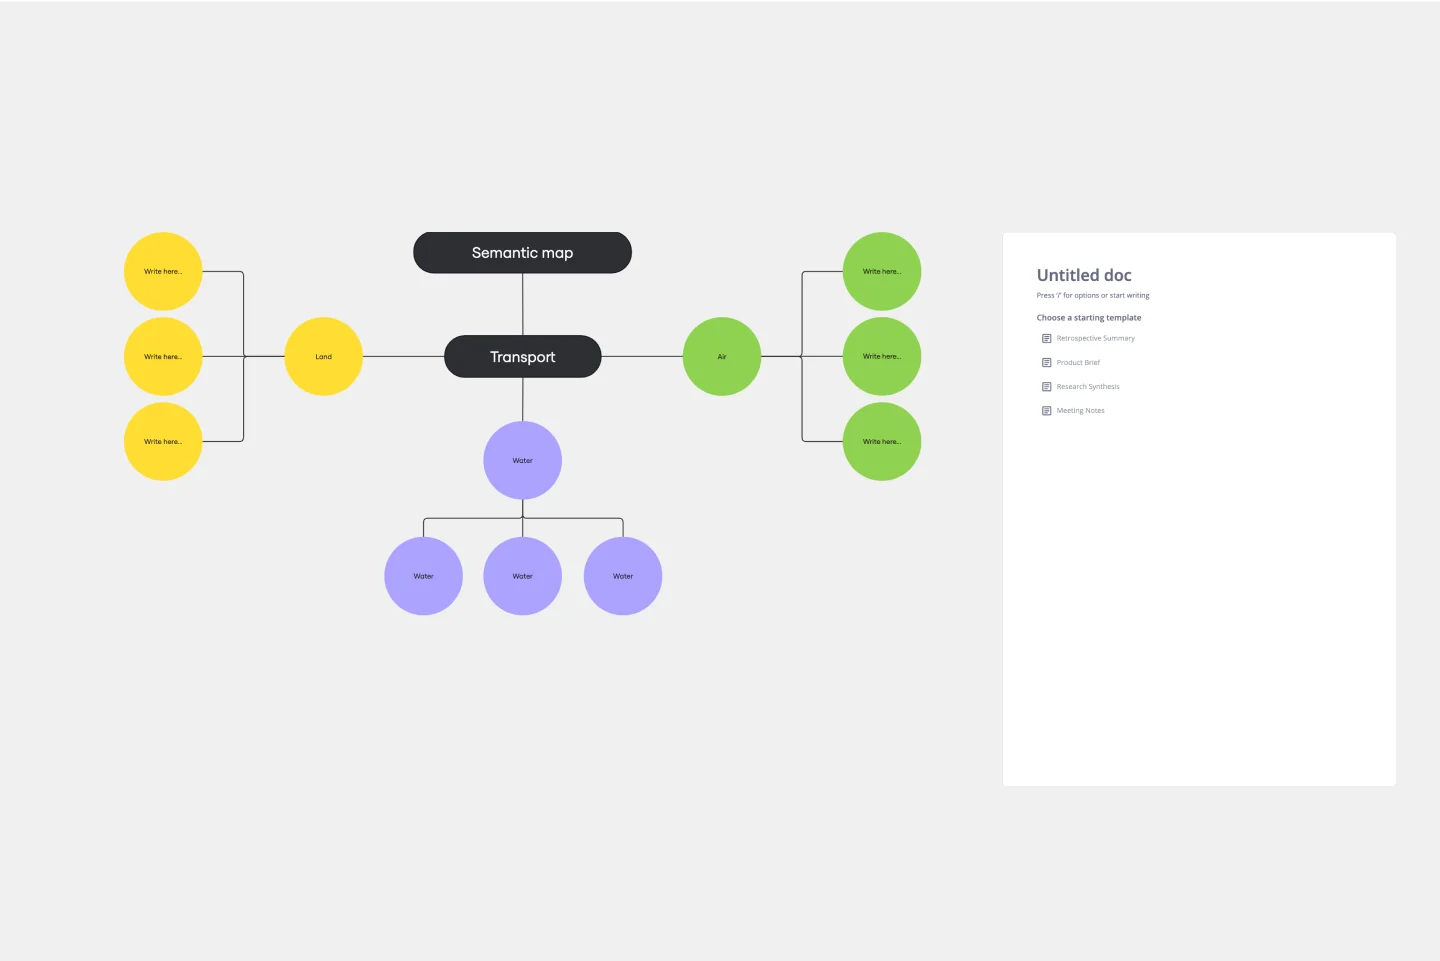
Semantic Map Template
Works best for:
Brainstorming
The Semantic Map Template is a helpful tool that helps teams efficiently process and structure complex information. Its intuitive design promotes shared understanding, allowing multiple users to contribute and refine ideas simultaneously. This collaborative approach streamlines brainstorming sessions and creates a synergistic environment where collective intelligence thrives. By visually mapping out concepts and their interconnections, the template ensures that every team member is on the same page, which improves group dynamics and leads to more cohesive and comprehensive outcomes. The Semantic Map Template is a valuable tool for team-based project management and learning, thanks to its ability to foster collaboration and enhance productivity.
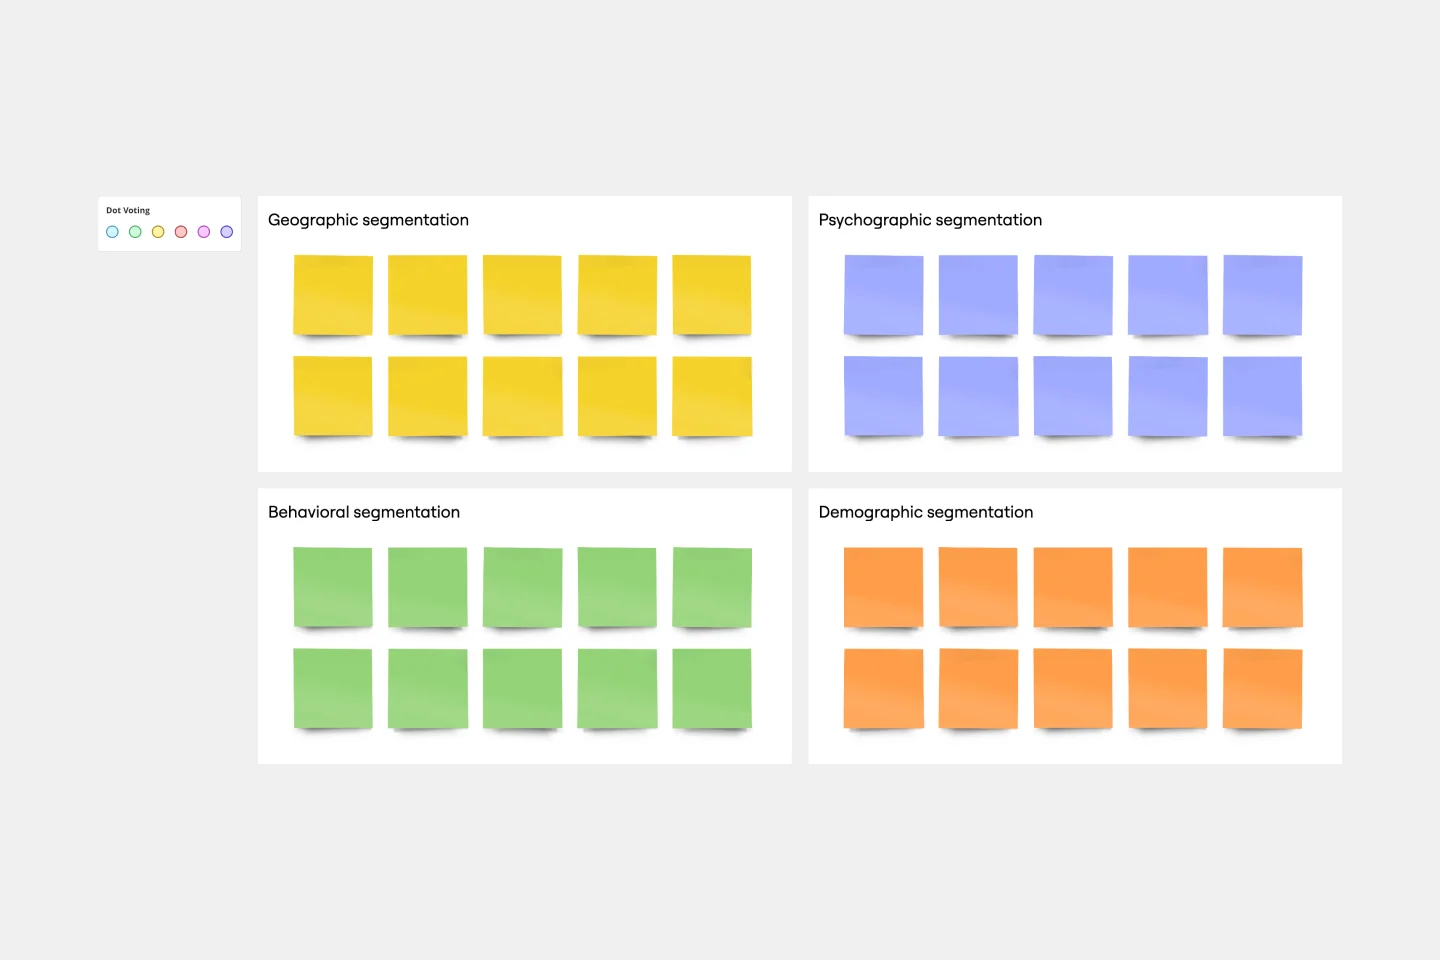
Market Segmentation Matrix Template
Works best for:
Marketing, Strategic Planning, Product Management
Successful, compelling marketing begins and ends with knowing your audience — who they are, where they are, and what they want and expect. A market segmentation matrix will help you understand them on a deeper level. This business tool divides your target market into subsets based on demographics, geography, needs, interests, psychographics, or behavioral characteristics. You can then use these insights and data to hit it out of the park, by building better product, sales, and marketing strategies. Our template lets you set up and populate a Market Segmentation Matrix with ease.
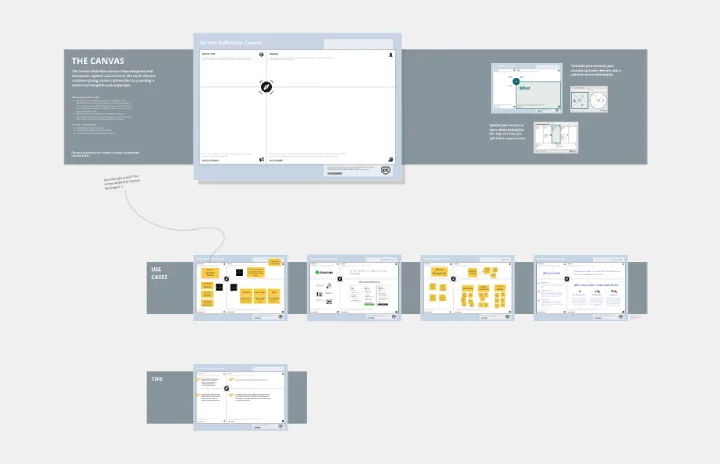
Service Definition Canvas
Works best for:
Research & Design
The Service Definition Canvas helps you define and visualize the core components of your service. This template is perfect for outlining service interactions, identifying improvement areas, and aligning teams. Use it to create a clear and comprehensive service blueprint that enhances customer experience and operational efficiency. It's ideal for strategic planning and ensuring a cohesive understanding of service delivery among stakeholders.