
Service Blueprint Workshop
Service blueprint is a visualisation of the whole service.
About Service Blueprint
Service blueprint is a visualisation of the whole service. In one comprehensive diagram, we present the customer's actions, their interactions with the service across all channels, internal interactions, and supporting actions.
It shows processes and interdependencies between all components involved in service delivery.
What is different about this template?
It is easy to scale - I noticed that there are already some templates for a service blueprint in the Miroverse. Don't get me wrong - they are all really cool. But I needed something that can be applied to a big, complicated process - thus it had to be easy to scale. I have used a table function in my template so that you can easily adjust the length of a process phase and height of a row if i.e. you want to add another streamline, like specific technology.
It is a workshop - I saw a lot of templates for the Service Blueprint itself but not a lot for the whole workshop that leads to this Service Blueprint creation. This is my proposition on how you can approach such workshop. I've added tips and some context.
Who is it for?
Everyone who wants to facilitate a Service Blueprint Workshop. But notice that I do not explain every step. I assume that you already know the concept and you are familiar with basic Service Blueprint structure. If you want to learn more I strongly recommend this article as a start: Norman Nielsen Group. Service Blueprint: Definition.
Cover background image by Maxim Berg on Unsplash.
Get started with this template right now.
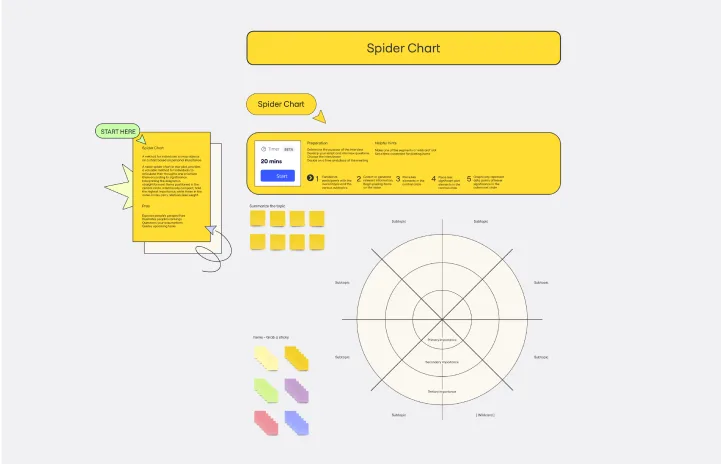
Spider Chart Template
Works best for:
Design
Spider Charts (or star plots) prioritize thoughts and ideas by importance. They help visualize complex information with significant items in the center and less important items progressively farther from it. Radar spider charts help understand relationships between information for better decision-making.

Lean UX Canvas Template
Works best for:
Desk Research, Product Management, User Experience
What are you building, why are building it, and who are you building it for? Those are the big pictures questions that guide great companies and teams toward success — and Lean UX helps you find the answers. Especially helpful during project research, design, and planning, this tool lets you quickly make product improvements and solve business problems, leading to a more customer-centric product. This template will let you create a Lean UX canvas structured around eight key elements: Business problem, Business outcome, Users and customers, User benefits, Solution ideas, Hypothesis, Assumptions, Experimentation.

Journey Map To Plot the Customer Experience
Works best for:
Customer Journey Map
A journey is a tool to map out the customer experience of (a part of) your product/service in a visual way.

Service Blueprint Template
Works best for:
Desk Research, Operations, Market Research
The Service Blueprint template is a visual tool for designing and optimizing service experiences. It provides a structured framework for mapping customer journeys, identifying touchpoints, and aligning internal processes. This template enables teams to visualize the entire service ecosystem, uncover pain points, and innovate solutions to enhance customer satisfaction. By promoting customer-centricity and collaboration, the Service Blueprint empowers organizations to deliver exceptional service experiences and drive sustainable growth.
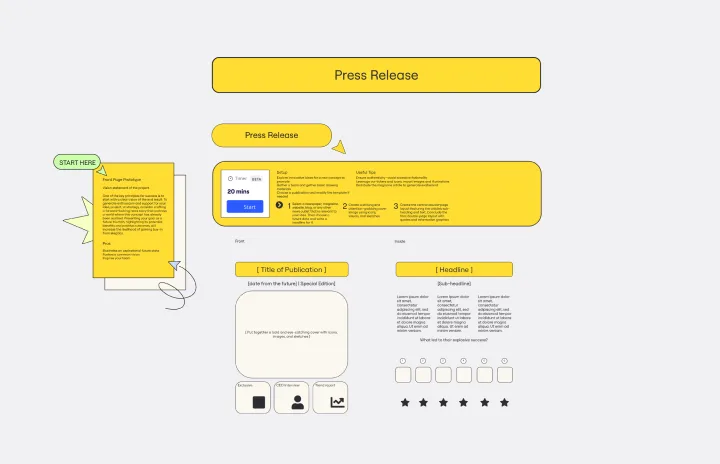
Press Release Template
A clear vision of the result is vital for success. To gain support, use the Press Release Template to create an engaging news story that captures your audience's attention and imagination. Excitement and enthusiasm for your idea will lead to the support and resources you need to make it a reality.
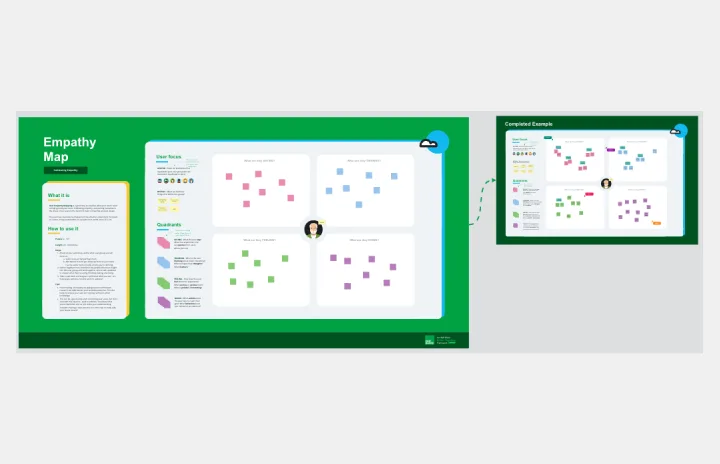
User Empathy Map
Works best for:
Market Research, Research & Design
User Empathy Map template helps you visualize user experiences and needs. It’s an essential tool for teams looking to design products that resonate with their users. Use this template to build empathy and improve user satisfaction.