
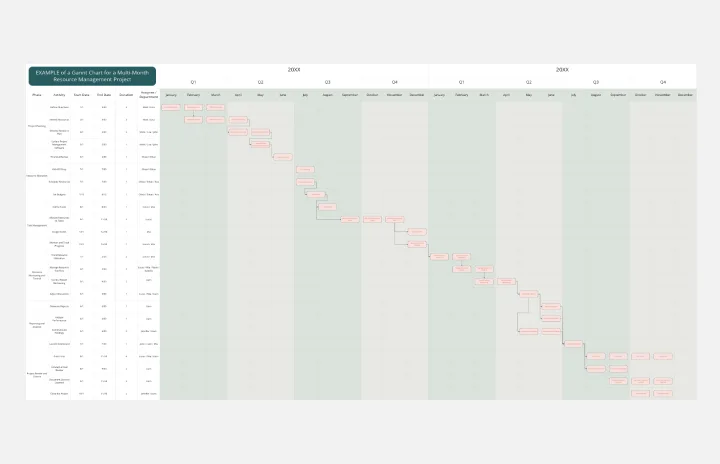
Product Development Gantt Chart
The Product Development Gantt Chart template is designed to help teams plan, track, and manage the entire product development lifecycle from concept to launch.
Purpose
The Product Development Gantt Chart template is designed to help teams plan, track, and manage the entire product development lifecycle from concept to launch. It provides a visual timeline of tasks and milestones, ensuring that all phases of the project are organized and managed effectively.
Key Features
Project Phases and Project Activities
Timeline Visualization: Provides a visual representation of the project timeline. This helps in understanding the overall schedule and identifying potential overlaps or delays.
Dependencies: Shows dependencies between tasks, so you can see which tasks need to be completed before others can start, facilitating better coordination and resource allocation.
Responsibility Assignment: Allows assignment of team members or departments to specific tasks, ensuring accountability and clear ownership of responsibilities.
Progress Tracking: Includes sections for updating the status of each task, making it easier to track progress and make adjustments as needed.
Resource Allocation: Helps in planning and allocating resources effectively by providing a clear overview of task requirements and deadlines.
Why Use the Product Development Gantt Chart Template?
Comprehensive Planning: Helps ensure that all aspects of product development are covered and planned in detail, reducing the risk of missing critical tasks or phases.
Visual Clarity: Provides a clear, visual timeline of the project, making it easier to understand the schedule and identify potential issues.
Improved Coordination: By showing dependencies and task assignments, it helps in coordinating efforts among team members and departments, minimizing conflicts and delays.
Enhanced Tracking: Allows for regular updates and tracking of progress, ensuring that the project stays on track and any deviations are promptly addressed.
Effective Resource Management: Helps in planning and managing resources more effectively, preventing overallocation or underutilization.
Informed Decision-Making: Provides a structured approach to project management, supporting better decision-making and strategic planning.
When to Use This Template
When Starting a New Product Development Project: To ensure all phases and tasks are planned and scheduled from the outset.
For Complex Projects with Multiple Phases: To manage and track various stages of development and their interdependencies.
When Coordinating a Team: To clearly assign responsibilities and track progress across different team members or departments.
This template is especially useful for teams needing a structured and visual approach to manage product development efficiently and effectively.
Get started with this template right now.

8 Different Ways to Organize Your Backlog
Works best for:
Agile
Explore 8 different techniques for managing and prioritizing work effectively with this template. From prioritization matrices to story mapping, it offers a comprehensive overview of backlog management strategies. By understanding the strengths and limitations of each approach, teams can tailor their backlog organization to optimize workflow, empowering teams to stay organized and focused on delivering value.
Spider Diagram Template
Works best for:
Diagramming, Mapping
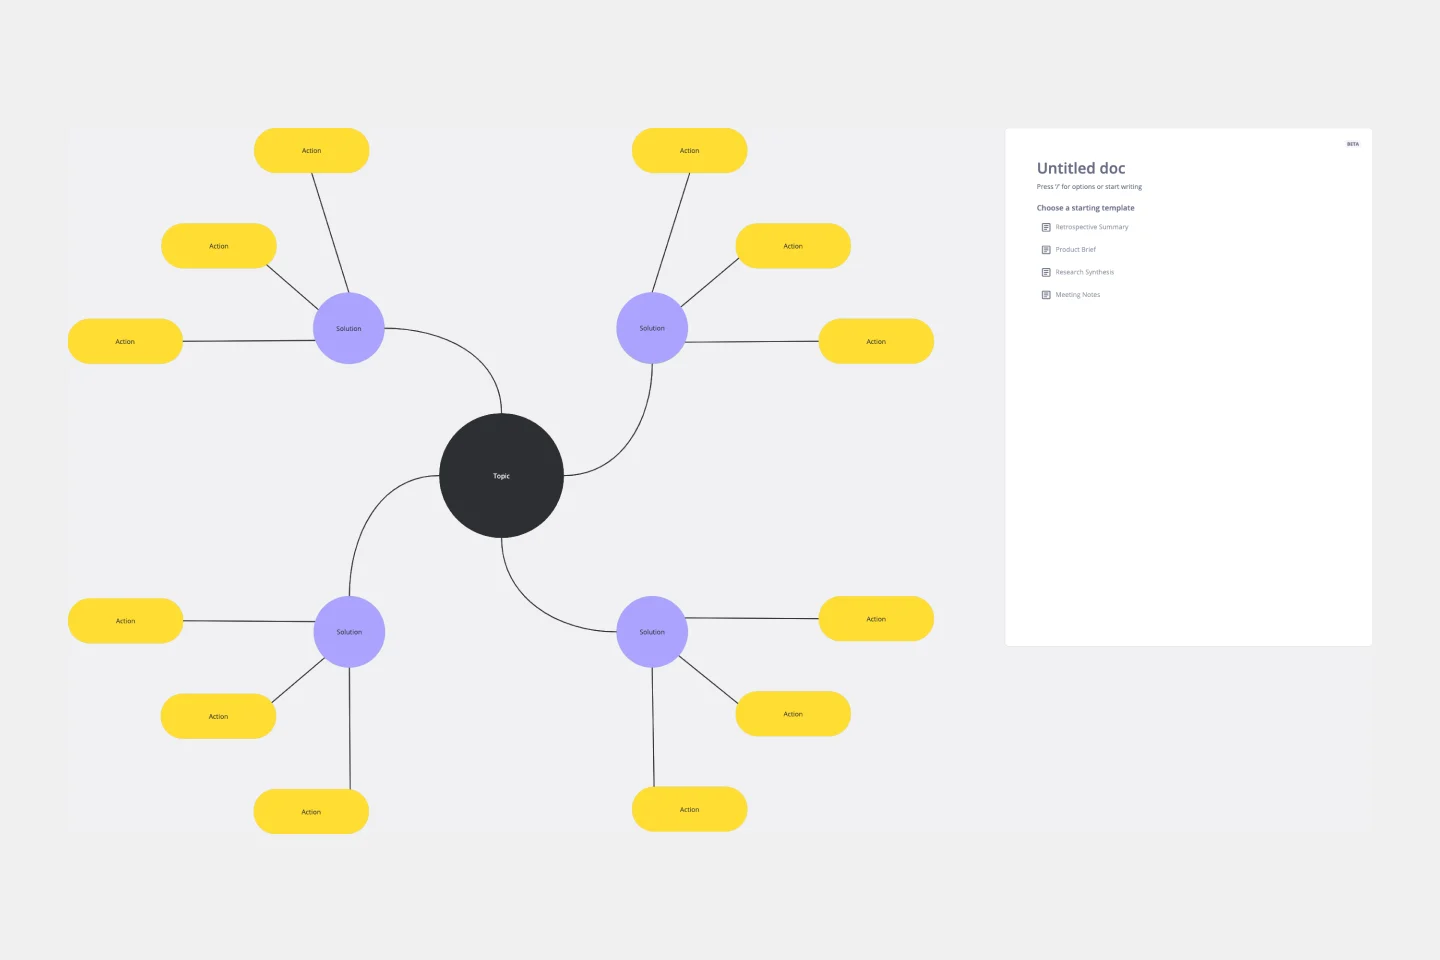
Perfect for brainstorming sessions, project planning, or simply organizing thoughts, the Spider Diagram Template allows you to create 'legs' branching out from a central idea, representing related topics or subtopics.
Lesson Plan Template
Works best for:
Education
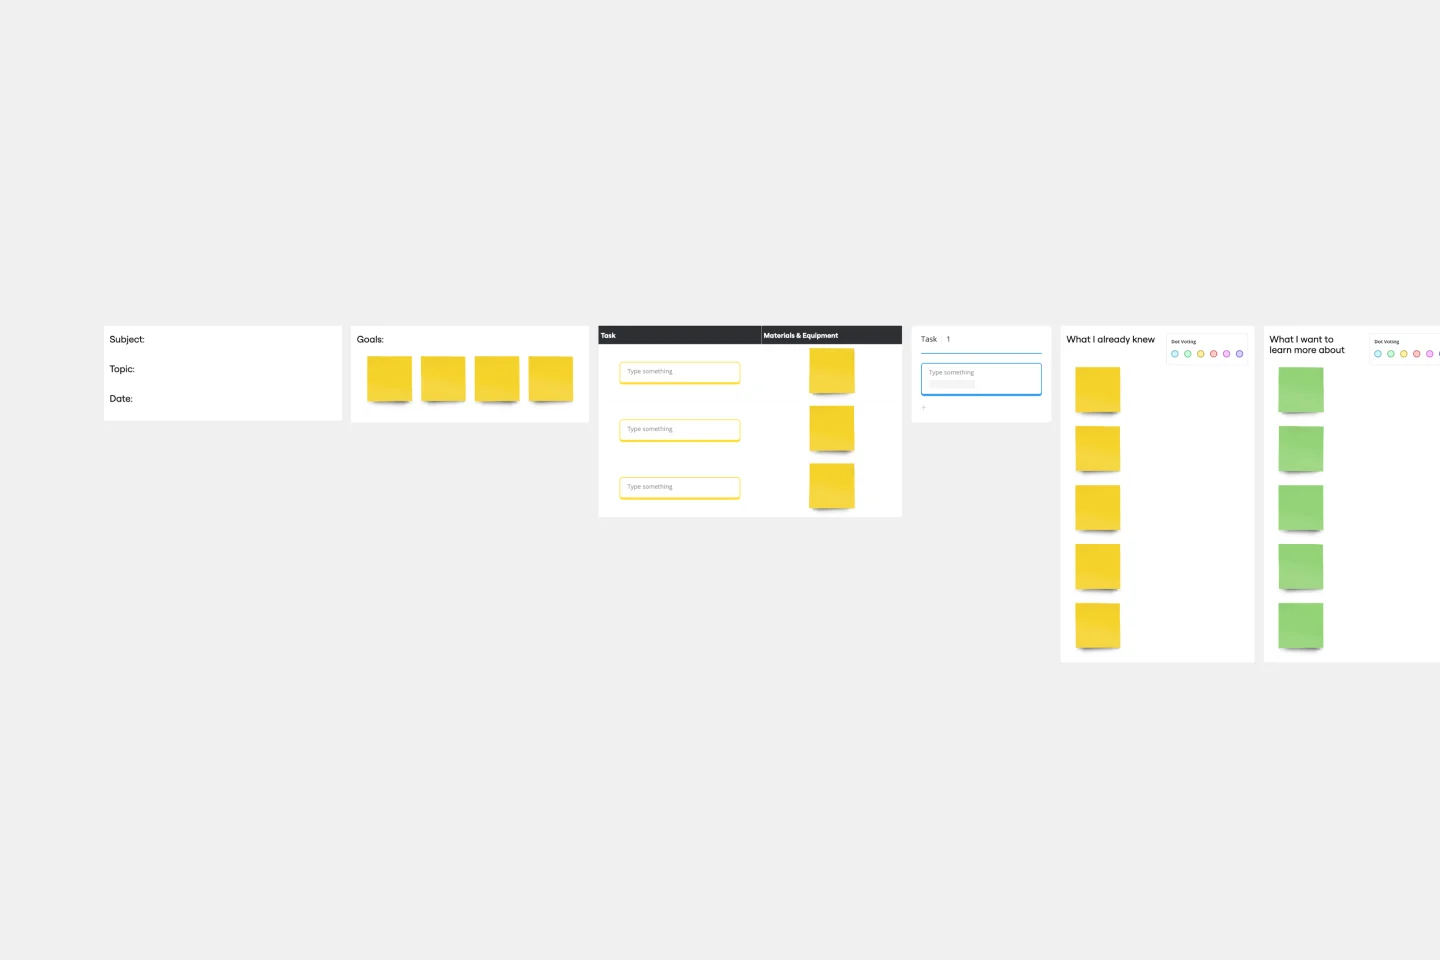
Use the Lesson Plan to inform everyone about assignments, get clarity when planning lessons, and align your student’s expectations. Many educators use the Lesson Plan template to organize their teaching material and assess learning experiences and insights into students’ progress and interests. The Lesson Plan is an excellent tool for giving students an overview of the learning plan and connecting deeper with the topics and the study sessions.

Venn Diagram for Learning and Education
Works best for:
Venn Diagram
Enhance learning and teaching with the Venn Diagram for Learning and Education template. Use it to compare concepts, illustrate relationships, and facilitate discussions. This template helps students and educators organize information visually, making complex ideas easier to understand and retain. It's an excellent tool for classrooms, study groups, and professional training sessions, promoting deeper understanding and active learning.
Example Mapping Template
Works best for:
Product Management, Mapping, Diagrams
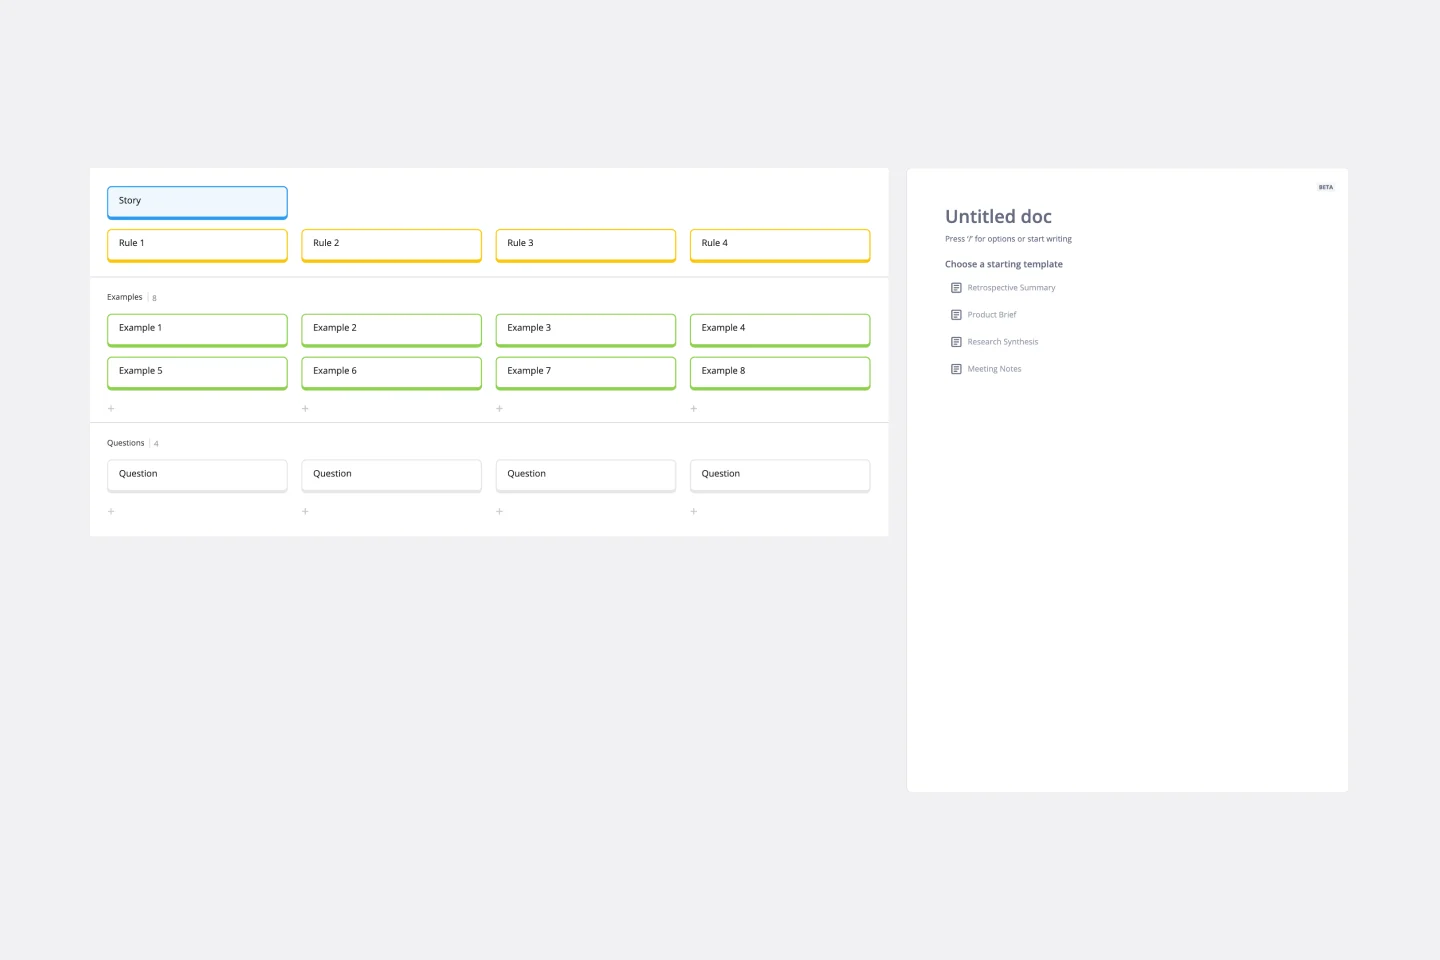
To update your product in valuable ways—to recognize problem areas, add features, and make needed improvements—you have to walk in your users’ shoes. Example mapping (or user story mapping) can give you that perspective by helping cross-functional teams identify how users behave in different situations. These user stories are ideal for helping organizations form a development plan for Sprint planning or define the minimum amount of features needed to be valuable to customers.
Resource Management Gantt Chart
Works best for:
Strategy, Planning
Efficient resource allocation is crucial for project success. The Resource Management Gantt Chart template helps you plan and manage your resources effectively. Use it to track the availability and allocation of personnel, equipment, and materials throughout your project. This template ensures resources are optimally utilized, reducing waste and avoiding delays, providing a clear overview of assignments and workload balance.