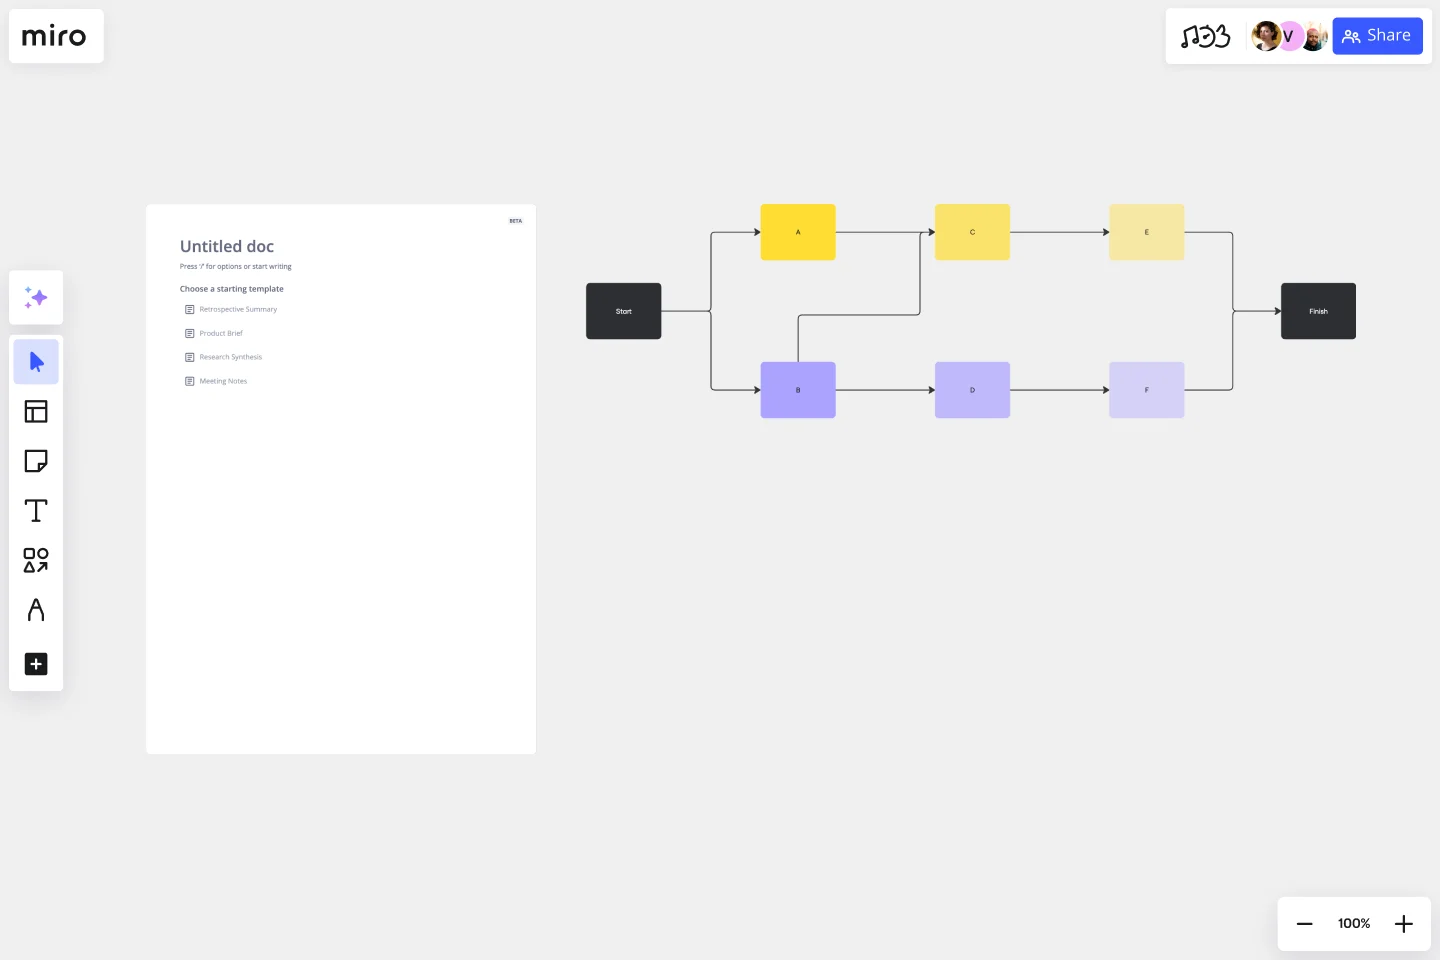
Precedence Diagram
Optimize resource allocation and ensure more efficient project progression.
About the Precedence Diagram Template
The Precedence Diagram Template is a powerful resource to help teams visualize their project workflows with clarity and precision. By enabling a clear representation of project management processes, the template fosters enhanced productivity and streamlines tasks, ensuring teams can navigate their projects with confidence and efficiency.
What is a Precedence Diagram?
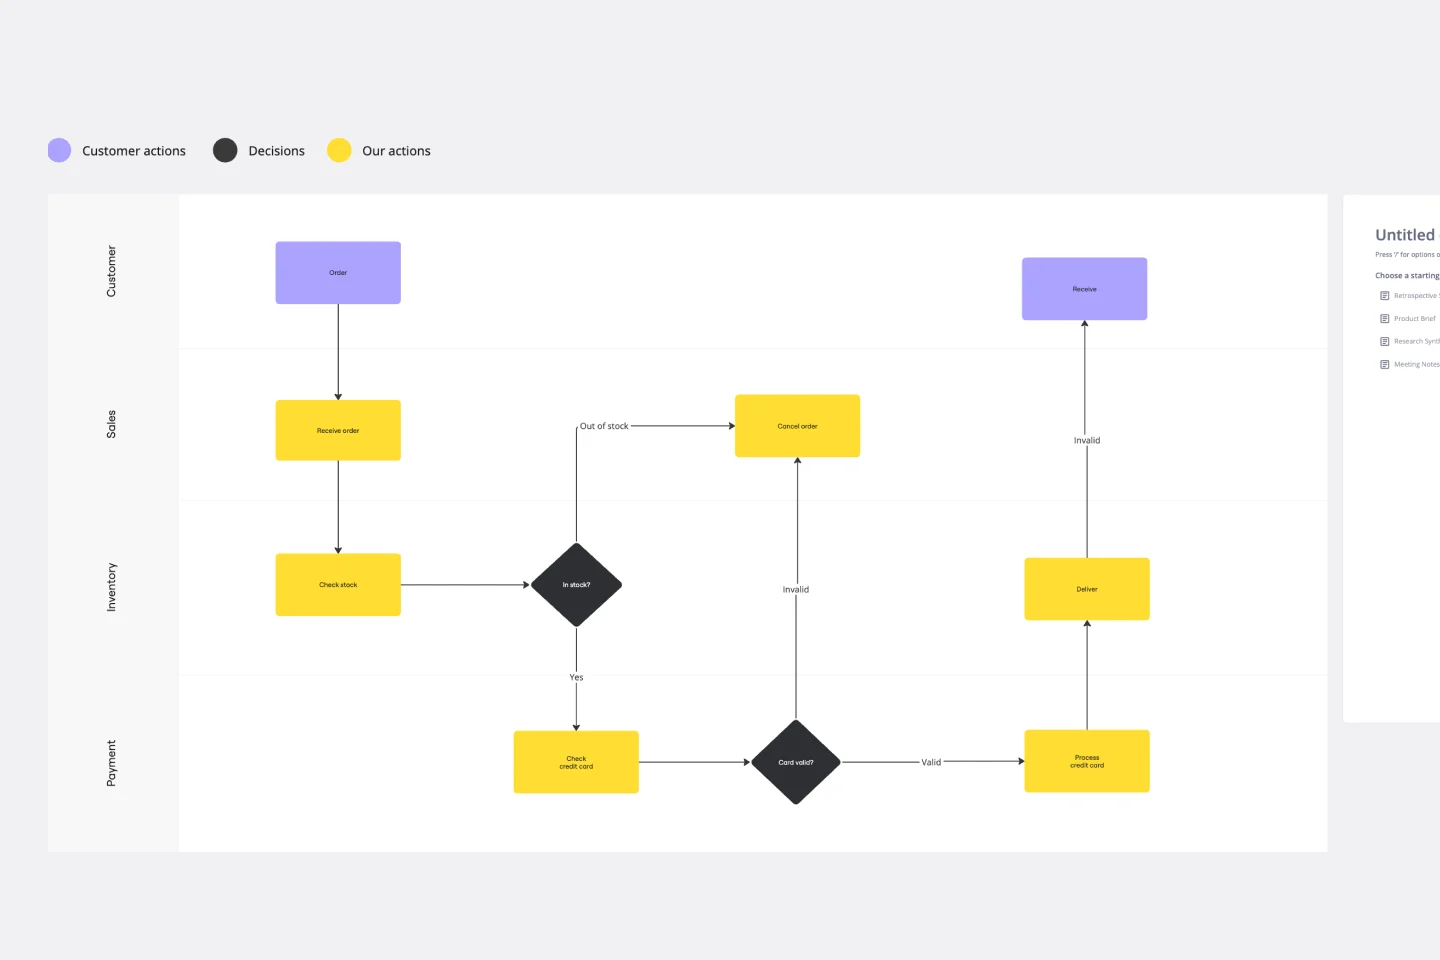
A precedence diagram, often called a Project Network Diagram, is a graphical tool that shows project activities and their interdependencies. By visualizing these connections, teams can gain clarity on the order in which tasks must be performed and identify which tasks can occur concurrently. The template is designed to simplify the creation of these valuable visualizations.
One significant benefit of using the Precedence Diagram Template is its ability to enhance project efficiency. By clearly outlining task sequences and potential overlaps, project managers can allocate resources more effectively and avoid bottlenecks, ensuring that the project remains on track and meets its deadlines. This foresight can save time and lead to substantial cost savings, making the precedence diagram an indispensable tool for any project-driven team.
How to use a Precedence Diagram Template in Miro
Miro's interactive board features, coupled with its automated diagramming capabilities, make creating precedence diagrams a breeze. Here's how you can set up a Precedence Diagram Template on your Miro board in four simple steps:
Select the Precedence Diagram Template: In the Template Library, search for "precedence diagram" and select the template from the results.
Customize your diagram: Use Miro's automated diagramming features to draw connections between tasks, indicating their relationships. Simply drag and drop items to reposition them or connect them with arrows to show the flow of tasks.
Collaborate and share: Invite your team members to collaborate in real time. Miro enables you to discuss, edit, and refine the diagram, ensuring everyone's on the same page.
Can I customize the look and feel of the precedence diagram?
Yes, Miro's interface is highly intuitive, allowing you to change colors, shapes, and fonts to match your team or project's branding.
Is there a limit to how many tasks I can add to my diagram?
There's no strict limit. However, for readability and usability, we recommend ensuring that your diagram remains clear and uncluttered by periodically reviewing and refining it.
Can I link other Miro boards or external resources to tasks in the precedence diagram?
Yes, you can! Simply use the linking tool in Miro to connect tasks to relevant boards or external resources, providing more context and information.
How do I ensure that only authorized team members can edit the diagram?
Miro allows you to set permissions for each individual or group. You can grant view-only, commenting, or editing access based on what's suitable for your team's needs.
Get started with this template right now.
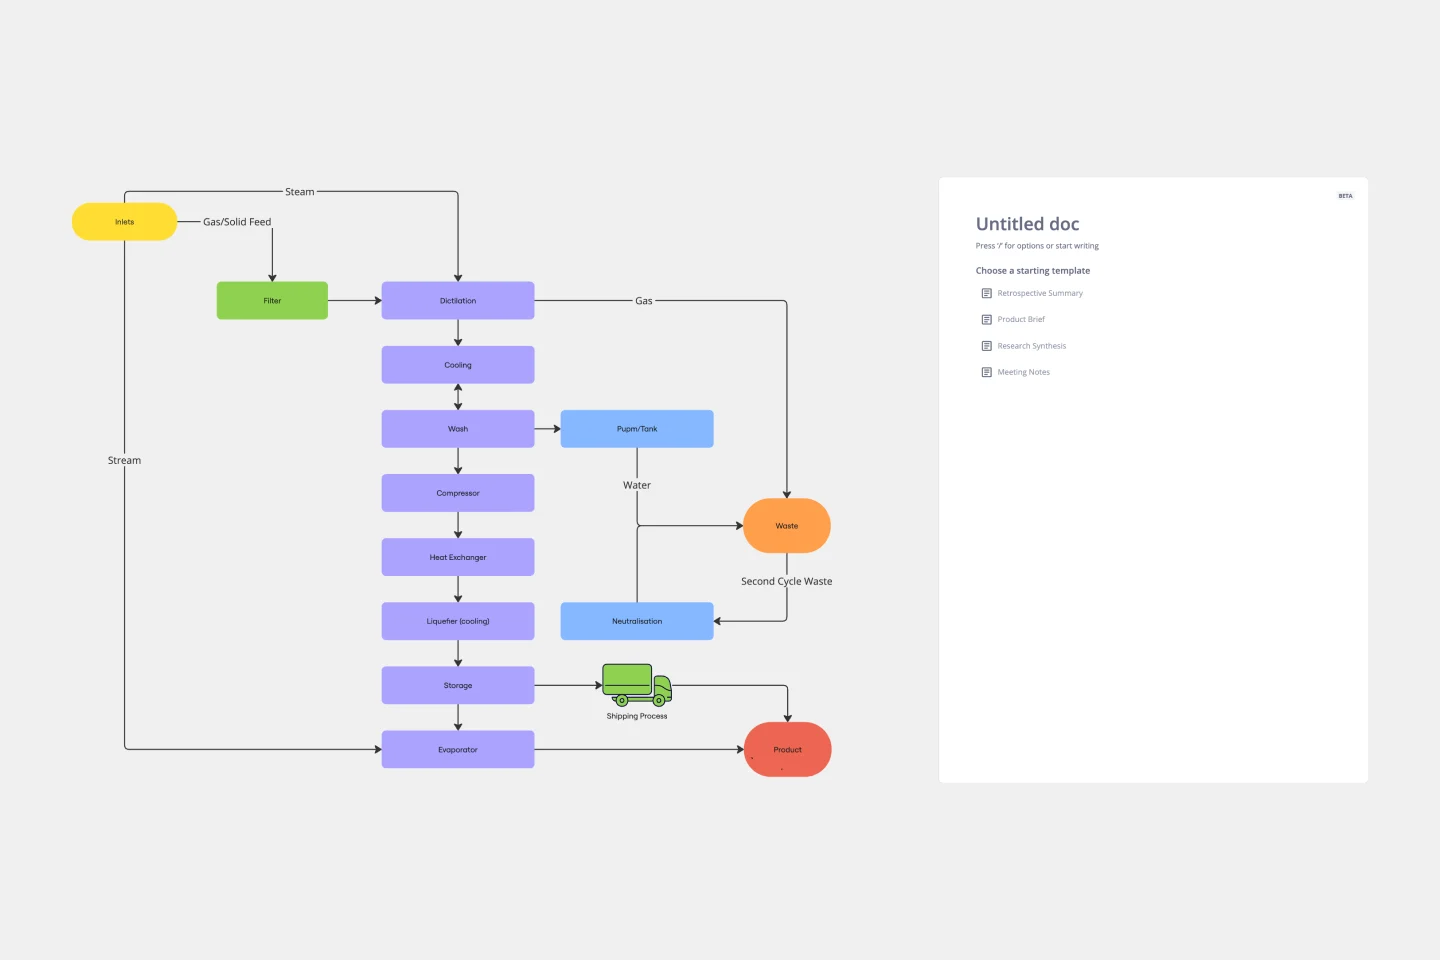
Block Diagram Template
Works best for:
Mapping, Software Development, Diagrams
Use this template to illustrate technical systems. Blocks represent important objects in the system, and arrows demonstrate how the objects relate to each other. Perfect for engineers, workflow managers, or anyone trying to build a better process.
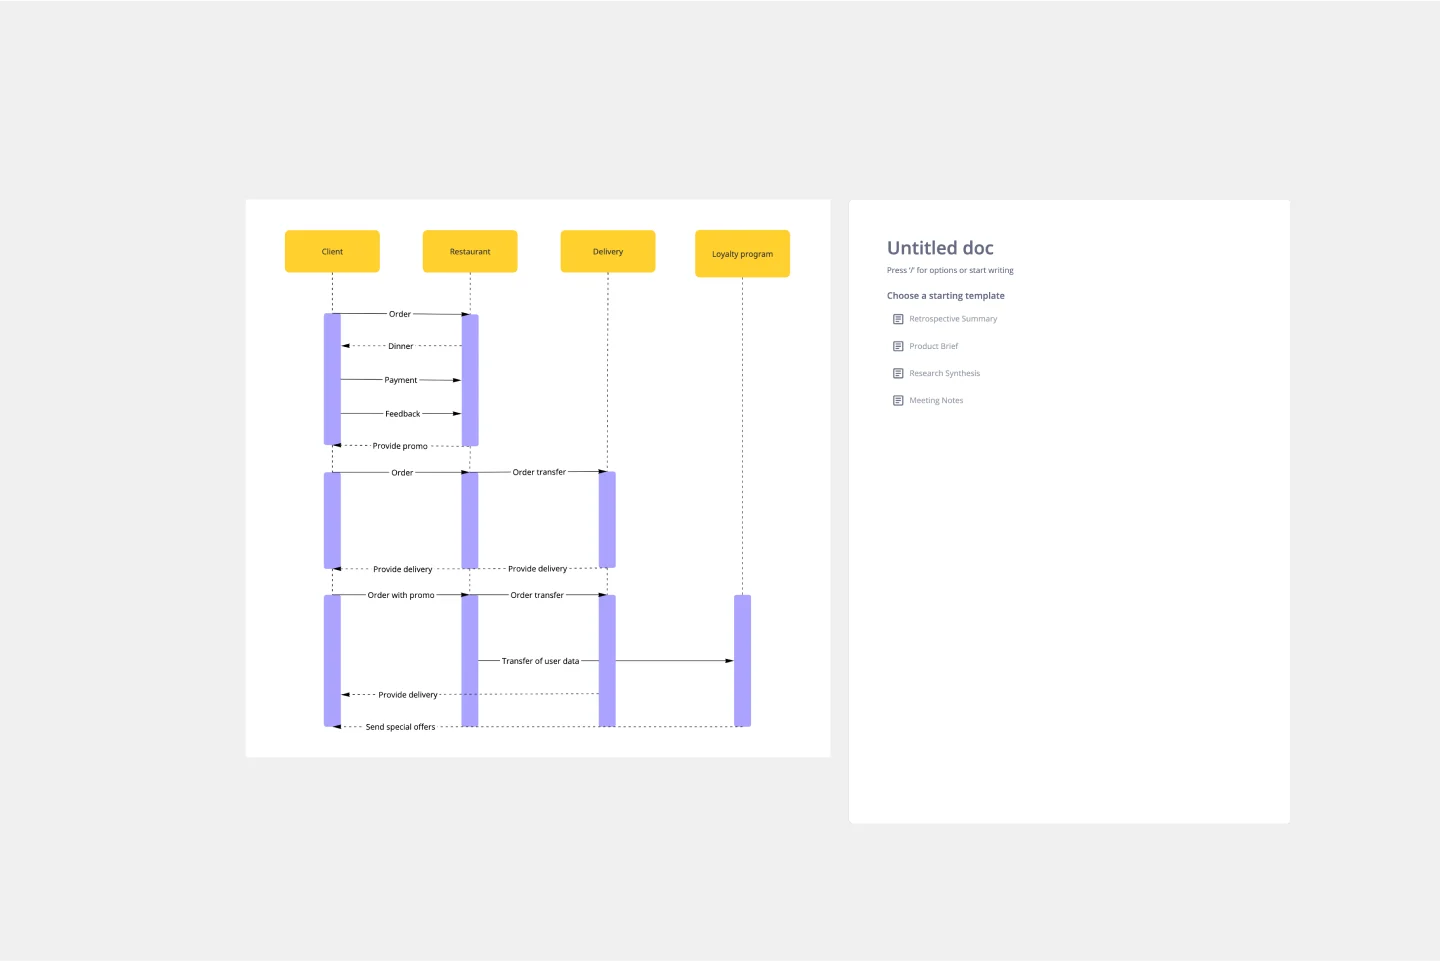
UML Sequence Diagram Template
Works best for:
Software Development, Mapping, Diagrams
Analyze and showcase how external entities interact with your system using a sequence diagram. Get a bird’s-eye view of your work processes, business functions, and customer interactions using this diagram. Also, identify any potential problems early and solve them before implementation.
Workflow Template
Works best for:
Project Management, Workflows
The digital world requires collaboration, and better collaboration leads to better results. A workflow is a project management tool that allows you to sketch out the various steps, resources, timeline and roles necessary to complete a project. It can be used on any multi-step project, whether it’s a business process or otherwise, and is ideal for plotting out the tangible actions you’ll need to take to achieve a goal and the order in which you need to complete those actions.
Swimlane Diagram Template
Works best for:
Flowcharts, Diagrams, Workflows
A swimlane diagram shows you which stakeholders are responsible for each area of your critical processes. You can use it to understand current processes or plan new ones.