KWL Chart Template
Focus on important ideas and expand your learning.
About the KWL Chart template
A KWL chart allows you to guide your audience through learning a concept by breaking down the learning process into three steps: what you already know, what you want to know, and what you learned.
What is a KWL Chart?
A KWL chart is a learning tool that helps guide people through an educational session or reading. It was created in 1986 by Donna Ogle as a chart for students to improve their learning progress.
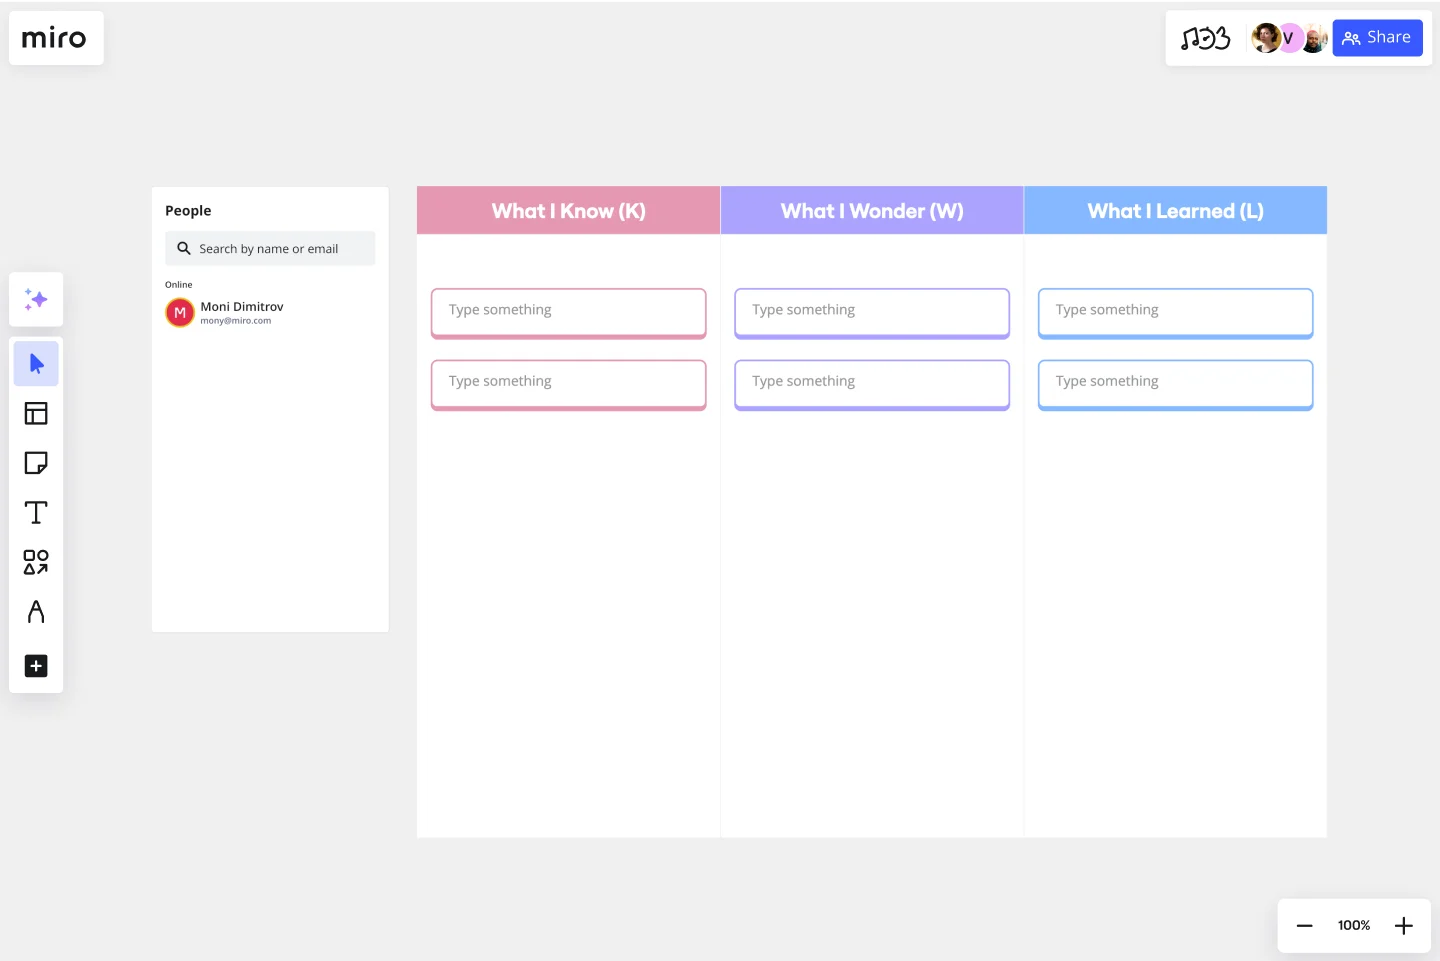
All KWL charts have three columns: What I Know, What I Wonder, and What I Learned. You begin your session by taking stock of what you know. Then, record what you want to get out of your session. Last, you record what you have learned.
When do you need a KWL chart?
Let’s take a look at the two common scenarios where using a KWL chart can be helpful:
To help students: KWL charts can be a helpful tool for students to learn new concepts and be accountable for their learning. They can be clear about what they already understand and reflect on what they’ve learned about a specific topic of study.
To support employees: As a business leader, the KWL chart can help staff learn and retain new information. They can also return to the chart later to refresh their memory.
Although these are the most common use cases, a KWL chart is helpful whenever you need to learn something new and retain knowledge. It helps you track the learning process, starting with what you already know, what you hope to learn, and what you did learn.
The bottom line is that a KWL chart is not limited to these two situations. It’s a versatile template that can be used for a variety of reasons.
How do you fill in a KWL chart template?
Filling in a KWL chart template is a pretty straightforward task. Follow these steps to see for yourself:
Step 1) Add what you already know in the first column. Begin by listing everything you know about a topic and recording that information in the What I Know column. This will solidify your starting position and help you identify gaps in your knowledge.
Step 2) Outline what you want to know in the second column. Generate a list of questions or statements about what you want to know in the What I Wonder column. These statements will guide your learning to give you direction throughout the learning process.
Step 3) Summarize what you learned in the final column. When you’ve completed your training, lessons, or research, you can outline what you’ve learned in the What I Learned column. Use these statements to review what you learned in comparison with what you wanted to learn in the second column.
In some charts, you might come across a fourth column titled How will I learn? This would go between the second and third columns. In this column, you’ll outline the steps you plan to take to develop your learning. Whether that’s conducting research online, speaking to a manager, or having a discussion with a faculty member — this is where you’ll outline your actionable steps.
Benefits of using an online KWL Chart template
If you want to save yourself time, using an online template could be the way to go. You don’t have to worry about creating it from scratch. You simply have to select the template and add your information to the columns.
Let’s take a look at a few more reasons why using an online template can make your life easier.
Collaborate and share your chart. If you’re using an online template, you’ll be able to collaborate with your colleagues. With Miro, you can share the template with other users. People can add comments and other visual notes so you can collaborate effectively on the same chart.
Update information in real-time. Using an online chart makes it easy to update the information and make changes. If your chart is on a blank sheet of paper, you’ll need a pen and a lot of scribbling to make changes. But with an online template, all you need is a few clicks and taps on the keyboard, and your chart has been instantly updated.
Customize the template. Platforms like Miro have a lot of features and functions that allow you to customize existing templates. You can change fonts, add new text, upload files, add shapes, and even add additional columns to your template if you want to. As a result, you can create a template that’s perfect for your needs.
How do I make a KWL chart online?
Creating a KWL chart online is pretty simple. You can start by selecting this template to get the ball rolling. Feel free to customize our existing template if you want to make any changes. When your template is ready to go, you can add information to the What I Know column. This is your starting point, so put all your current knowledge into this section. Next is the What I Wonder column. Here, you’ll add all the information you want to learn. You can write this as questions or statements — whatever works best for you. The final column is titled What I Learned, although it’s sometimes known as the Complete column. This is where you’ll outline all the new information you’ve learned. It’s also a good place to reflect on how you’ve progressed through your learning.
Is the KWL chart a graphic organizer?
Yes, the KWL chart is often described as a graphic organizer. It’s a great way to outline what you want to learn and how you plan to learn it, as well as to keep track of what you’ve learned. It’s very much a visual of the learning process.
What does the H stand for in a KWL chart?
‘H’ is an optional column that stands for ‘How will I learn?’ This column isn’t included in every template, but it can be used between the second and third columns. It outlines where you plan to get new information and how you’ll retain it. If you’re using Miro’s template, you can easily add this column if you want to use it.
Get started with this template right now.
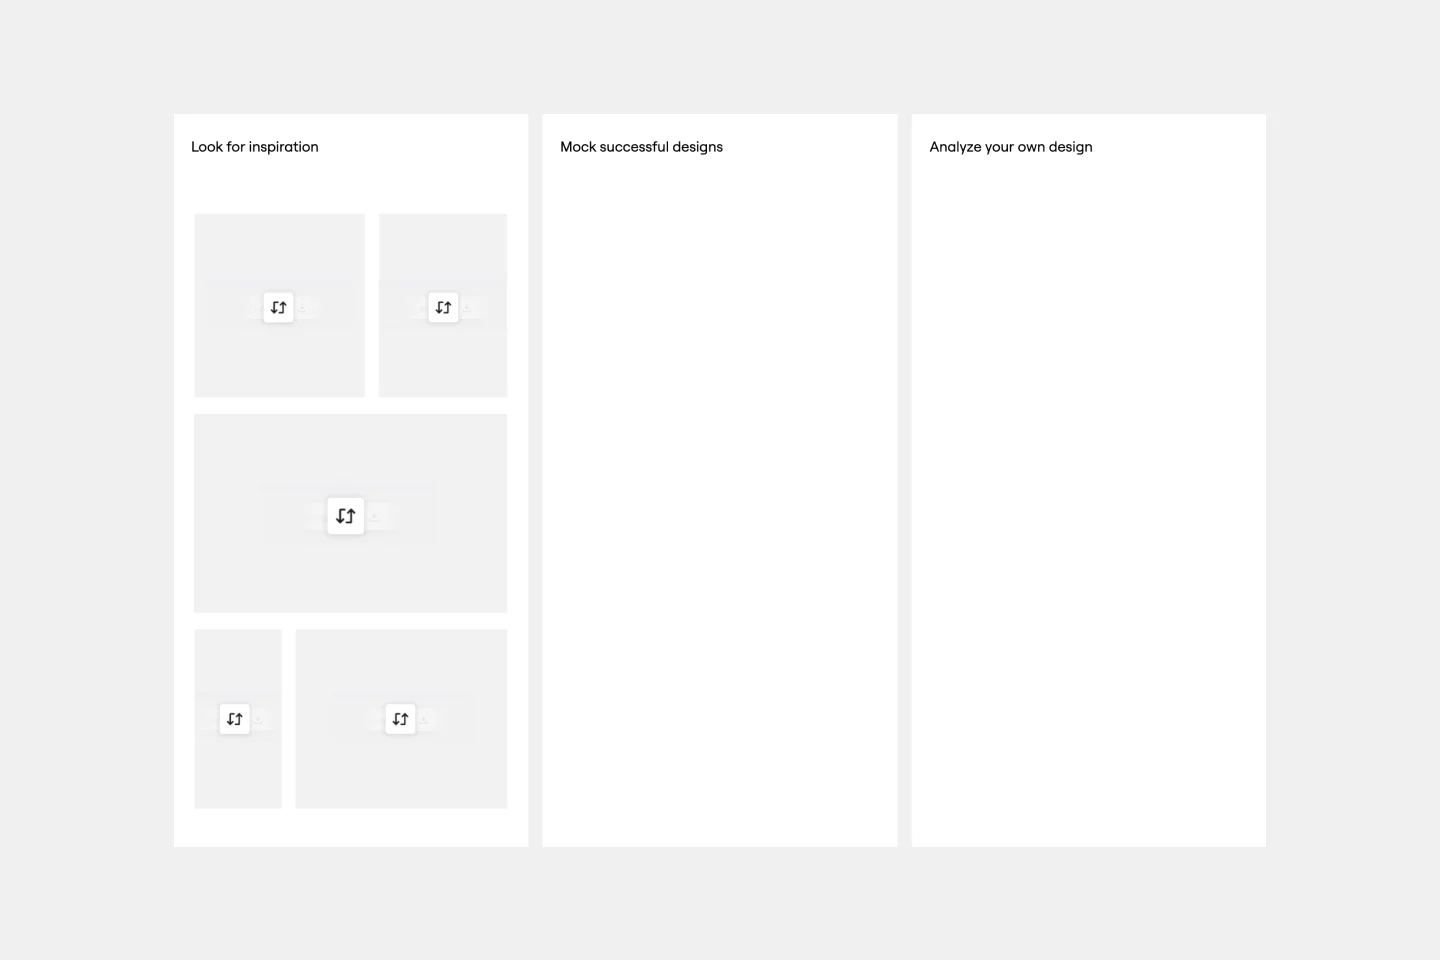
Look Mock Analyze Template
Works best for:
Design, Desk Research, Product Management
Doing your homework (aka, the research) is a key step in your design process, and the Look, Mock, Analyze approach helps you examine, structure, and streamline that step. With this powerful tool you’ll be able to identify your strengths and weaknesses, what you did right or wrong, and whether you spent time efficiently. Our Look, Mock, Analyze template makes it so easy for you to discover inspiration, mock up designs, and get feedback — you can start by setting up your board in less than a minute.
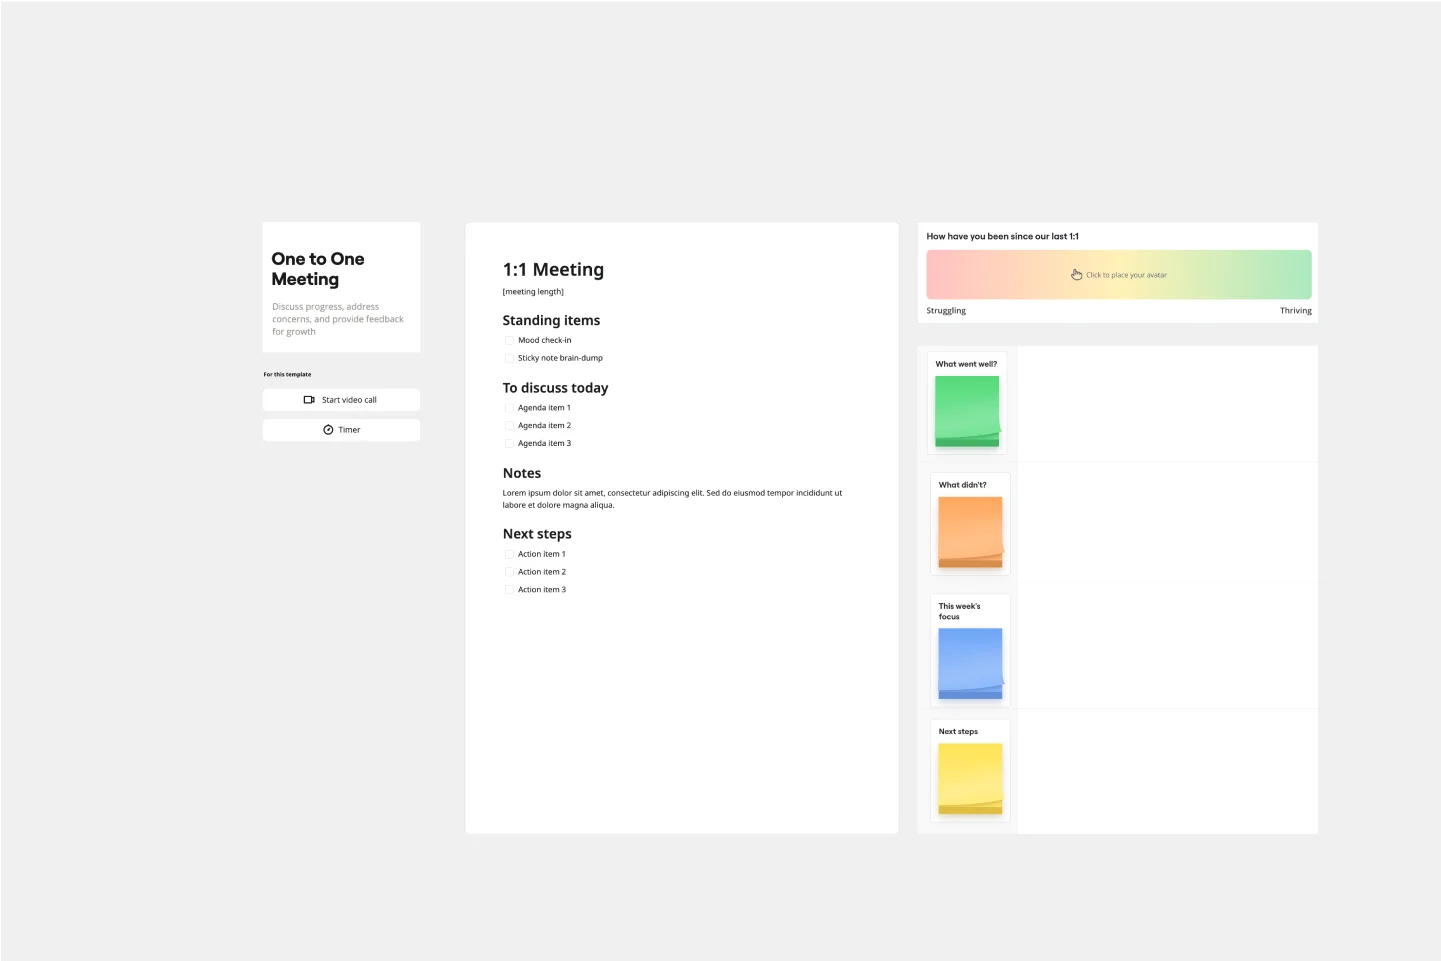
One-on-one Meeting Template
Works best for:
Meetings
Ensure your meetings are productive by using a one-on-one meeting template. Create and stick to your agenda items, understand what’s going well, what isn’t working, and how to improve. Discuss what’s been accomplished and what’s still in progress.