
Journey Map To Plot the Customer Experience
Understand and plan your user journey better with this map!
A journey is a tool to map out the customer experience of (a part of) your product/service in a visual way.
Suppose your organization provides a product or service, for example, mobile phone subscriptions. On your Journey Map, you will find a customer who goes through the process of selecting and purchasing a subscription (scenario), how the customer perceives each step (experience), what you learned about the overall needs of your customers (insights), and what can still be improved (opportunities). A journey map will serve your organization in understanding how your customers interact with your product/service and it helps see opportunities to improve the customer experience.
This sounds more difficult than it is, but use this template and you will be guided step-by-step in making your own journey map.
From our experience as a service design agency, we also provide you with tips and examples for how you can use a Journey Map for empathizing with your customer and improving your customer experience. Additionally, a Journey Map can be used to gain a complete overview of your services and improve collaboration between your departments.
Our instructions for making your own Journey Map:
The scenario: Determine the scenario and profile. With this scenario, sketch a first draft of what this journey could look like from the perspective of your customer. You can enrich the scenario by adding drawings or pictures.
The research insights: collect and plot existing data on the journey map (reviews, earlier research, and personas). Look for knowledge gaps and assumptions that need validation. Execute user research to collect additional insights about the customer experience (i.e. interviews or observations). Analyze this data and cluster corresponding findings, quotes and insights and plot these on your journey map.
The customer experience: Define the customer experience based on the research and insights collected, and draw the emotion curve. Here you emphasize where things go well and where improvement is needed. Determine which steps make or break the overall experience and where to focus first.
The opportunities: Together with key stakeholders, analyze the journey to spot opportunities that can improve your customer experience. The journey might contain a lot of information and opportunities, so summarise the key takeaways to make the journey actionable, and determine what the next steps will be.
Get started with this template right now.
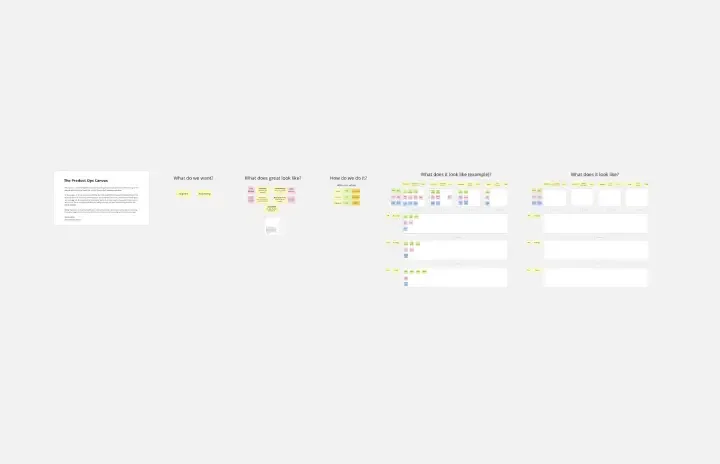
Product Ops Canvas
Works best for:
Product Management, Planning
The Product Ops Canvas template helps product managers align product strategies with operational capabilities. By mapping out key operational processes, tools, and metrics, this template fosters alignment between product and operational teams. With sections for identifying bottlenecks and optimizing workflows, it supports continuous improvement in product operations. This template serves as a guide for driving efficiency and scalability in product management processes, enabling teams to deliver high-quality products at scale.
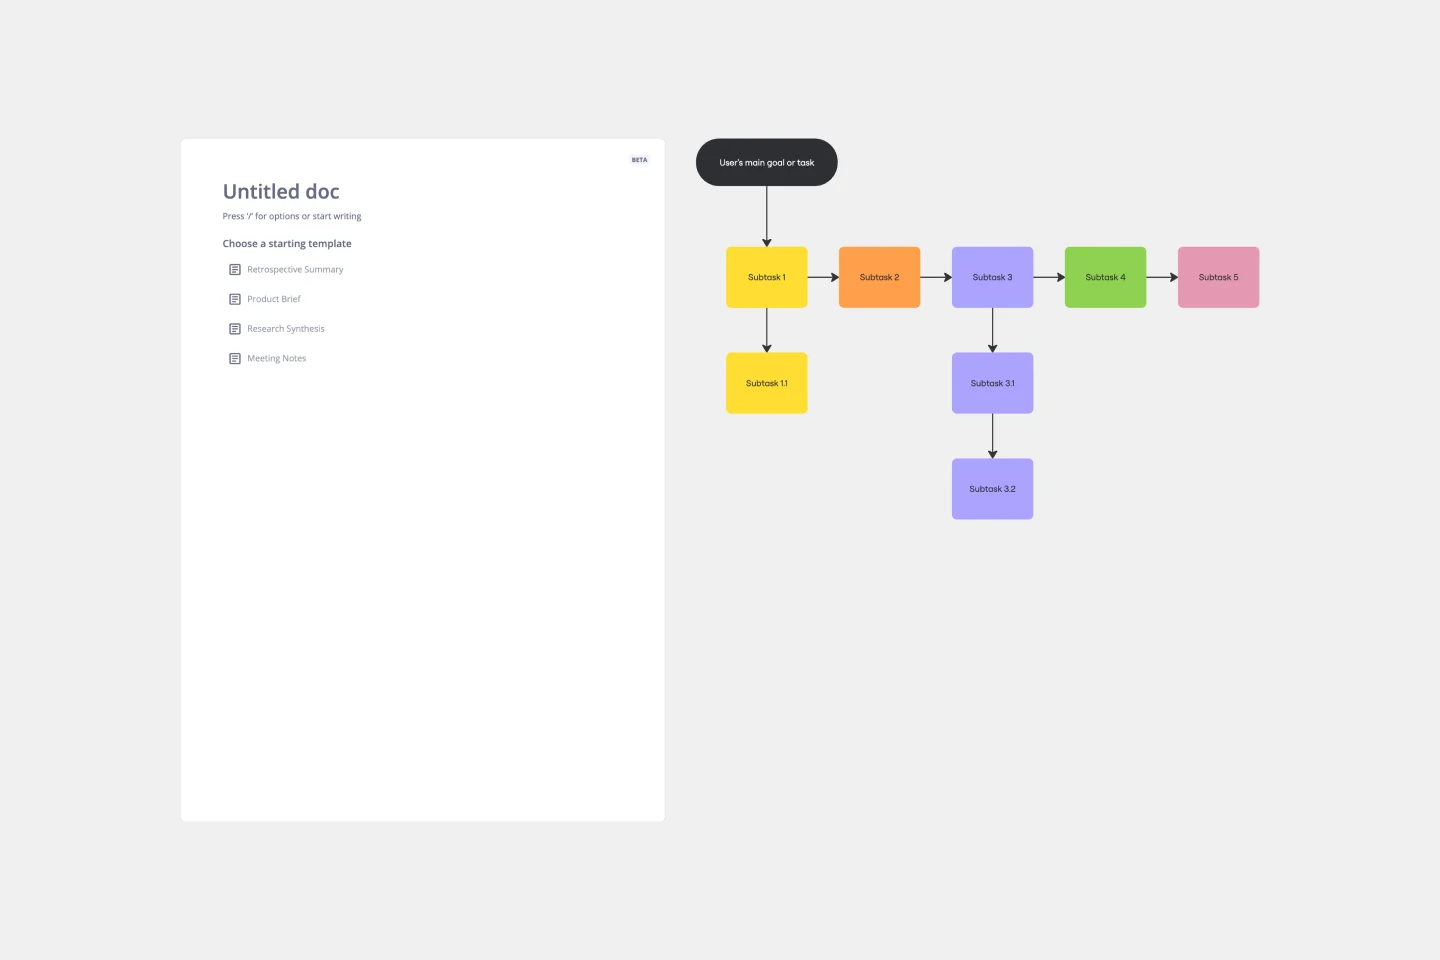
Task Analysis Diagram Template
Works best for:
Diagramming
The Task Analysis Diagram Template is a helpful tool that simplifies complex tasks by breaking them down into smaller, more manageable steps. This strategic approach brings clarity and ensures a systematic method for tackling complex user paths. The template's most significant advantage is its precision, as it maps out every detail of a task to guarantee that nothing is missed. This results in more efficient operations.
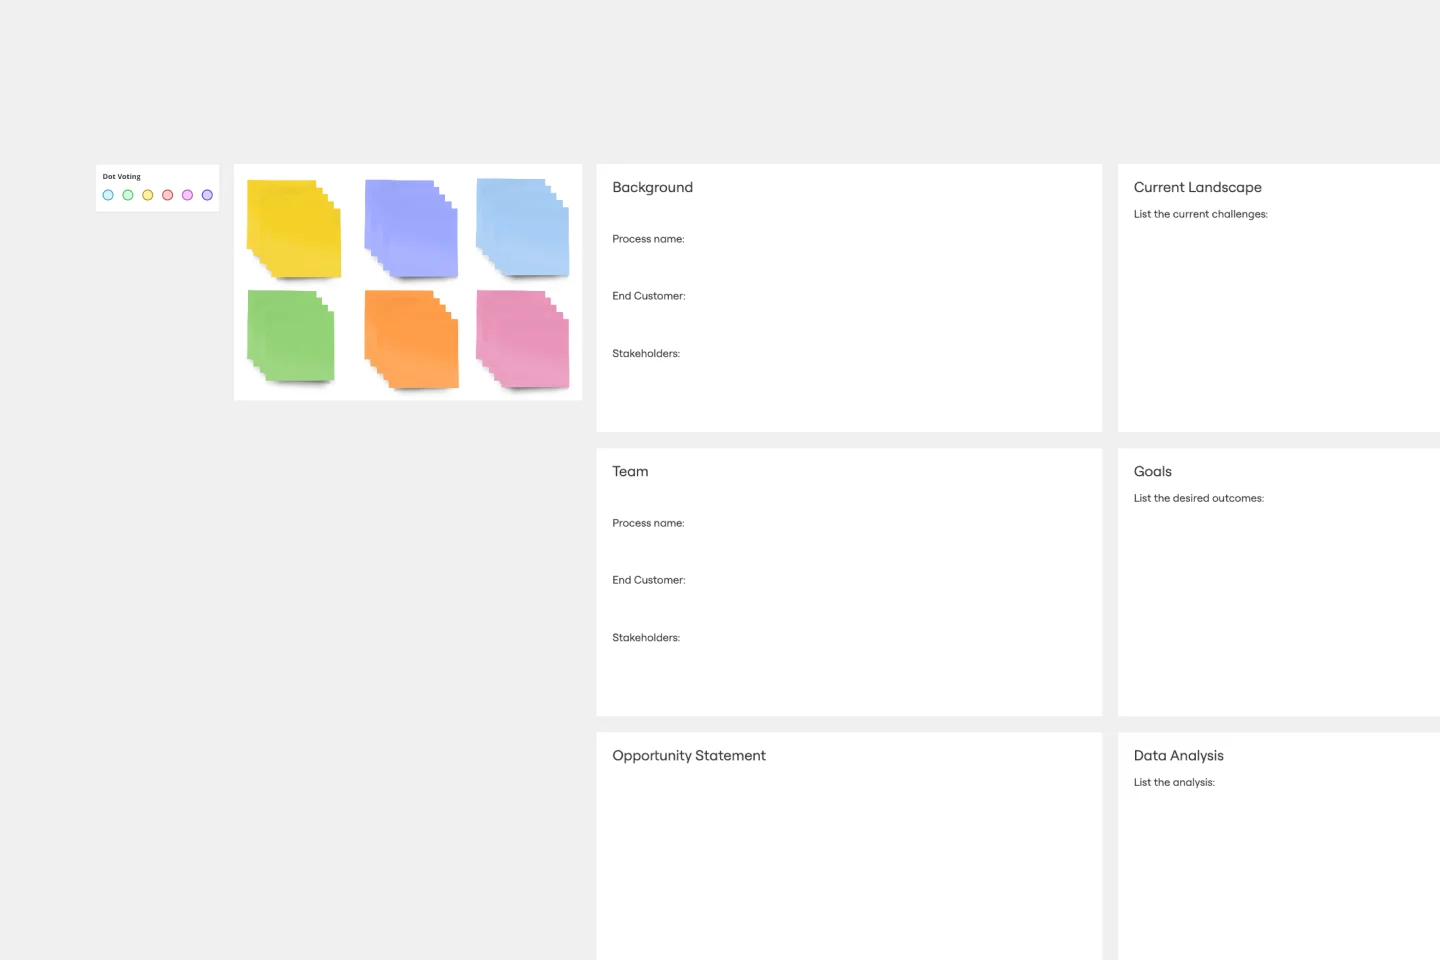
A3 Report Template
Works best for:
Product, Strategy and Planning
The A3 report template is a carefully designed tool that provides teams with a structured and visual methodology to tackle challenges. It divides the problem-solving process into background, current context, data analysis, and implementation plans, ensuring a comprehensive approach to each issue. One of the major advantages of this template is its "Data Analysis" section, which enables teams to delve deeply into concrete insights and trends. This data-driven approach ensures that all recommendations and actions are based on real, tangible evidence rather than just intuition, leading to more effective and strategic decision-making.
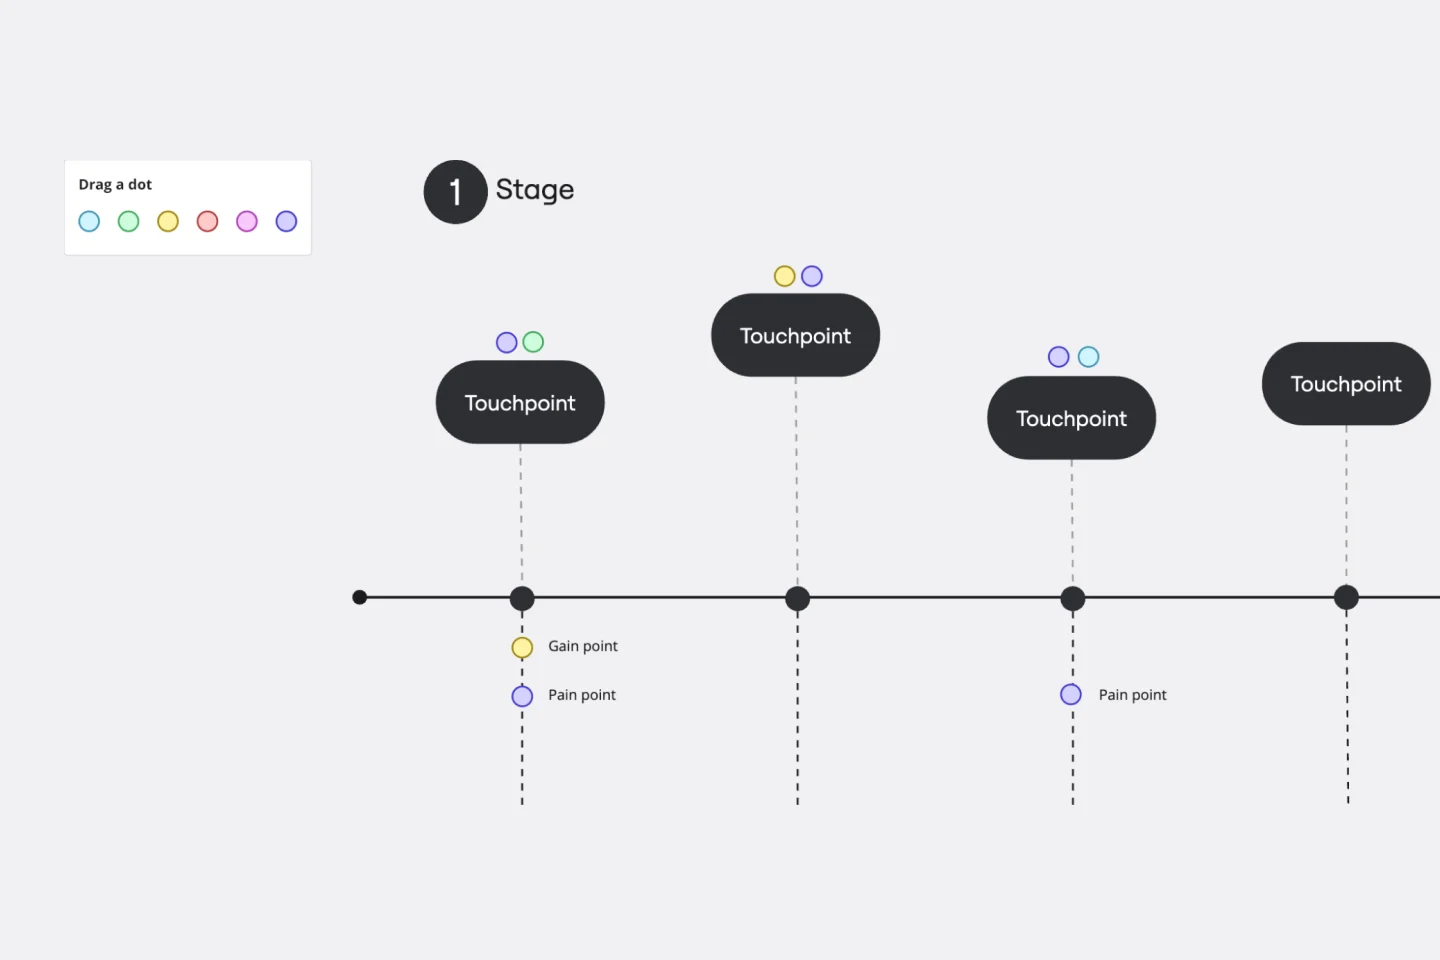
Customer Touchpoint Map Template
Works best for:
Desk Research, Product Management, Mapping
To attract and keep loyal customers, you have to truly start to understand them—their pain point, wants, and needs. A customer touchpoint map helps you gain that understanding by visualizing the path your customers follow, from signing up for a service, to using your site, to buying your product. And because no two customers are exactly alike, a CJM lets you plot out multiple pathways through your product. Soon you’ll be able to anticipate those pathways and satisfy your customers at every step.
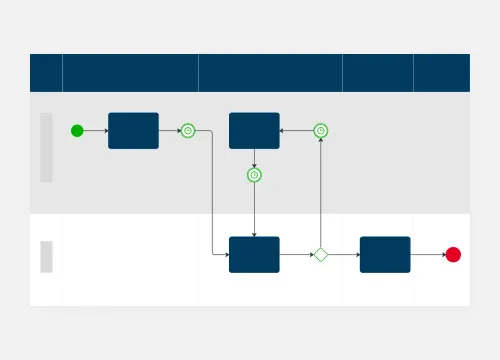
BPM
Works best for:
Diagramming
The BPM (Business Process Management) template is a visual tool for modeling, analyzing, and optimizing business processes. It provides a structured framework for documenting process flows, identifying bottlenecks, and improving efficiency. This template enables organizations to streamline operations, enhance productivity, and drive business performance. By promoting process transparency and agility, the BPM template empowers teams to achieve operational excellence and deliver value to stakeholders.