Job Search Process Diagram
Job searches are not meant to be a walk in the park. You may feel frustrated, rejected, or overwhelmed at several points in the process, and if you don’t, you’re not doing it right.
Job searches are not meant to be a walk in the park. You may feel frustrated, rejected, or overwhelmed at several points in the process, and if you don’t, you’re not doing it right. 🚶♂️🚫 🤯
But that doesn’t mean there aren’t resources out there to help you navigate the search to help you not only survive, but thrive. 🌟
This diagram helps job seekers organize their job search by providing a tool to track their applications as they progress through companies’ multi-stage candidate pipelines. 📋 💼
Whether you’re in your final stages and negotiating an offer, or you have nine rounds of interviews ahead of you (the worst!), this template is designed to be your job search sidekick from beginning to end. 🔄 👔
About the Job Search Process Diagram
Designed for professionals, recent graduates, and career changers, this template is your indispensable tool for navigating the competitive job market efficiently and effectively. Ideal for professionals at all career stages, our Job Search Process Diagram is your ally in navigating the complexities of the job market and securing your next career opportunity.
This template includes:
Structured sections to facilitate a methodical approach to the job search process.
Interactive areas for team collaboration, allowing for collective input and refinement of your job search strategy.
Guidance on avoiding common pitfalls and maximizing your chances of success in the job market.
What this template helps you achieve
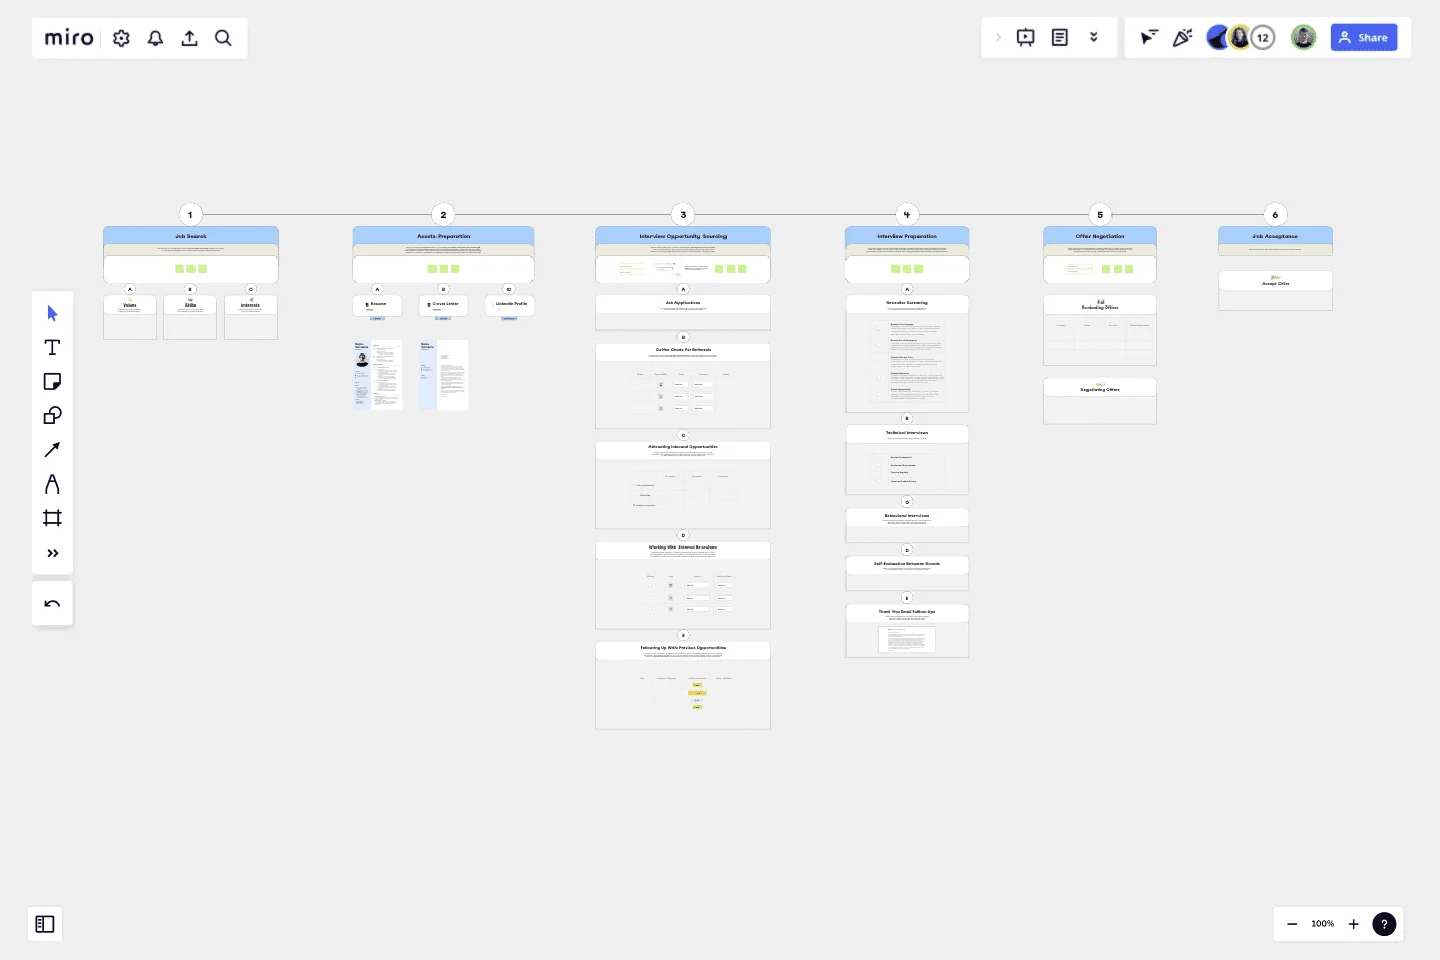
This template offers a structured approach to guide you through every step of the job search process, from initial exploration to final job acceptance. The Job Search Process Diagram features structured sections to help you articulate:
Job search strategy: Define your values, skills, and interests to craft a targeted job search strategy aligned with your career aspirations.
Asset preparation: Fine-tune essential documents such as your resume, cover letter, and LinkedIn profile to present yourself effectively to prospective employers.
Interview opportunity sourcing: Track leads, connections, and avenues for securing interviews to stay organized and proactive in pursuing opportunities.
Interview prep: Equip yourself with the skills and confidence needed to excel in interviews, ensuring a polished performance at every stage.
Offer negotiation: Evaluate and negotiate job offers effectively, considering various factors to secure favorable terms for employment agreements.
Job acceptance: Mark the milestone of job acceptance, celebrating your success as you transition into your new role.
With this template, you can:
Develop a focused and targeted job search strategy tailored to your career goals.
Present yourself effectively to prospective employers, maximizing your chances of securing interviews.
Navigate the interview process confidently and professionally, showcasing your skills and qualifications.
Negotiate job offers confidently, ensuring favorable terms for your employment agreements.
How to use the Job Search Process Diagram
Follow the steps below to get the most out of this template for your next career move:
Add the names of companies/opportunities as they move through the pipeline.
If an opportunity falls through at a certain stage in the process, move the company's name to the “Learning Opportunity” box.
Self-reflect or ask for feedback from your recruiter, and add notes about what you learned.
Include any other notes that you find helpful. For example, add any interview questions you couldn’t answer for future reference, interviewers' names to keep in touch with, etc.
Get started with this template right now.
Flow Diagrams
Works best for:
Diagramming
The Flow Diagrams template offers a versatile tool for visualizing processes, workflows, and systems. It provides a range of shapes and connectors for creating flowcharts, process maps, and data flow diagrams. This template enables teams to represent complex systems and processes in a clear and structured manner, facilitating communication and decision-making. By promoting visual clarity and understanding, Flow Diagrams empower teams to analyze and optimize processes effectively, driving efficiency and productivity.
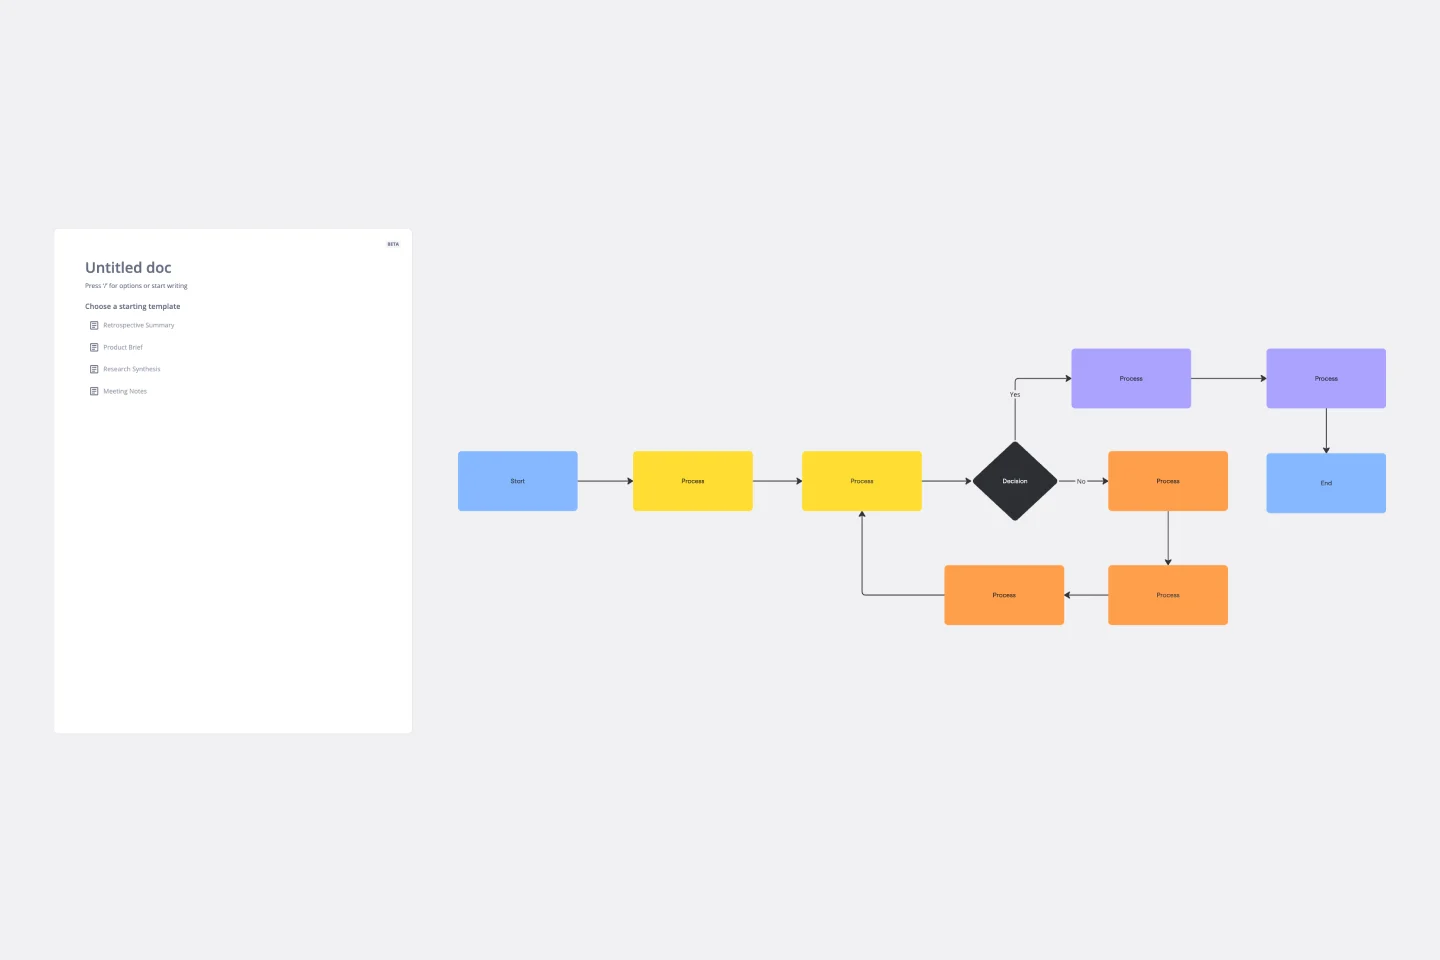
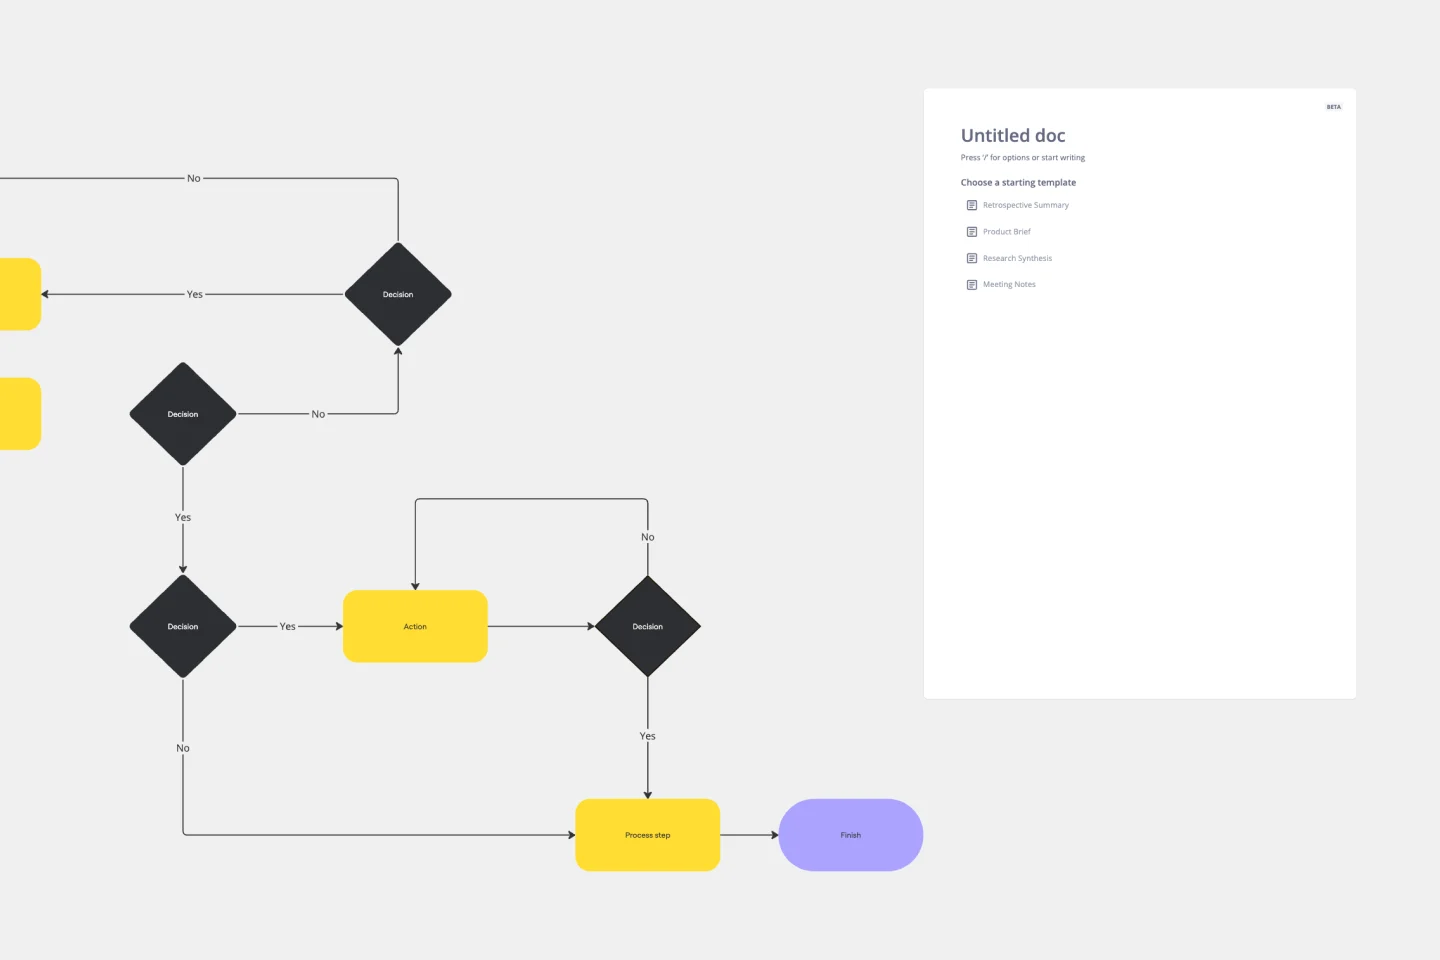
Flowchart Template
Works best for:
Flowcharts, Mapping, Diagrams
Trying to explain a process or workflow to your team — or just wrap your head around it yourself? Sometimes the best way is to see it, and that’s when you create a flowchart. Using common shapes (generally just ovals, rectangles, diamonds, and arrows), a flowchart shows you the direction a process or workflow goes and the order of steps. Beyond giving you a clear understanding, you’ll also be able to see potential flaws and bottlenecks, which helps you refine and improve your process and create a better product more efficiently.
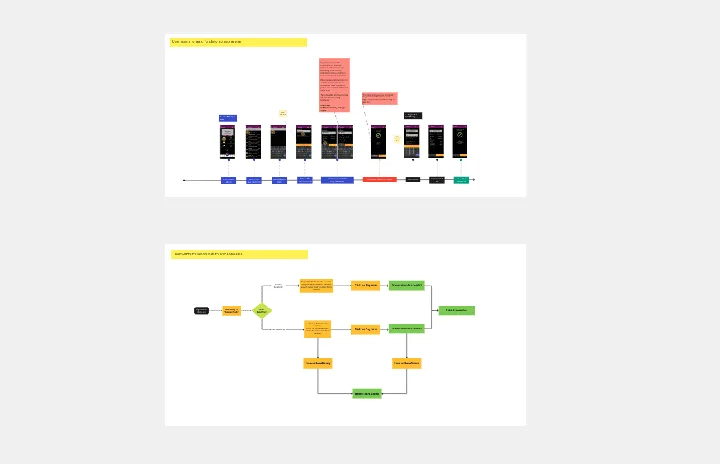
Bank Mobile App User Journey
Works best for:
Diagramming
The Bank Mobile App User Journey template offers a visual framework for mapping out the user experience journey within a banking mobile application. It provides elements for visualizing user interactions, touchpoints, and emotions throughout the journey. This template enables teams to understand user needs, pain points, and opportunities for improvement, facilitating the design of user-friendly and intuitive banking apps. By promoting empathy and user-centric design, the Bank Mobile App User Journey template empowers teams to create digital experiences that meet customer expectations and drive engagement.
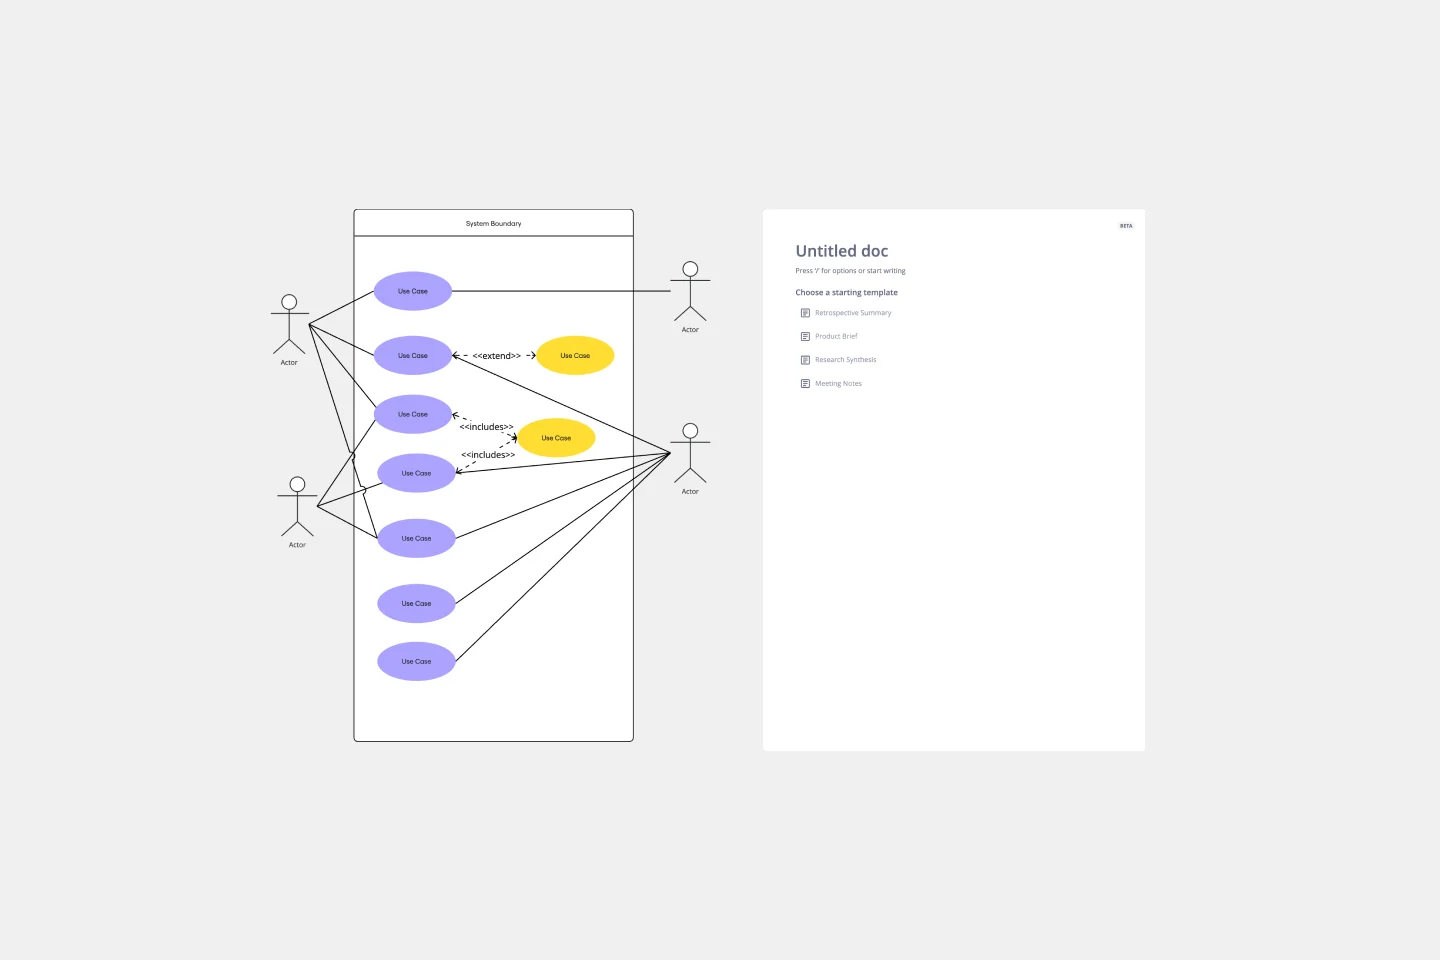
Use Case Diagram Template
Works best for:
Marketing, Market Research, Diagrams
A use case diagram is a visual tool that helps you analyze the relationships between personas and use cases. Use case diagrams typically depict the expected behavior of the system: what will happen and when. A use case diagram is helpful because it allows you to design a system from the perspective of the end user. It’s a valuable tool for communicating your desired system behavior in the language of the user, by specifying all externally visible system behavior.
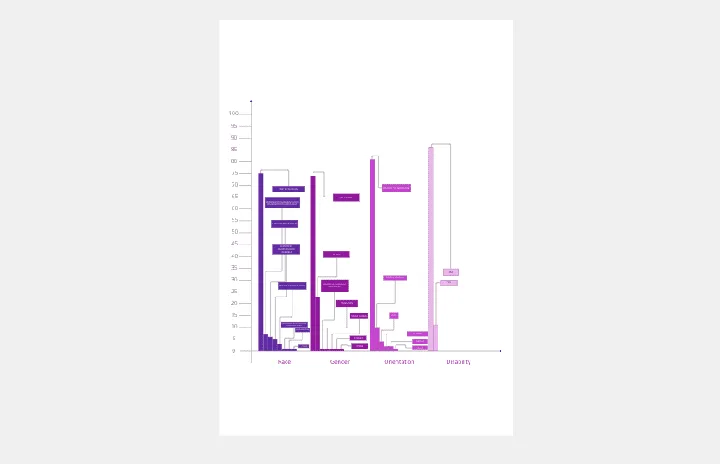
Bar Chart / Diagram Combined
Works best for:
Diagramming
The Bar Chart / Diagram Combined template offers a versatile tool for creating visualizations that combine bar charts with other diagrammatic elements. It provides elements for representing data trends, relationships, and comparisons effectively. This template enables teams to create customized visualizations that communicate complex information in a clear and compelling manner. By promoting visual clarity and insight, the Bar Chart / Diagram Combined template empowers teams to make data-driven decisions and communicate findings with impact.
Production Flowchart Template
Works best for:
Flowcharts
The Production Flowchart Template is a well-crafted tool that clearly represents a production process from start to finish. It breaks down complex procedures into easy-to-understand segments, making it easier for stakeholders to grasp the entire process. One of the key benefits of using this template is that it helps to clarify complex production pathways. By mapping out operations visually, teams can identify potential bottlenecks or inefficiencies, facilitating timely and well-informed decision-making.