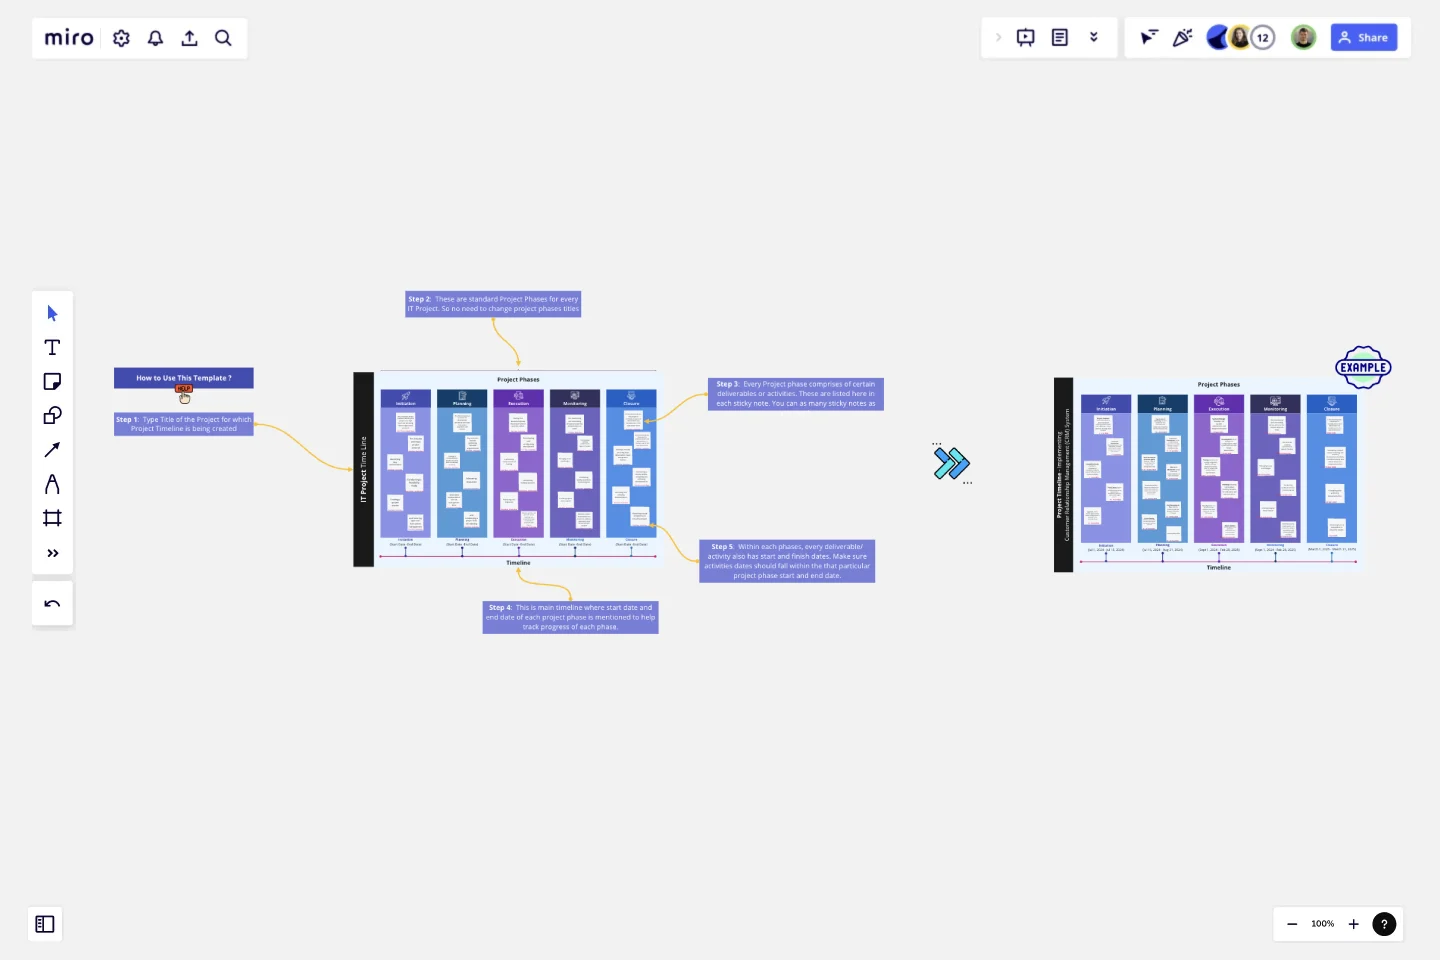
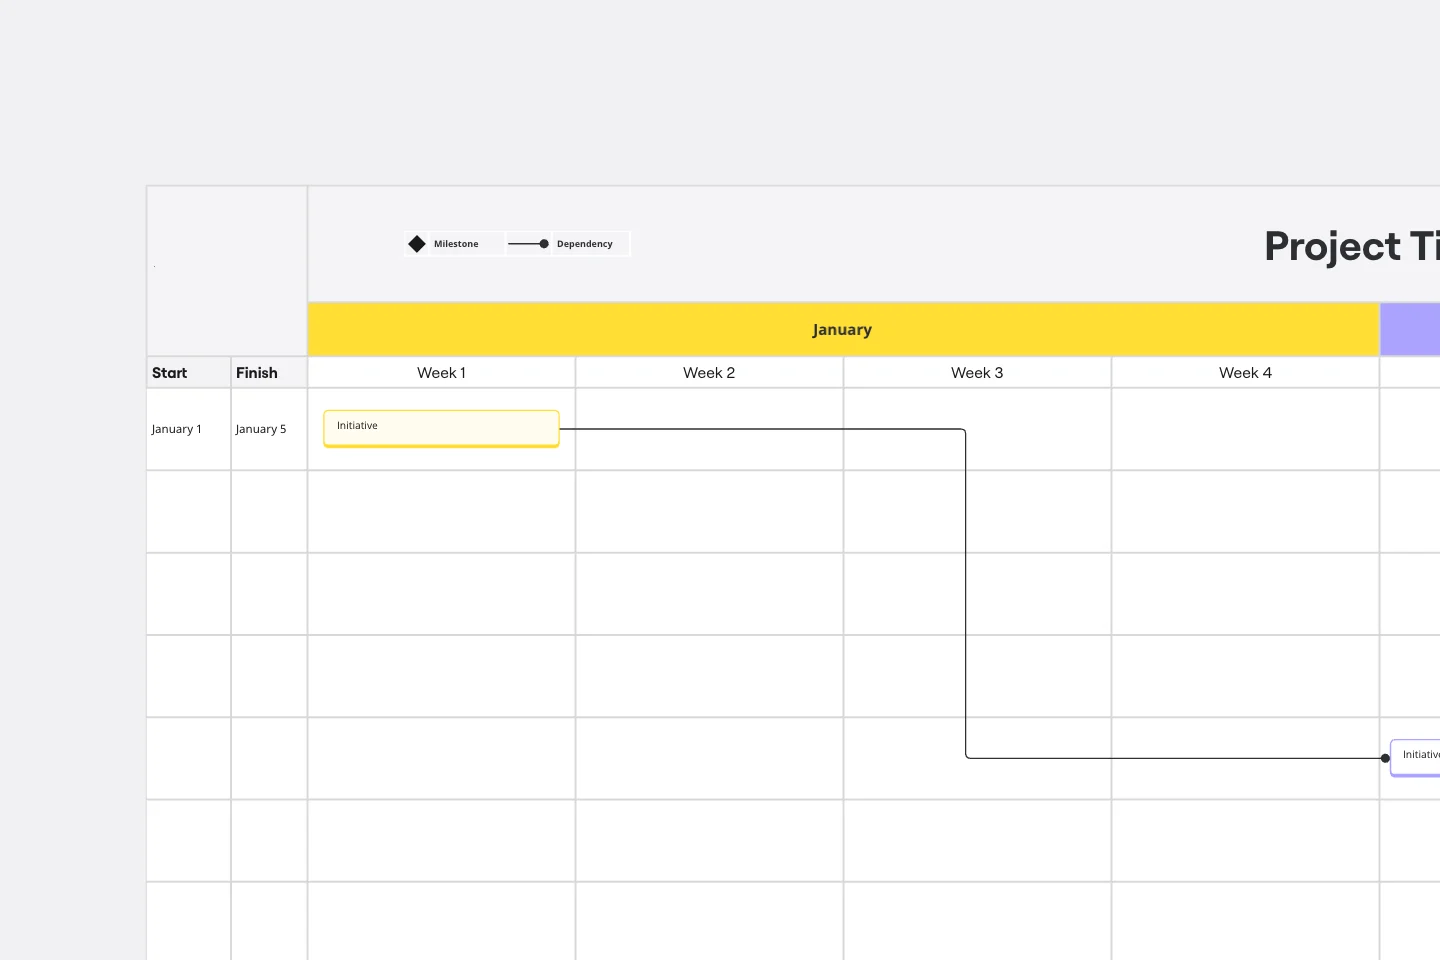
IT Project Time Line
This IT Project Timeline template is designed to help you manage and track your IT projects effectively through all stages of the project lifecycle.
Overview:
This IT Project Timeline template is designed to help you manage and track your IT projects effectively through all stages of the project lifecycle. It is structured around five key phases: Initiation, Planning, Execution, Monitoring, and Closure. To help you get started, the template includes a filled example for the implementation of a CRM system.
How to Use the Template
Start with the Example: Review the filled example of the CRM system implementation to understand how each phase and activity is mapped out.
Customize for Your Project: Replace the example content with details specific to your IT project. Adjust the activities, timelines, and resources according to your project’s needs.
Update Regularly: Keep the timeline updated with the latest progress and changes. Use the monitoring section to track performance and make adjustments as needed.
Communicate with Stakeholders: Use the template to provide regular updates to stakeholders, ensuring everyone is informed about the project’s status and any issues that arise.
This template is a comprehensive tool designed to guide you through the entire IT project lifecycle, ensuring that you can manage your project efficiently and effectively from start to finish.
Regards
Khawaja Rizwan
Get started with this template right now.
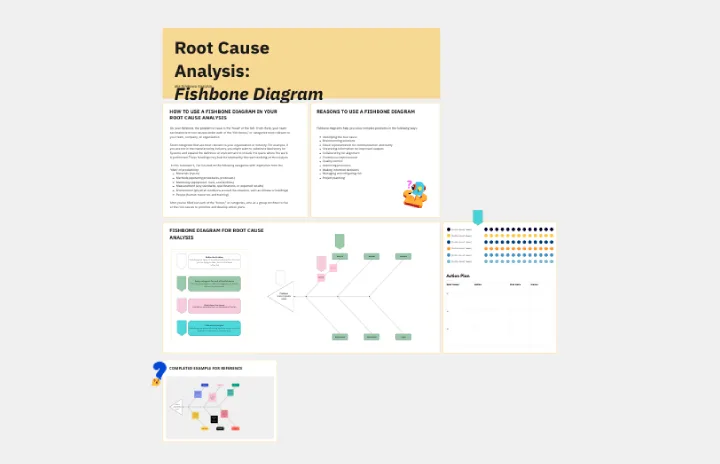
Fishbone RCA
Works best for:
Problem solving, Strategy
Use the Fishbone RCA template to conduct a thorough root cause analysis (RCA) for any problem. This template helps you break down complex issues into manageable categories, enabling you to identify the underlying causes. It's an effective tool for improving processes, solving problems, and preventing future issues.
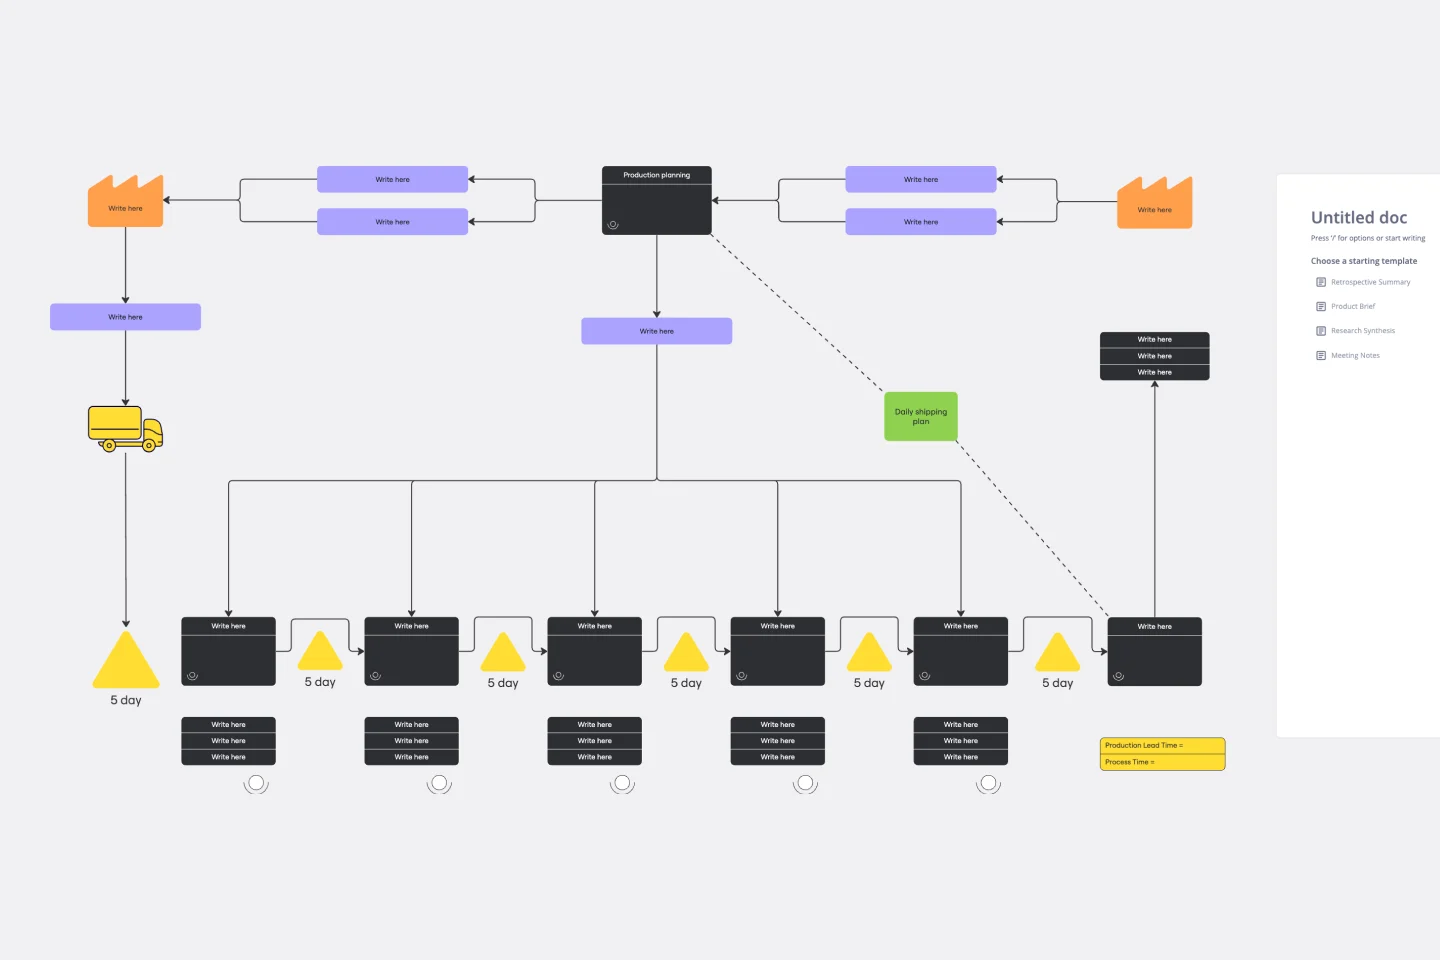
Value Stream Mapping Template
Works best for:
Project Management, Strategic Planning, Mapping
A value stream map can help you refocus your business on steps that actually provide value to your customers, cutting out wasteful and inefficient processes. With this template, you and your process team can collaborate on a value stream map today.

Inspired: Creating Products Customers Love
Works best for:
Product Management, Planning
Inspired: Creating Products Customers Love template guides product managers in developing innovative and customer-centric products. By emphasizing empathy, ideation, and validation, this template fosters a deep understanding of customer needs and preferences. With sections for brainstorming ideas, defining features, and validating concepts, it facilitates the creation of compelling products that resonate with target audiences. This template serves as a roadmap for delivering exceptional customer experiences and driving product success.
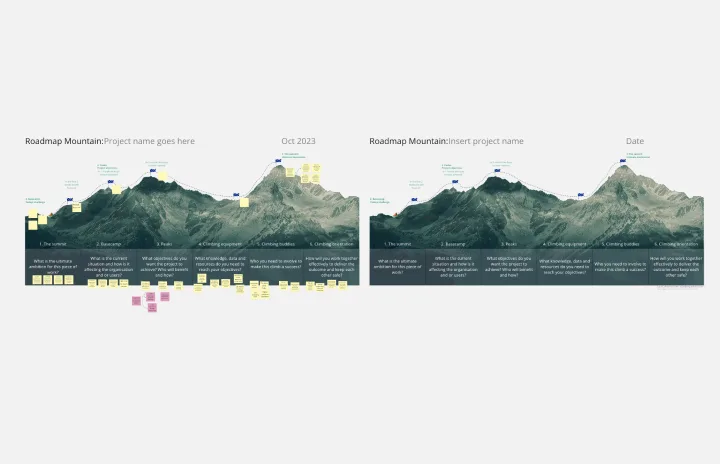
Roadmap Mountain
Works best for:
Roadmap, Planning, Mapping
The Roadmap Mountain template provides a metaphorical framework for planning and visualizing project objectives and milestones. By depicting the journey towards achieving goals as a mountain ascent, teams can inspire motivation and focus. This template encourages collaborative goal-setting and fosters a sense of accomplishment as teams progress towards their summit. With clear milestones in sight, teams can stay motivated and track their progress effectively.
Gantt Chart Template
Works best for:
Project Management, Mapping, Roadmaps
Simplicity, clarity, and power — that’s what make Gantt charts such a popular choice for organizing and displaying a project plan. Built upon a horizontal bar that represents the project progress over time, these charts break down projects by task, allowing the whole team to see the task status, who it’s assigned to, and how long it will take to complete. Gantt charts are also easily shareable among team members and stakeholders, making them great tools for collaboration.
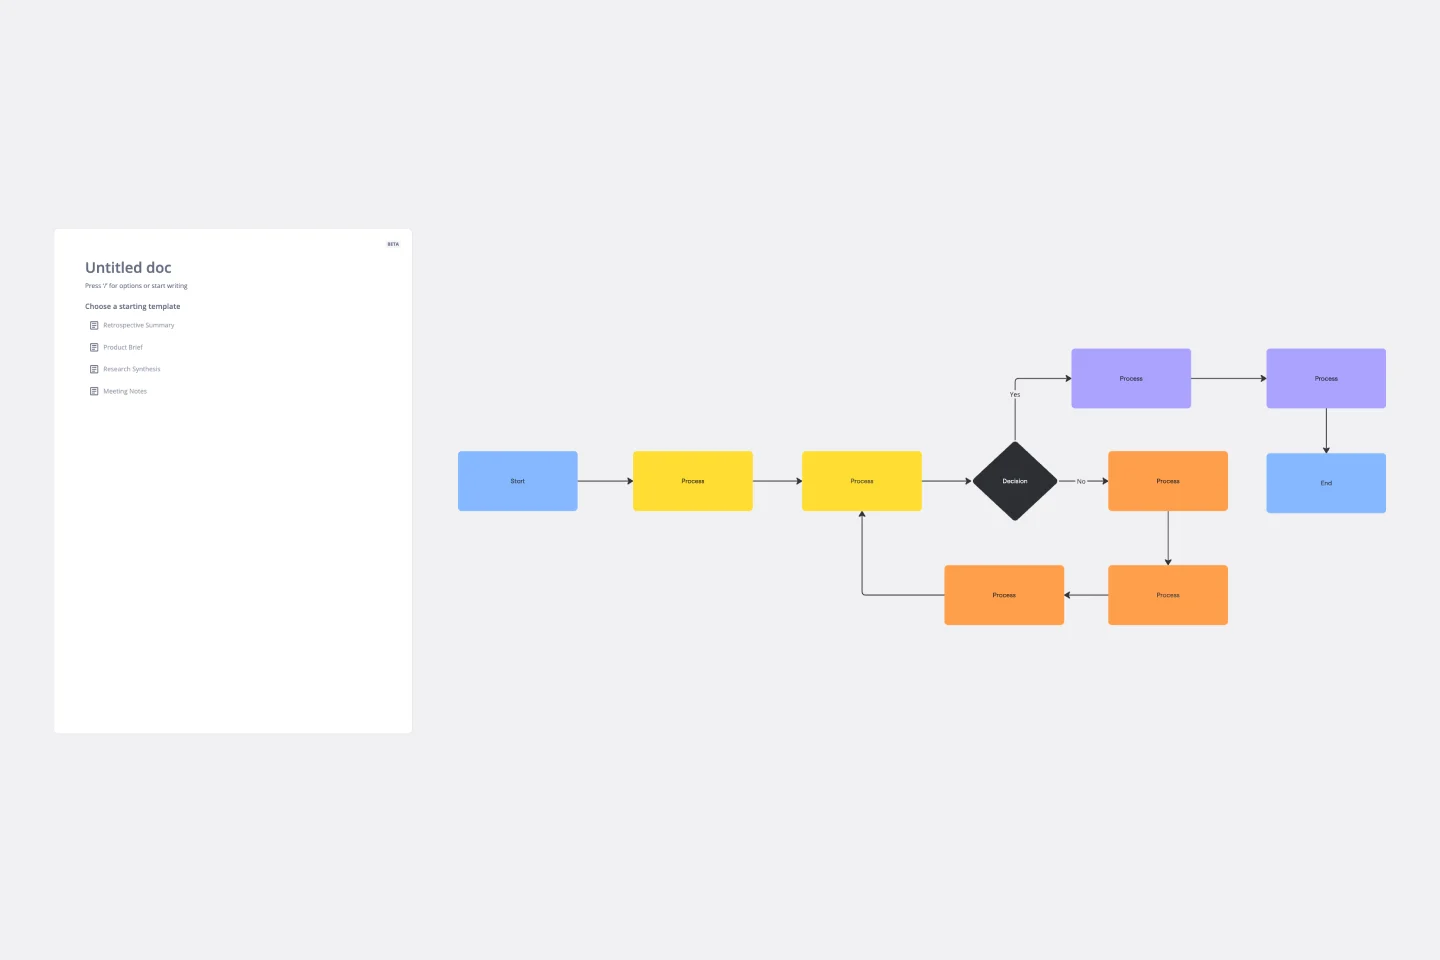
Flowchart Template
Works best for:
Flowcharts, Mapping, Diagrams
Trying to explain a process or workflow to your team — or just wrap your head around it yourself? Sometimes the best way is to see it, and that’s when you create a flowchart. Using common shapes (generally just ovals, rectangles, diamonds, and arrows), a flowchart shows you the direction a process or workflow goes and the order of steps. Beyond giving you a clear understanding, you’ll also be able to see potential flaws and bottlenecks, which helps you refine and improve your process and create a better product more efficiently.