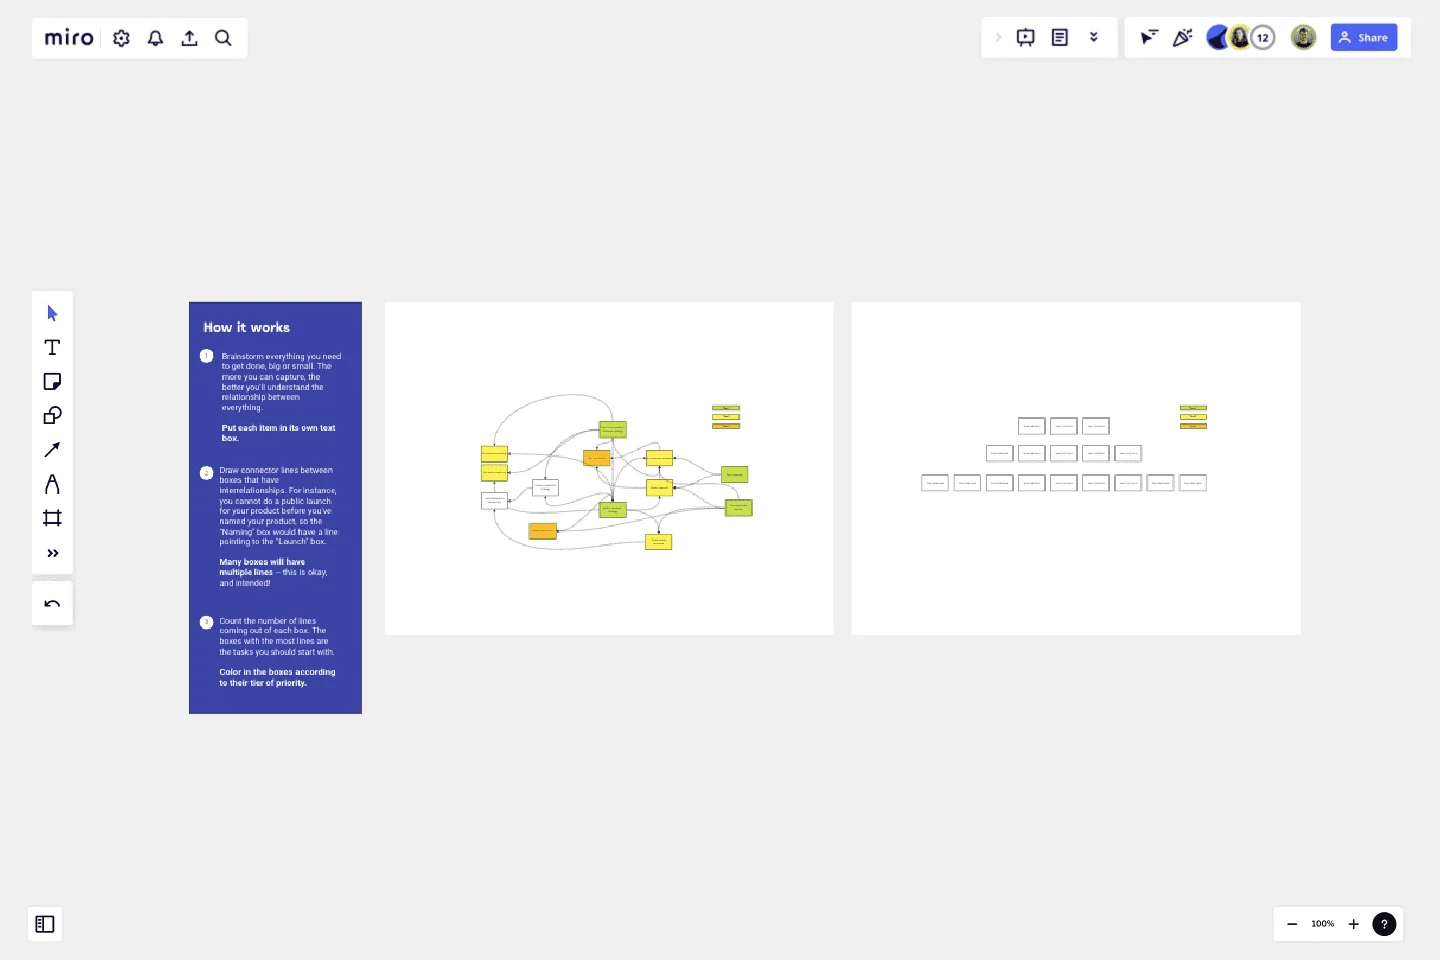
Interrelationship Diagram
Great for new projects, upcoming launches, brand-new businesses, and getting unstuck in general!
Great for new projects, upcoming launches, brand-new businesses, and getting unstuck in general!
This template is for anyone working through a complex project and struggling to understand where to begin. An interrelationship diagram will help you see how all your tasks relate to one another and where to prioritize your time first. By connecting the dots between tasks, you can see which ones are the most critical and interdependent.
Get started with this template right now.
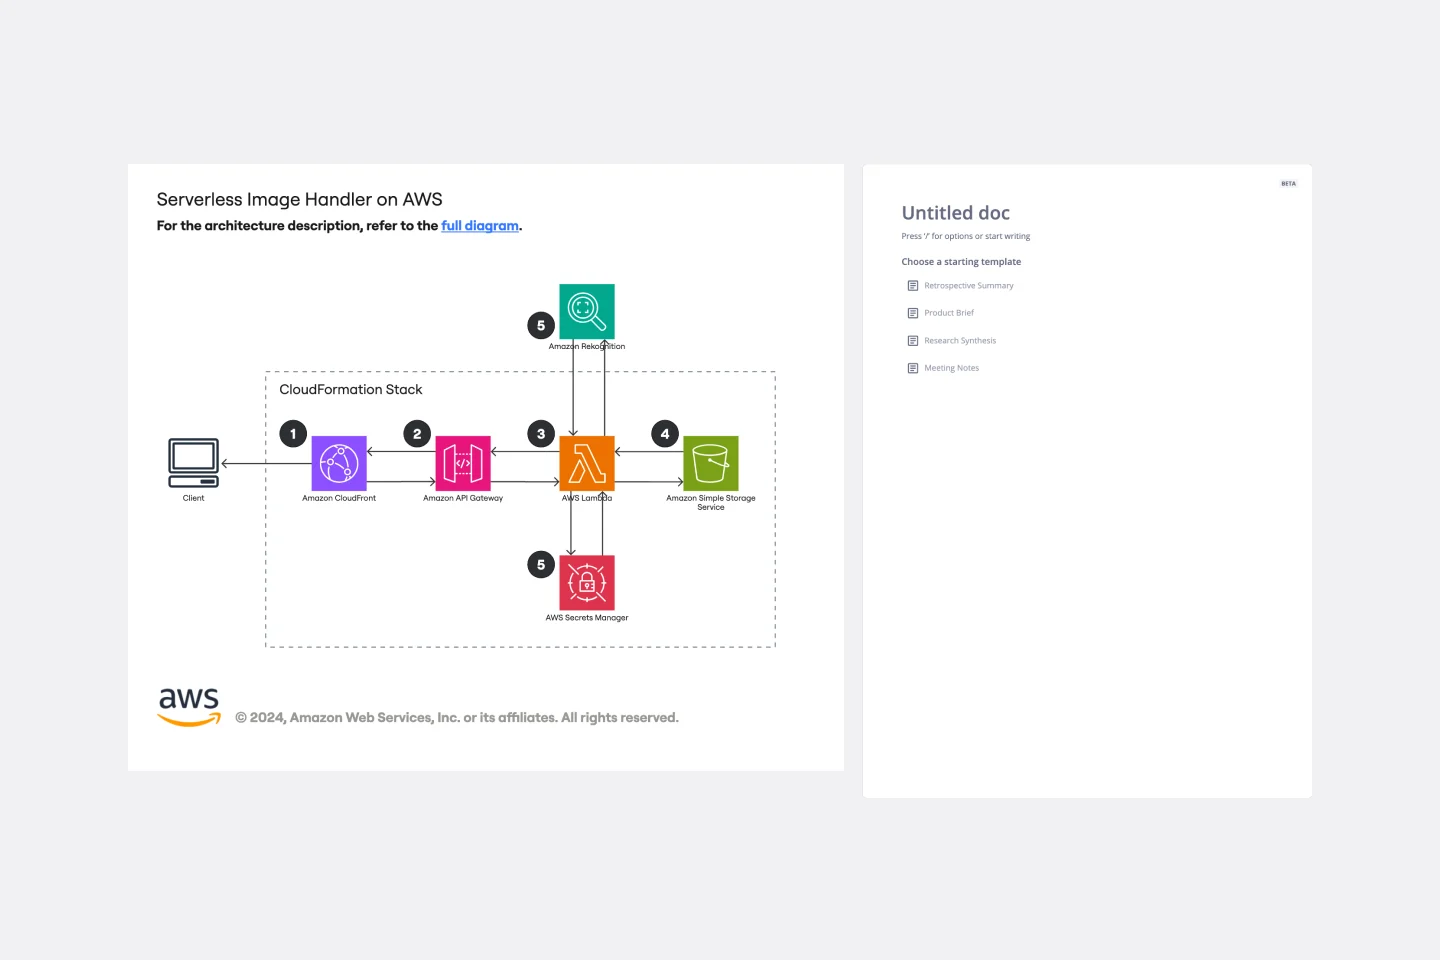
Serverless Image Handler on AWS Template
Works best for:
AWS
The Serverless Image Handler on AWS template is designed to facilitate the management and transformation of images in cloud-based projects without the need for server infrastructure management. It is particularly useful for applications and projects that require dynamic image management, offering benefits like efficiency, scalability, and seamless integration with AWS services. By incorporating this template into Miro boards or projects, teams can streamline their workflows, especially when dealing with digital assets or dynamic content, ensuring that their image-handling needs are met efficiently as they scale.
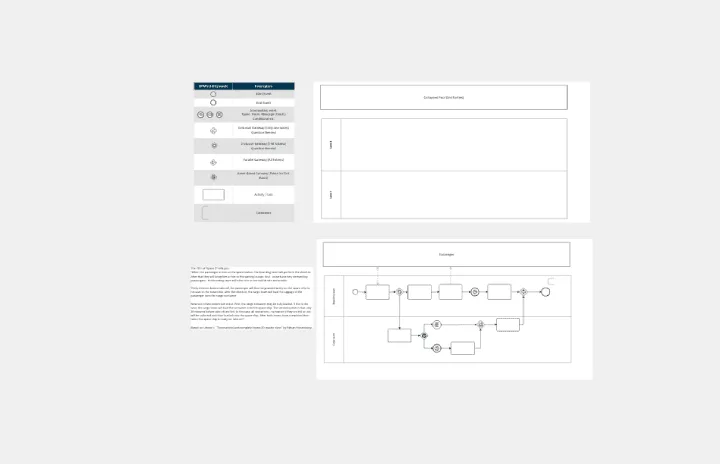
BPMN 2.0
Works best for:
Diagramming
The BPMN 2.0 template offers a visual notation for modeling business processes using the Business Process Model and Notation (BPMN) standard. It provides elements for defining process flows, activities, and decision points. This template enables teams to document and analyze business processes systematically, facilitating process optimization and automation. By promoting standardization and clarity in process modeling, the BPMN 2.0 template empowers organizations to improve efficiency, agility, and compliance in their operations.
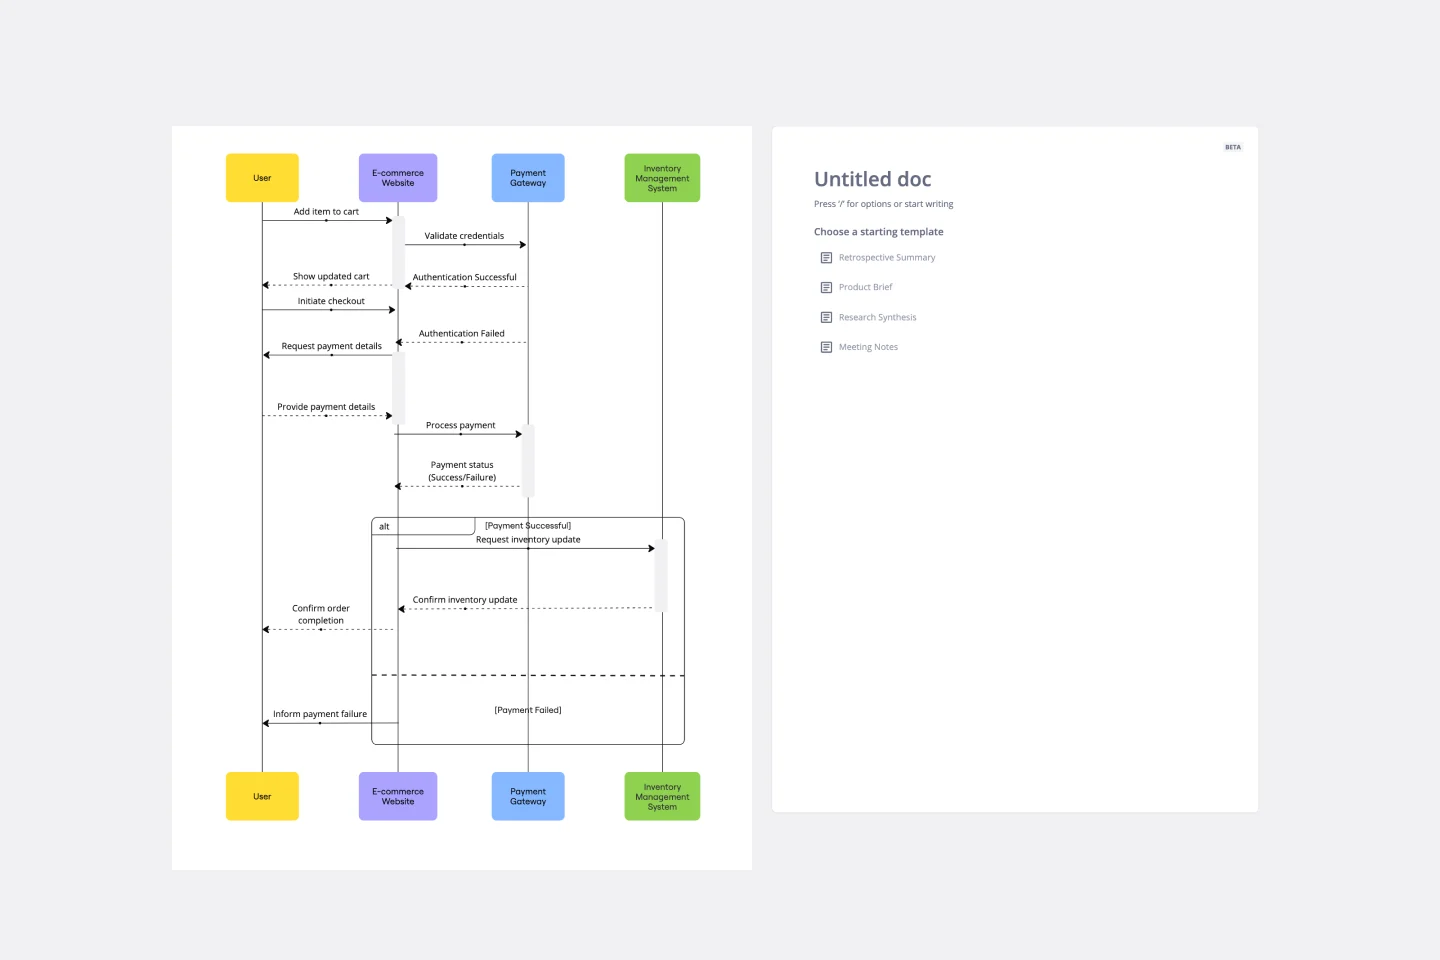
UML Sequence E-commerce Checkout Template
Works best for:
UML
The UML Sequence E-commerce Checkout Template in Miro is a versatile tool for visualizing and analyzing e-commerce checkout processes. It provides a step-by-step visual representation of system interactions, is highly customizable, supports real-time collaboration, and is suitable for various e-commerce platforms. It serves as an efficient documentation tool, fosters team collaboration, and contributes to a more streamlined checkout experience for customers.
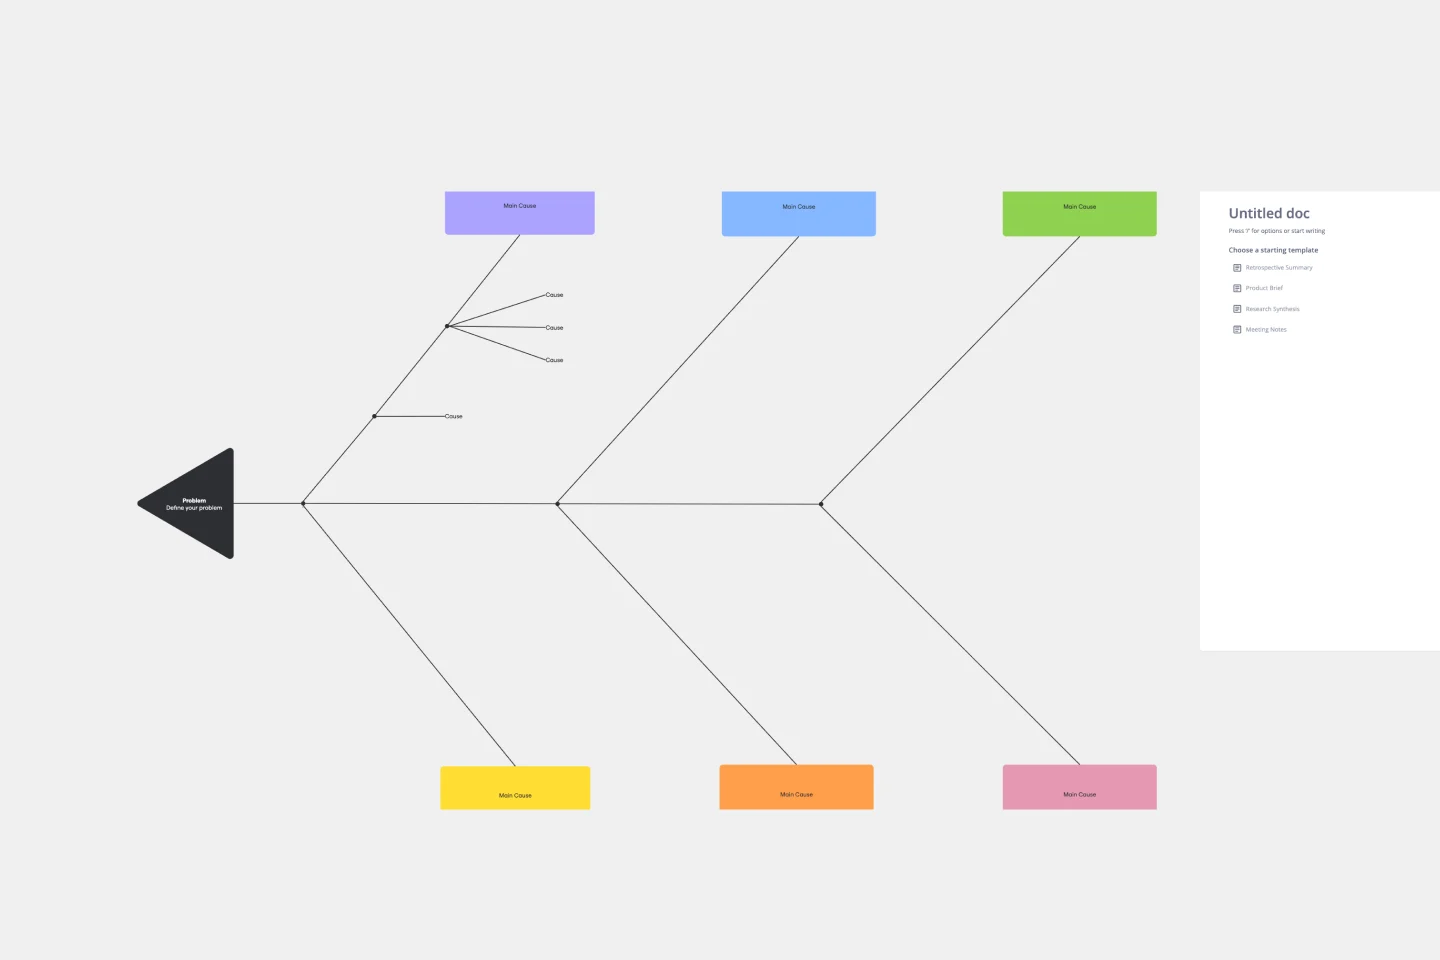
Cause and Effect Diagram Template
Works best for:
Diagramming
The Cause and Effect Diagram Template is a useful tool for analyzing complex relationships, identifying root causes of problems, and improving organizational processes. It can be customized to fit user's unique needs and provides a structured framework for analysis. Teams can use real-time collaborative analysis on the Miro platform to drive continuous improvement initiatives.
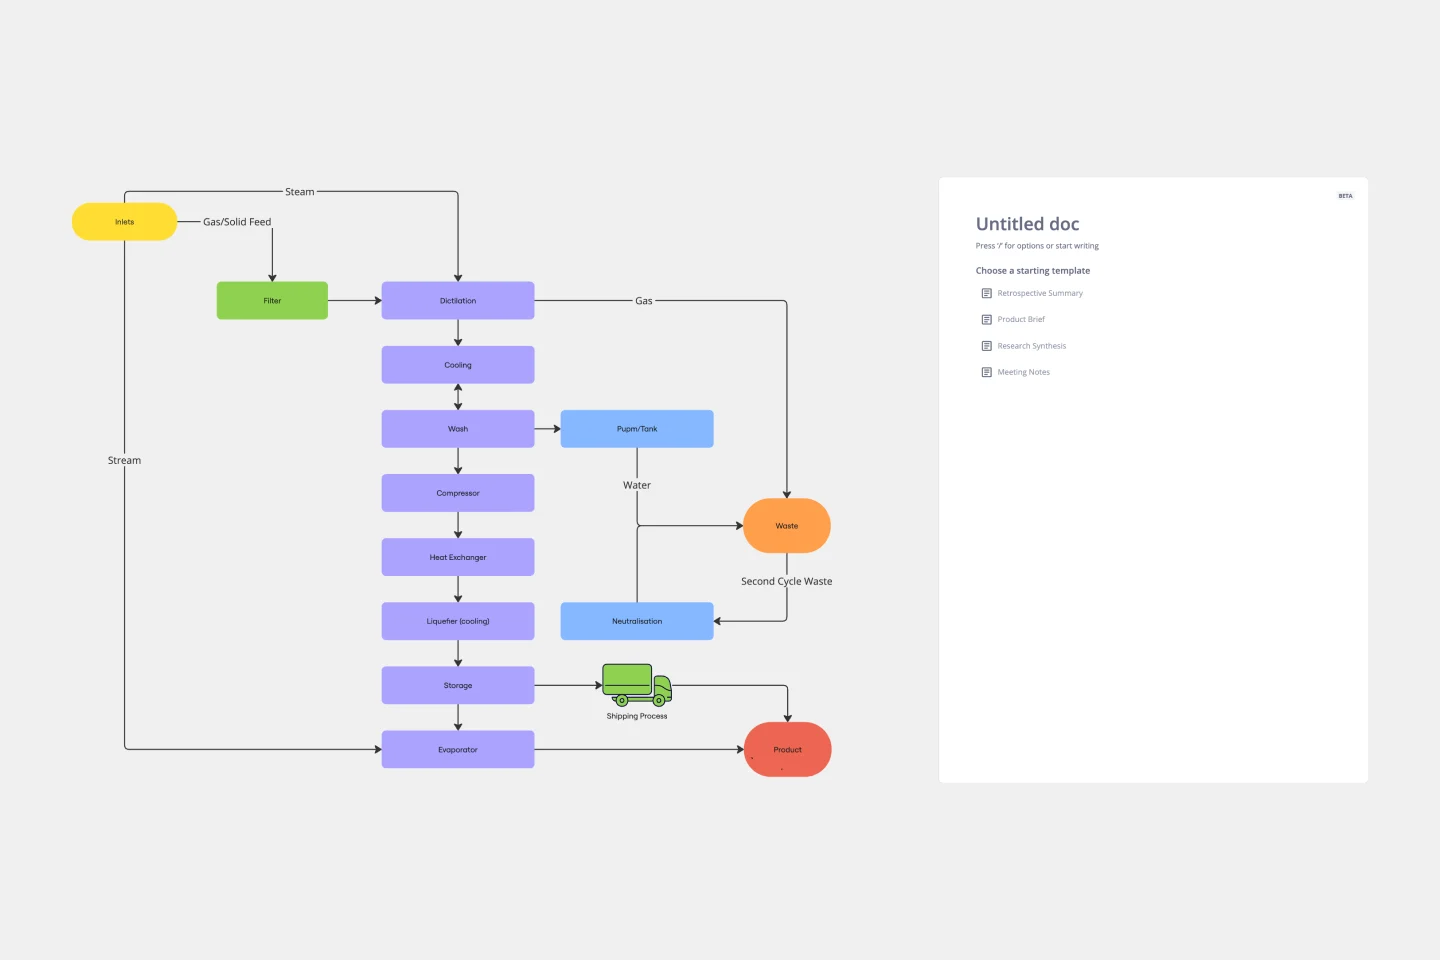
Block Diagram Template
Works best for:
Mapping, Software Development, Diagrams
Use this template to illustrate technical systems. Blocks represent important objects in the system, and arrows demonstrate how the objects relate to each other. Perfect for engineers, workflow managers, or anyone trying to build a better process.
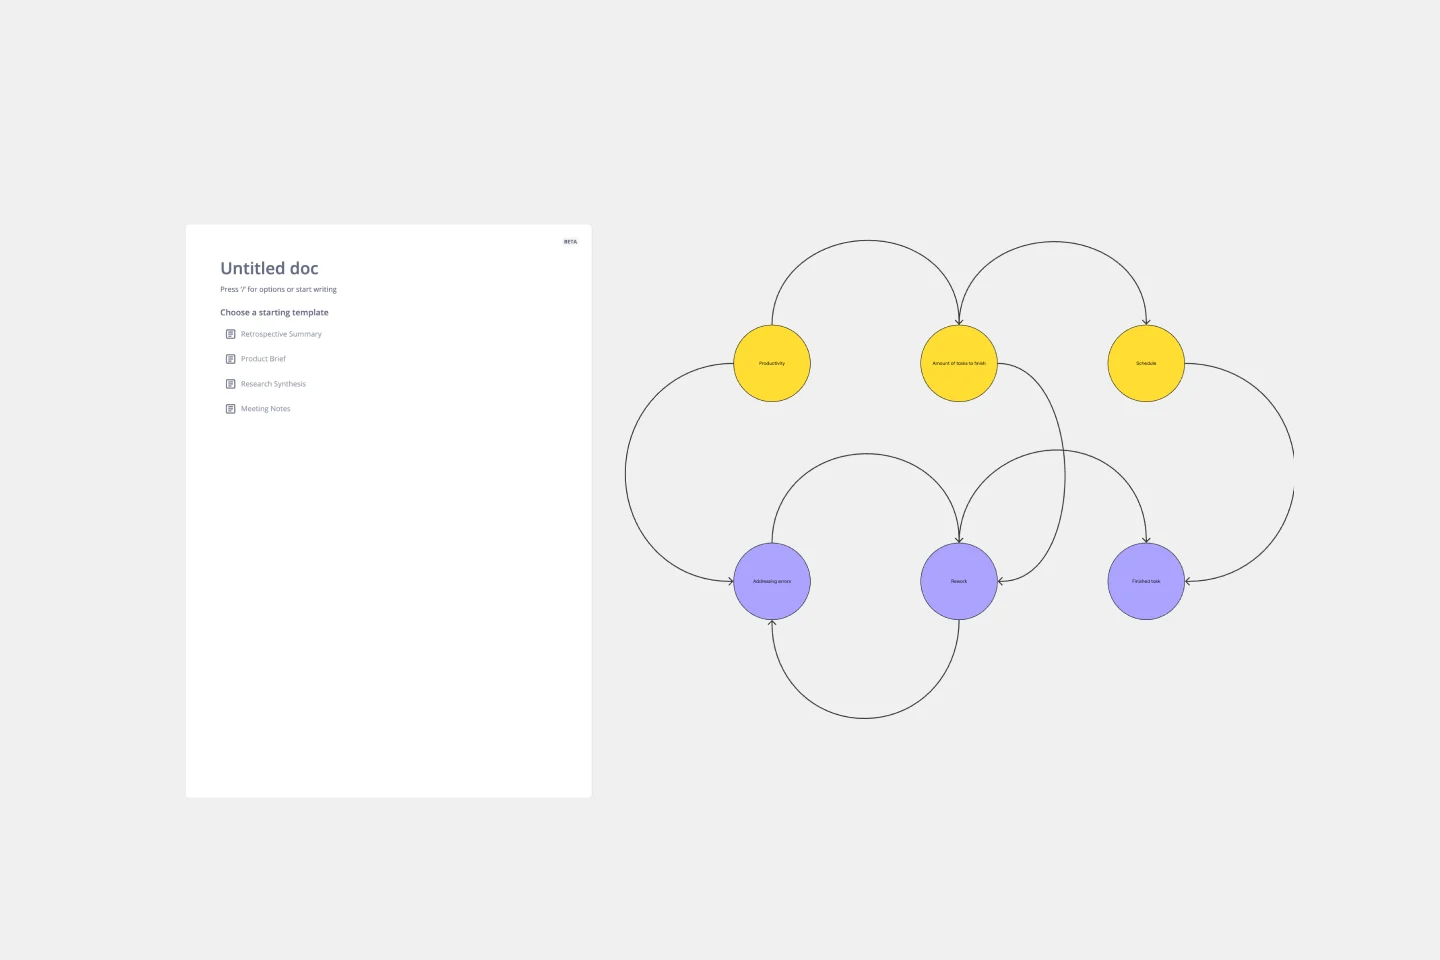
Causal Loop Diagram Template
Works best for:
Diagramming
The Causal Loop Diagram Template offers a structured framework to visualize the intricate interconnections within any system. Its standout benefit is the ability to provide a holistic perspective, ensuring that users don't just see isolated issues but understand the entire web of relationships, ultimately leading to more informed and strategic decision-making.