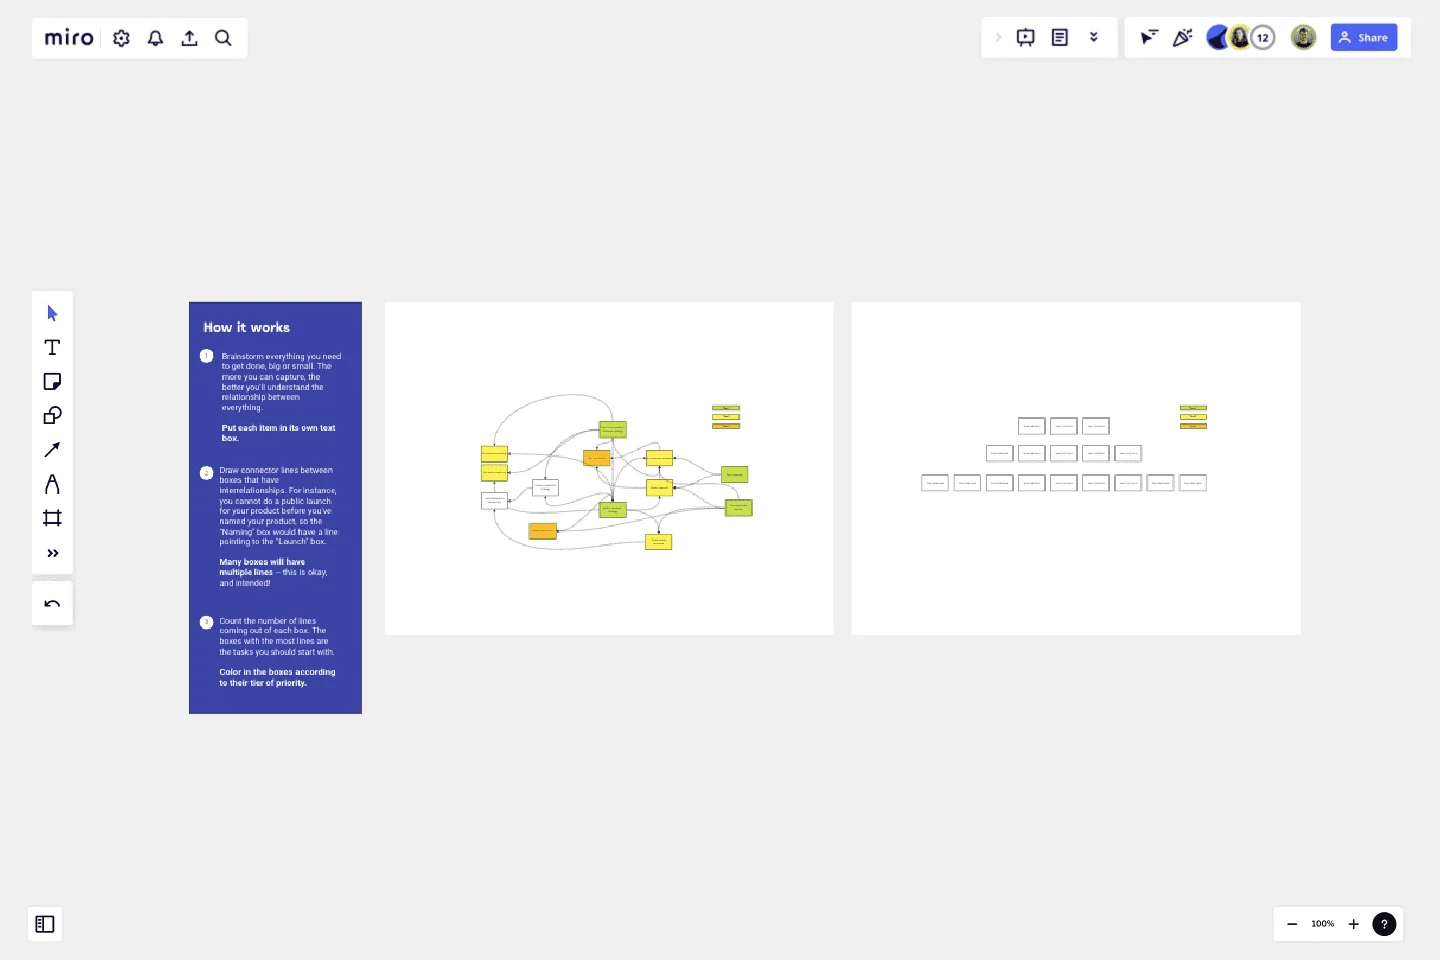
Interrelationship Diagram
Great for new projects, upcoming launches, brand-new businesses, and getting unstuck in general!
Great for new projects, upcoming launches, brand-new businesses, and getting unstuck in general!
This template is for anyone working through a complex project and struggling to understand where to begin. An interrelationship diagram will help you see how all your tasks relate to one another and where to prioritize your time first. By connecting the dots between tasks, you can see which ones are the most critical and interdependent.
Get started with this template right now.
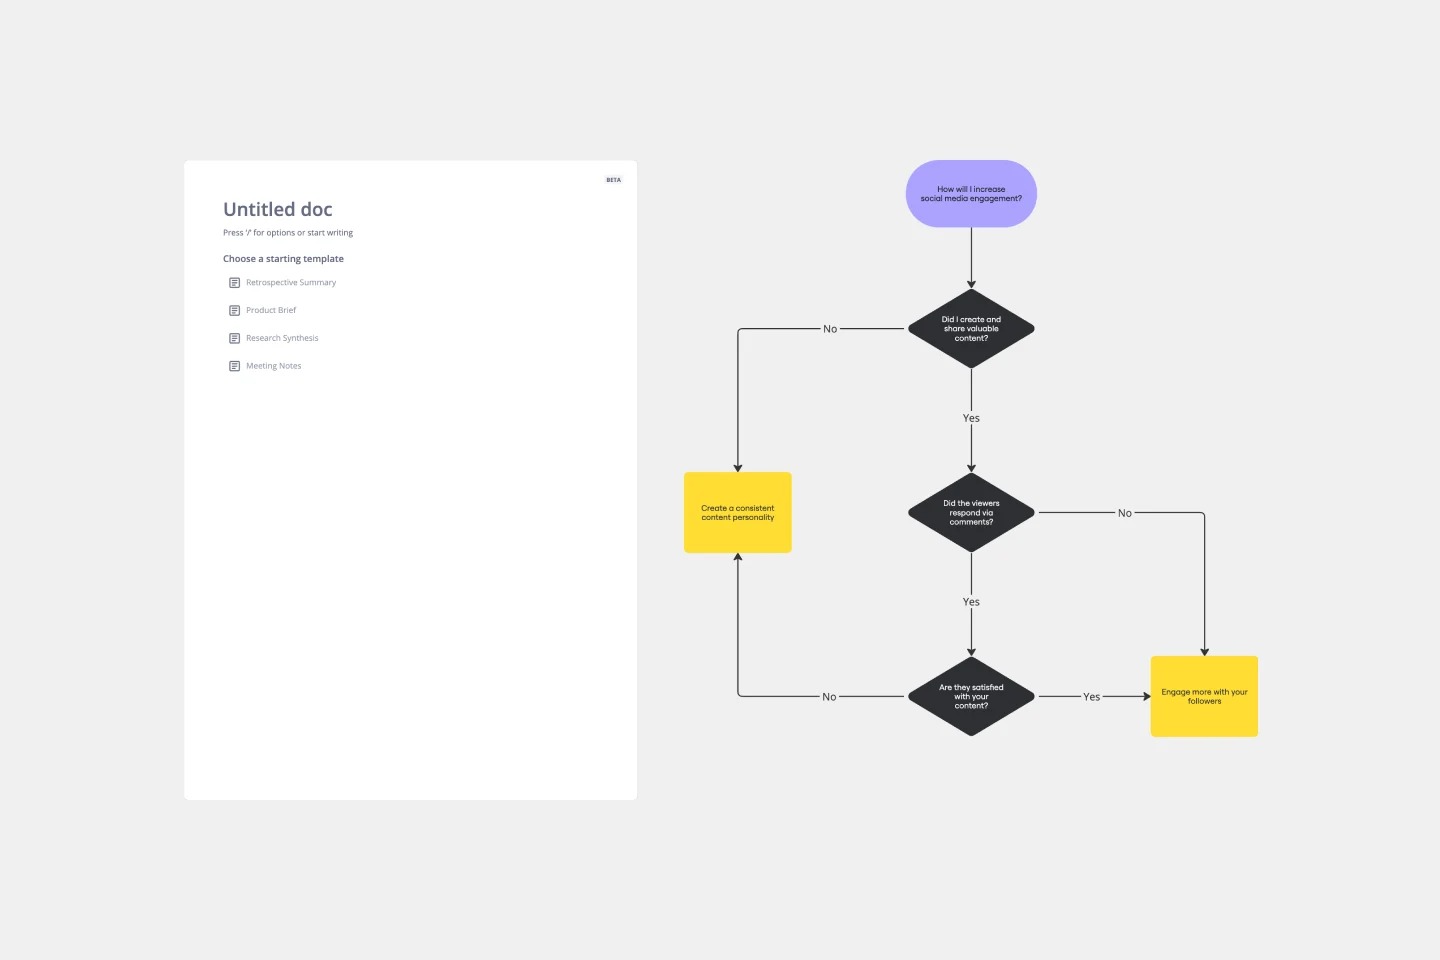
Yes No Flowchart Template
Works best for:
Diagramming
The Yes-No Flowchart Template is a simple and efficient tool that helps to simplify complex decision-making processes into clear and easy-to-follow steps. This template uses standard shapes to illustrate processes, decisions, and outcomes, with arrows that guide users from one action point to the next based on binary 'yes' or 'no' decisions. Its most prominent benefit is its ability to bring clarity to decision-making. By presenting processes visually, teams can effortlessly understand and navigate complex scenarios, ensuring that each step is transparent and reducing the potential for misunderstandings or missteps.
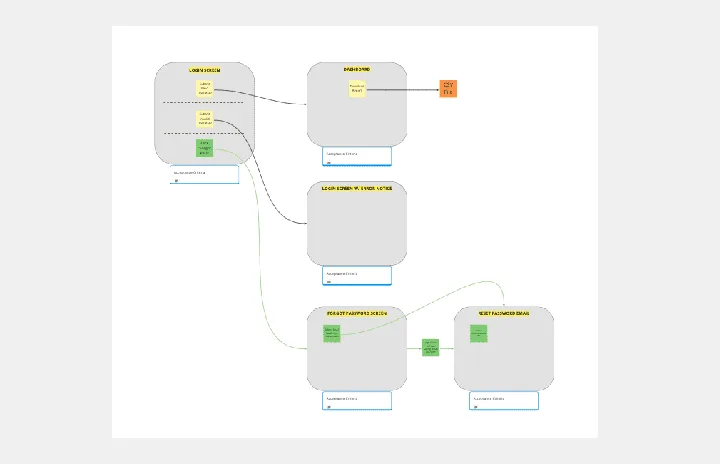
Breadboard (UI Flow Diagram)
Works best for:
Diagramming
The Breadboard (UI Flow Diagram) template offers a visual framework for designing and prototyping user interfaces (UIs) using the breadboard method. It provides elements for arranging UI components and defining user interactions. This template enables designers and developers to create interactive UI prototypes quickly and iteratively, facilitating user testing and feedback. By promoting rapid prototyping and experimentation, the Breadboard (UI Flow Diagram) empowers teams to design intuitive and user-friendly digital experiences effectively.
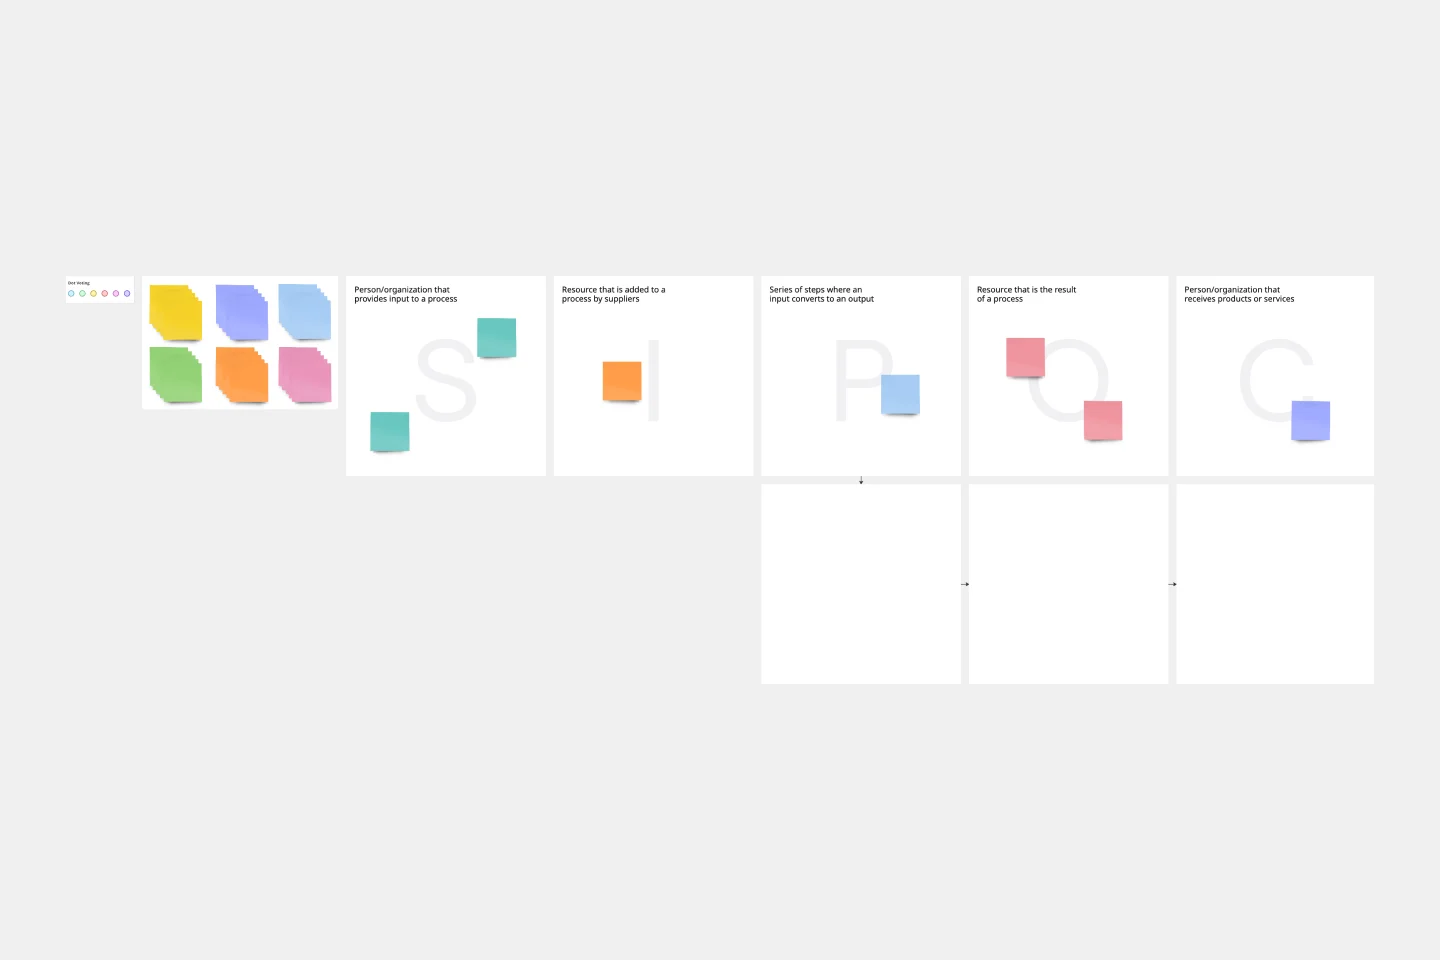
SIPOC Template
Works best for:
Agile Methodology, Strategic Planning, Mapping
A SIPOC diagram maps a process at a high level by identifying the potential gaps between suppliers and input specifications and between customers and output specifications. SIPOC identifies feedback and feed-forward loops between customers, suppliers, and the processes and jump-starts the team to think in terms of cause and effect.
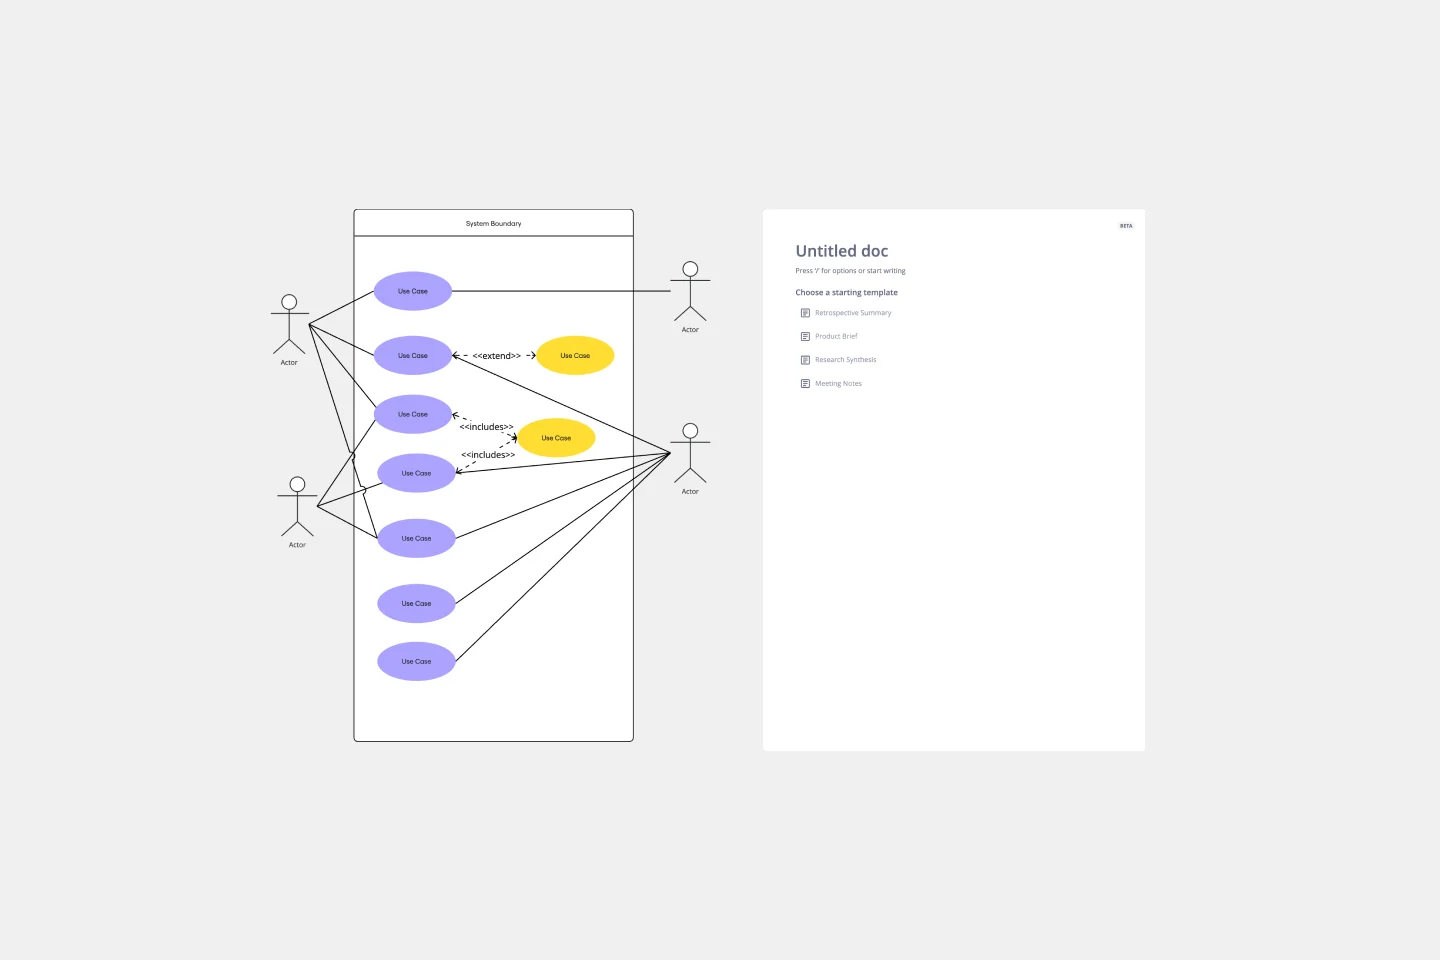
Use Case Diagram Template
Works best for:
Marketing, Market Research, Diagrams
A use case diagram is a visual tool that helps you analyze the relationships between personas and use cases. Use case diagrams typically depict the expected behavior of the system: what will happen and when. A use case diagram is helpful because it allows you to design a system from the perspective of the end user. It’s a valuable tool for communicating your desired system behavior in the language of the user, by specifying all externally visible system behavior.
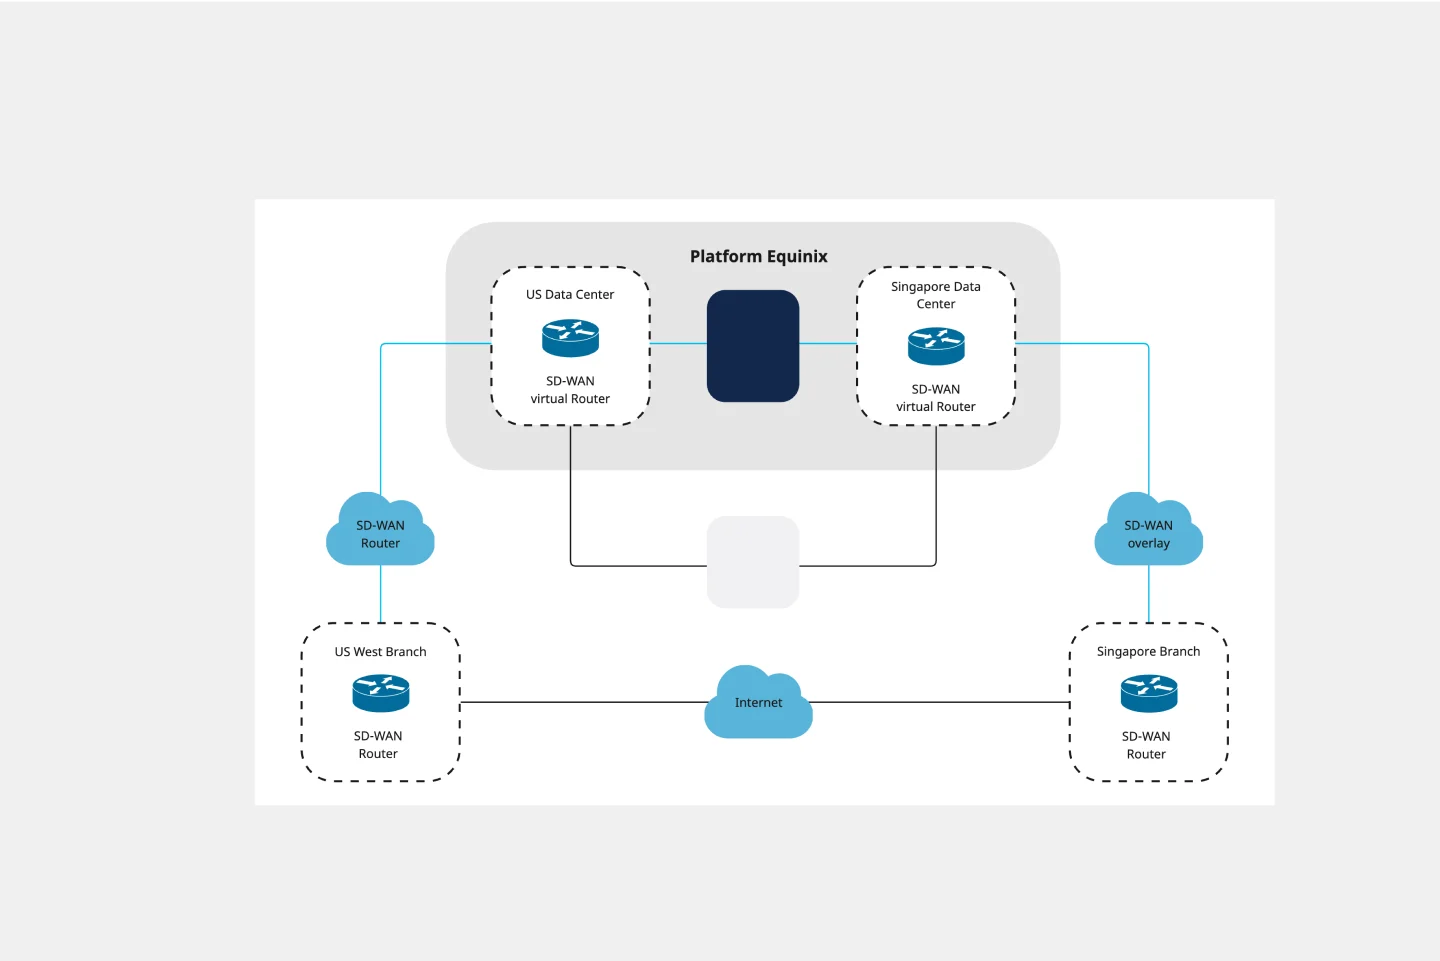
Cisco Data Network Diagram Template
Works best for:
Software Development
Cisco offers data center and access networking solutions built for scale with industry-leading automation, programmability, and real-time visibility. The Cisco Data Network Diagram uses Cisco elements to show the network design of Cisco Data Networks visually.
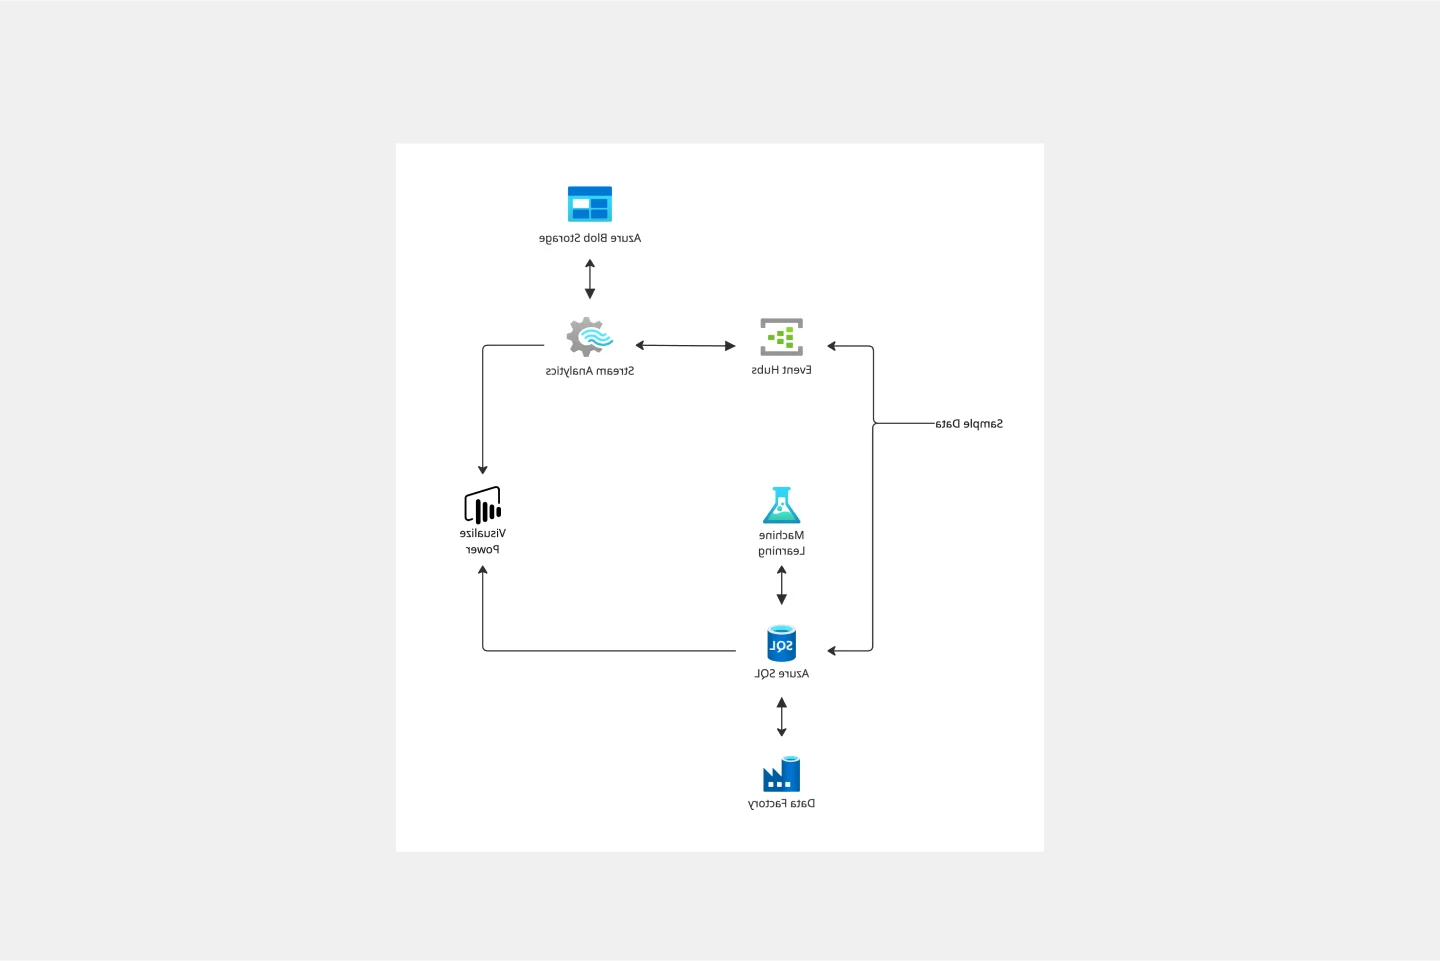
Azure Demand Forecasting Template
Works best for:
Software Development, Diagrams
The Azure Demand Forecasting diagram will show the architecture of a demand forecast, making it easier for you to predict data consumption, costs, and forecast results. Azure is Microsoft’s cloud computing platform, designed to provide cloud-based services such as remote storage, database hosting, and centralized account management. Azure also offers new capabilities like AI and the Internet of Things (IoT).