Impact Mapping Template
Set business goals and outline how to achieve them.
About the Impact Mapping template
What is Impact Mapping?
Impact mapping is a strategic planning technique. It allows organizations to stay on track while building products and shipping goods and services. An impact map is a graphical representation of your goals and the steps you must take to deliver on them. By creating an impact map, you can clearly communicate with your teammates, align on business objectives, and build better roadmaps.
When building products or working on projects, it can be easy to lose sight of your role within the broader organization. But your projects have a dynamic relationship with everything else in the organization, including other projects, teams, products, and functions. Many planning techniques lack this big-picture view. Impact maps, by contrast, help you visualize the relationship between your project roadmaps and the rest of your organization. You can therefore capture key assumptions and scope so you can deliver solutions without waste or over-engineering.
When should you use Impact Mapping?
You can use Impact Mapping to help you decide what should be in a product, prove to a client that it’s not worth investing in a particular feature and plan your next sprint or release. You can also use Impact Mapping for any type of project planning.
What are the key steps of Impact Mapping?
Impact Mapping is generally broken into 4 key steps: setting and describing business goals, identifying the personas, defining the actions these personas will take, and brainstorming the deliverables that will prompt these actions to take place.
How do you create an Impact Map?
Creating an impact map is simple and easy to do if you follow these steps. You can use our Impact Mapping Template and discuss everything with your team in real-time using Miro’s virtual collaboration platform.
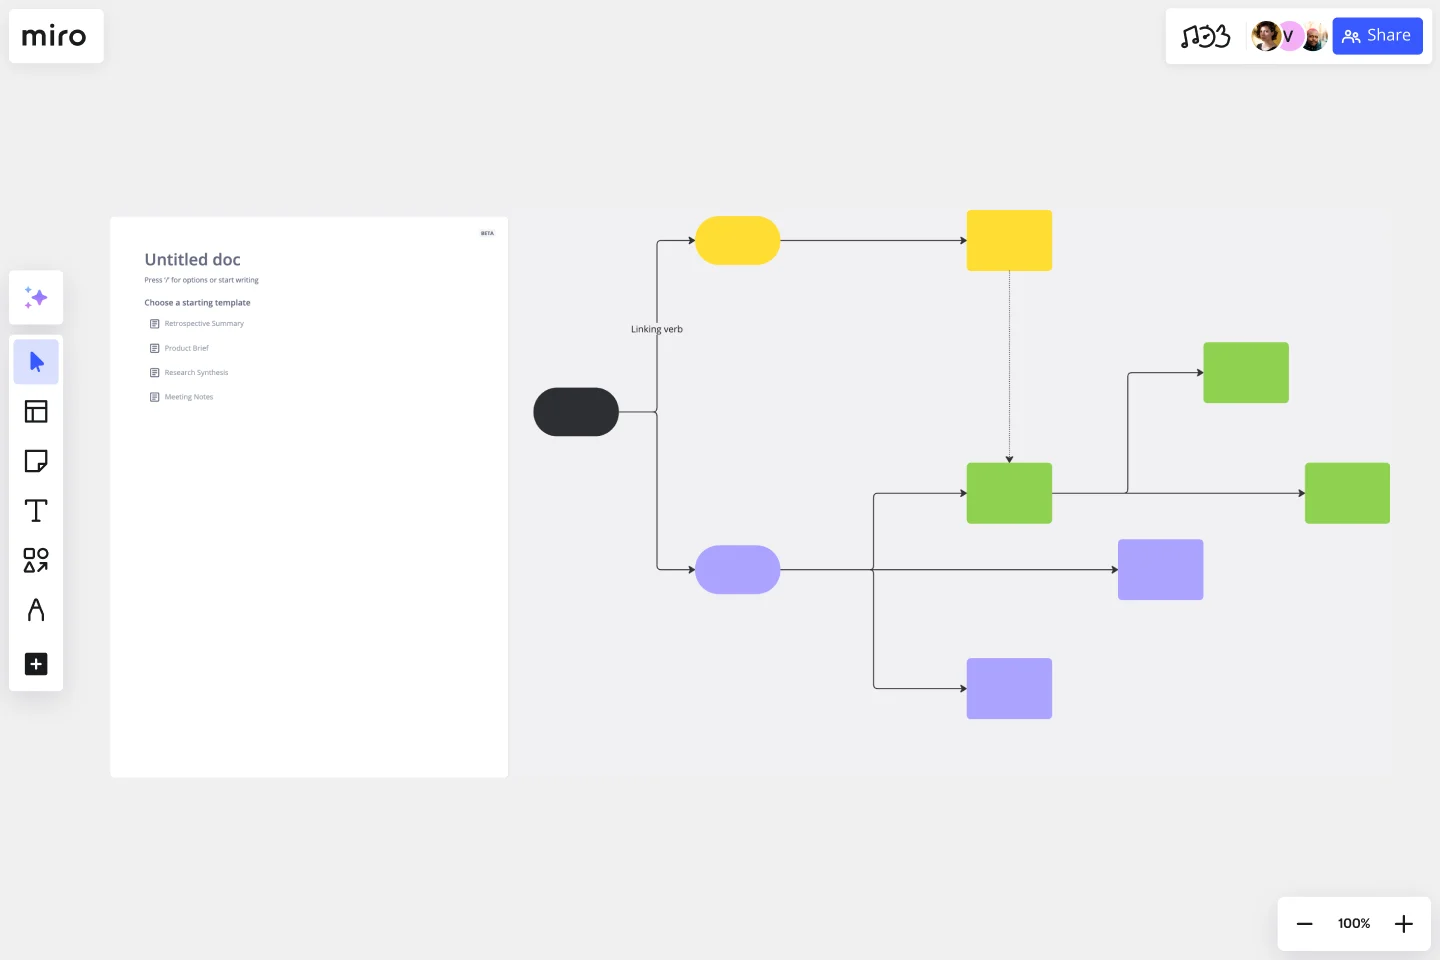
Step 1: Decide on your goals
Start by drawing a box that contains your goal. Why are we doing this project? What do we hope to achieve?
Step 2: Identify the actors
Draw a branch that links your goal to your next box: the actors. Who can produce the effect we’re looking for? Who can obstruct who? Who are our customers or users? Who will be impacted by our goal? Many people choose to have a box for each actor. Connect each box to your goal.
Step 3: Determine the impacts or actions
The second branch brings the impact of your goal into sharper focus. How should our actors’ behavior change as a result of this goal? How can they help us achieve our goal? How might they prevent us from achieving our goal? Draw a box for each potential impact and connect them to your actors.
Step 4: Define the deliverables
Once you have answered those questions, you can start thinking about the scope of your project. The third branch of the map deals with deliverables. What can we do to increase the likelihood that this goal will be achieved? How do we support the desired impact? These are your deliverables -- what you can hope to achieve within the scope of this project.
Get started with this template right now.
Scenario Mapping Template
Works best for:
Desk Research, Mapping, Product Management
Scenario mapping is the process of outlining all the steps a user will take to complete a task. The scenario mapping template helps you create a visual guide to what different personas are doing, thinking, and feeling in different situations. Use scenario mapping to outline an intended or ideal scenario (what should happen) as well as what currently happens. If you’re trying to outline the ideal scenario, user mapping should take place very early on in a project and can help inform user stories and the product backlog. If you’re just trying to get a better sense of what currently happens, you can do user mapping when conducting user interviews or observation.
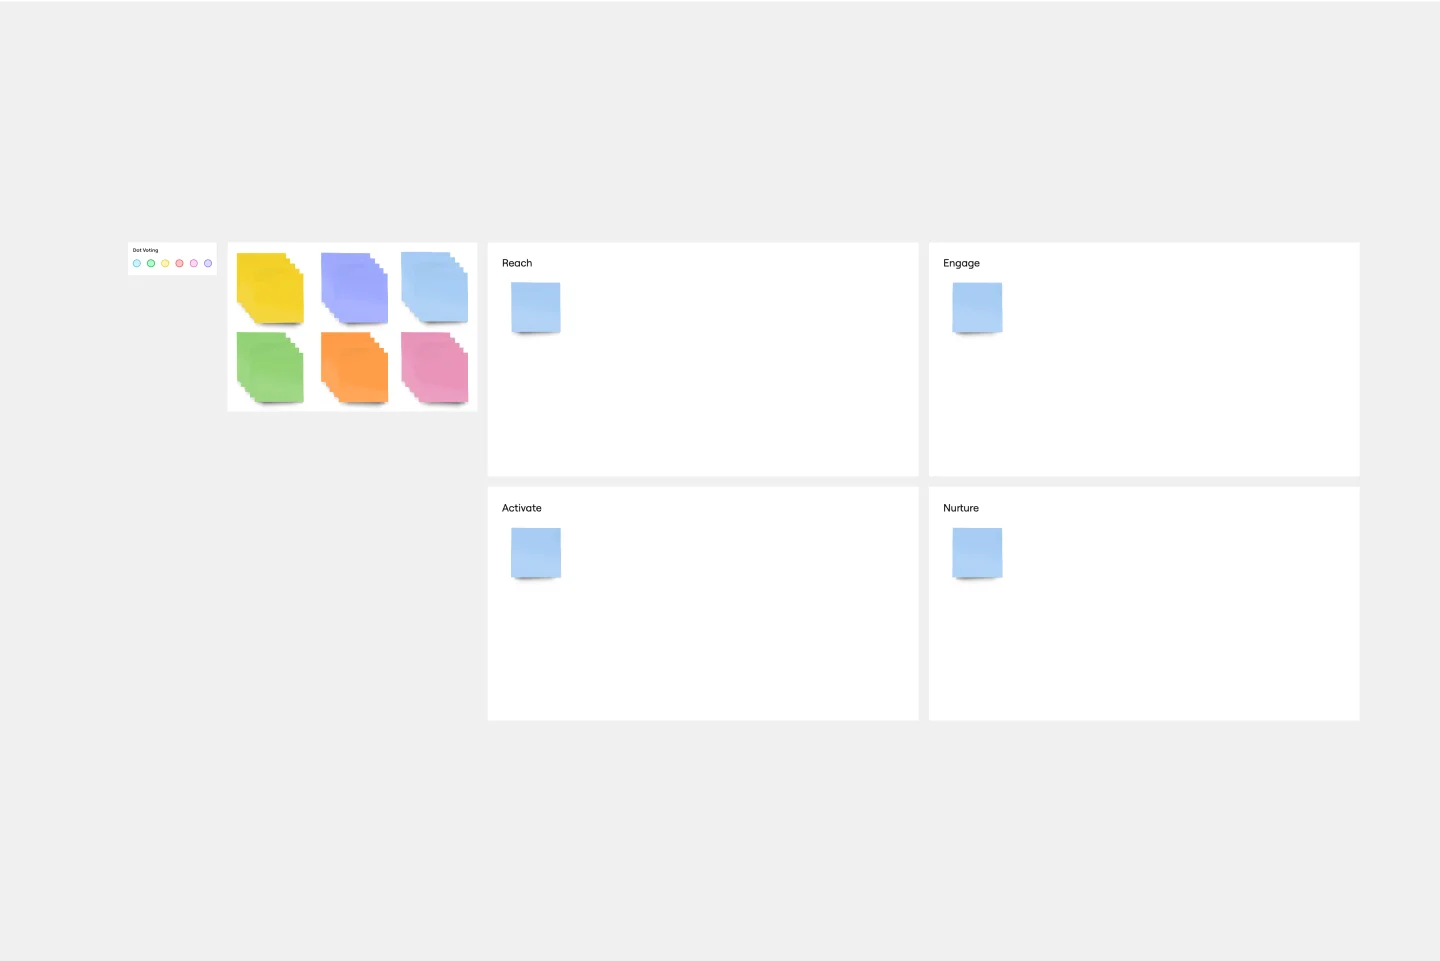
REAN Template
Works best for:
Marketing, Strategic Planning, Meetings
First introduced in Cult of Analytics, the REAN model is used to measure and understand the efficacy of marketing efforts. REAN stands for Reach, Engage, Activate, and Nurture, the main stages a marketer’s audiences experience during a typical journey. The REAN model helps marketing teams develop useful KPIs that can help capture how well their marketing or ad campaigns are working. Many teams rely on the REAN model because it is adaptable to a variety of marketing efforts, including planning measurement frameworks, setting goals, deciding on objectives, and mapping digital marketing channels.
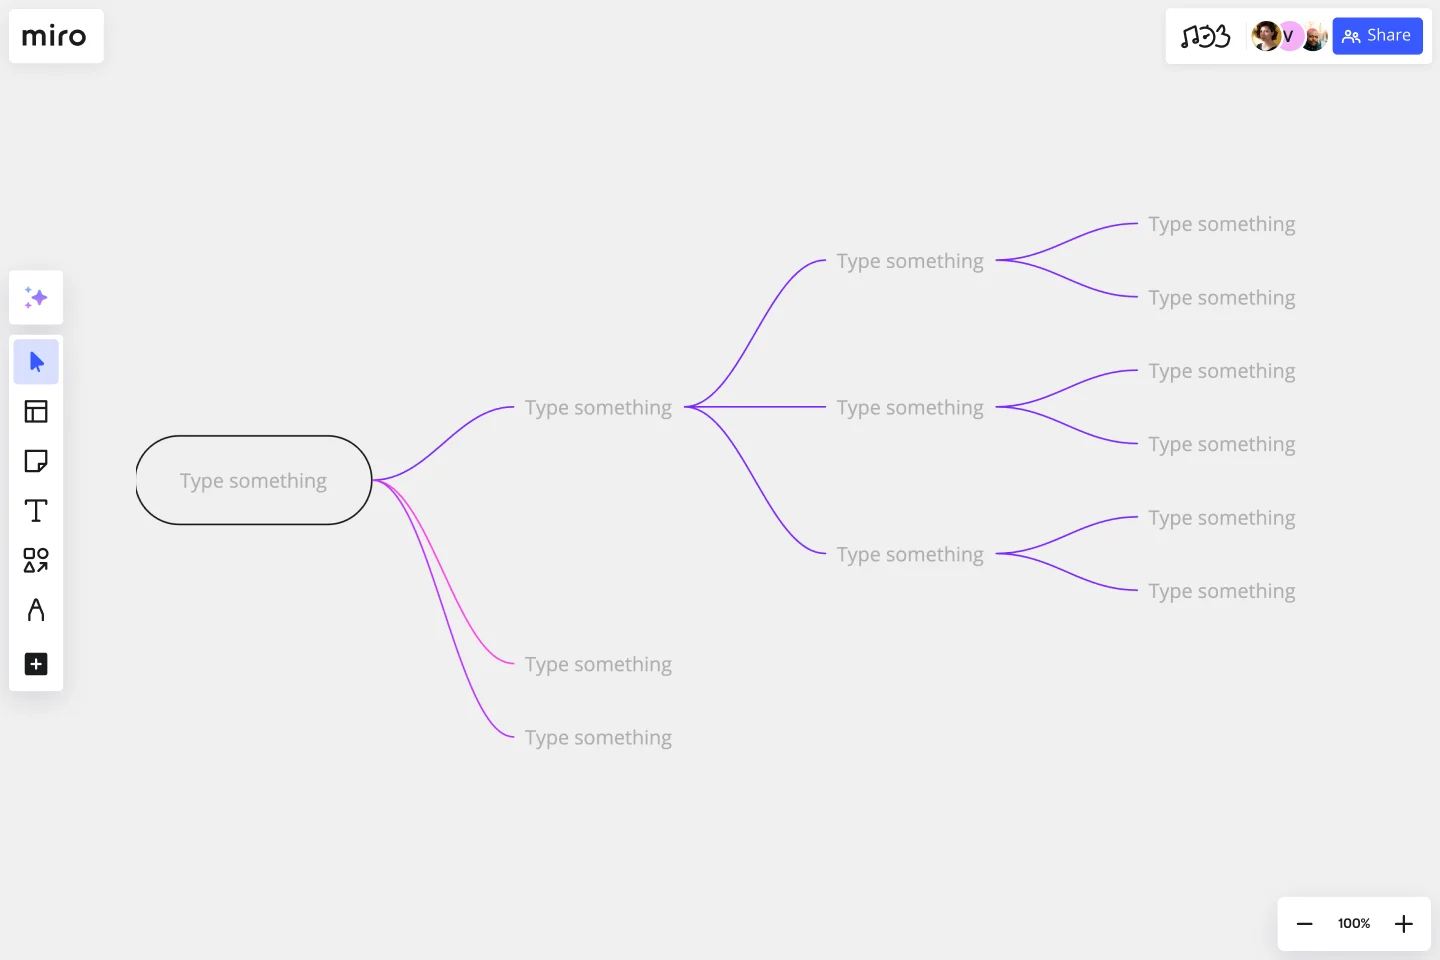
Concept Map Template
Works best for:
Education, Mapping, Brainstorming
Use the concept map template to create new ideas, structure your thoughts, and bring your innovations to life. It allows you to explore connections between concepts and let your creativity flow in an organized format. As a result, you’re able to visualize how to bring your new ideas to reality and how various concepts relate to each other.