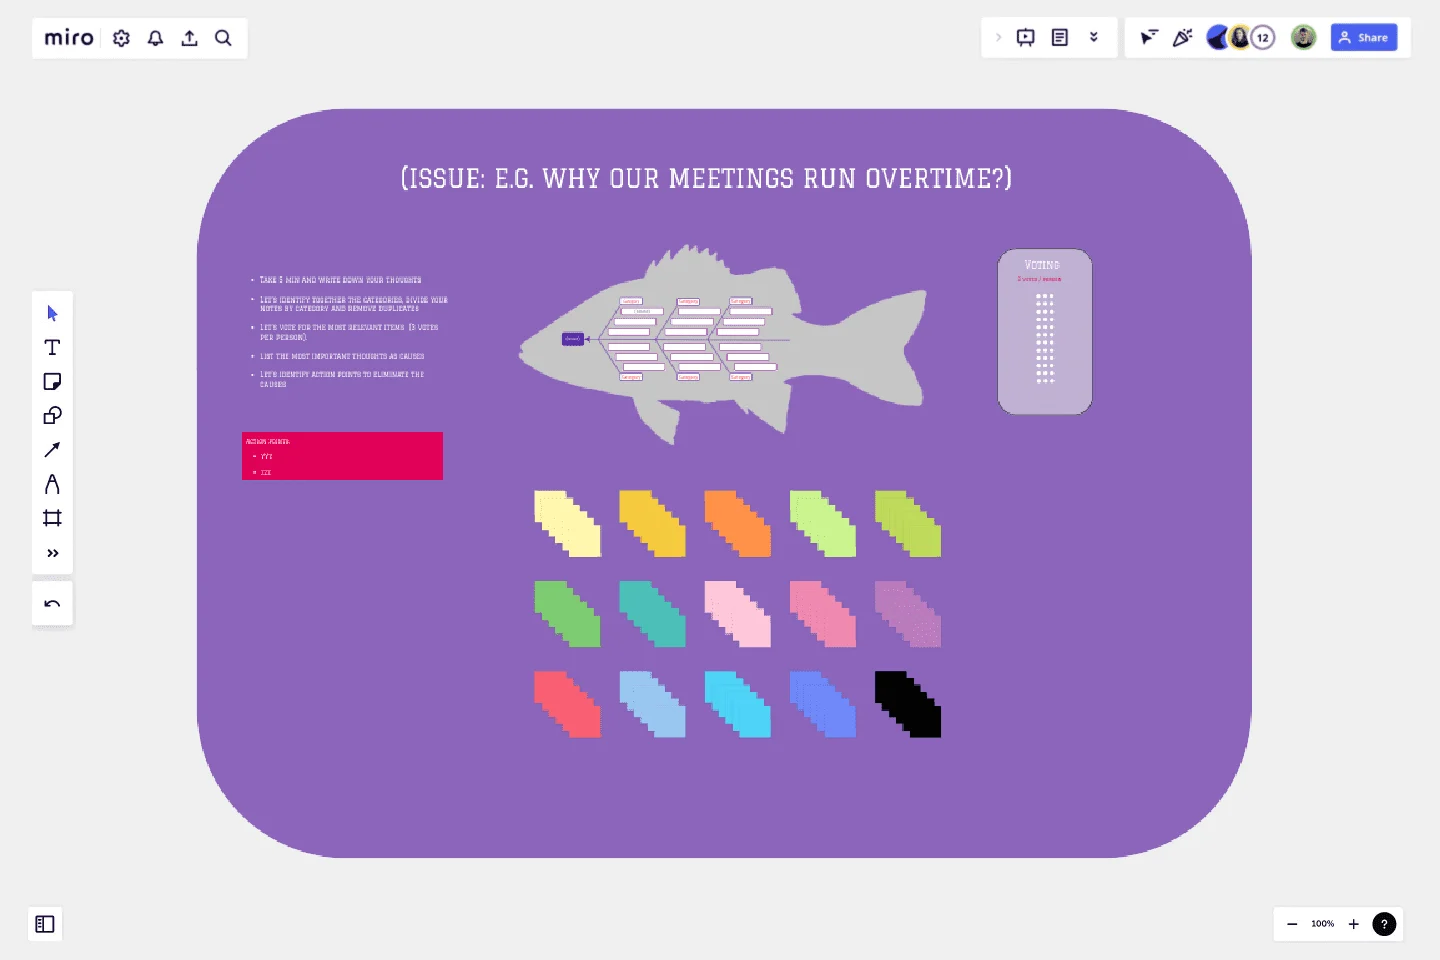
Fishbone Diagram
This diagram is a cause-and-effect diagram that helps managers to track down the reasons for imperfections, variations, defects, or failures.
This diagram is a cause-and-effect diagram that helps managers to track down the reasons for imperfections, variations, defects, or failures. The diagram looks just like a fish’s skeleton with the problem at its head and the causes for the problem feeding into the spine.
Once all the causes that underlie the problem have been identified, managers can start looking for solutions to ensure that the problem doesn’t become a recurring one.
Get started with this template right now.
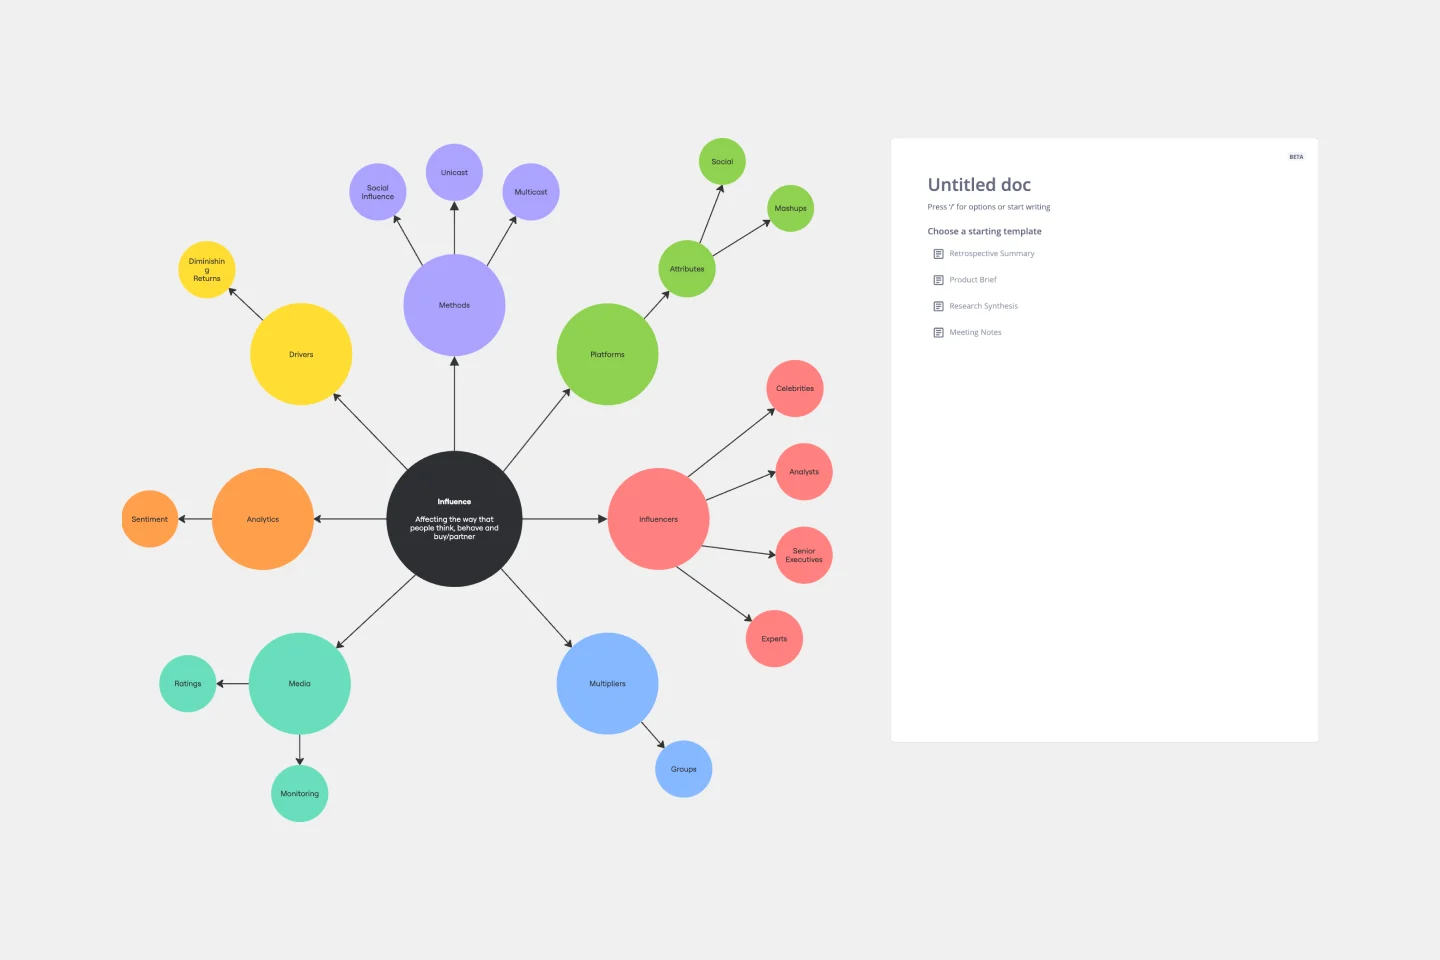
Cluster Diagram Template
Works best for:
Diagramming
The Cluster Diagram Template is a valuable tool for organizing and connecting ideas, concepts, and information in a visually compelling and coherent manner. The template's design centers on grouping related ideas around a core concept, creating a transparent and hierarchical structure. This clustering not only aids in breaking down complex information into manageable segments but also significantly enhances the process of idea generation and brainstorming. A structured yet flexible visual framework encourages deeper engagement and more precise understanding, making it an essential asset for teams and people looking to bring order to their creative and analytical processes.
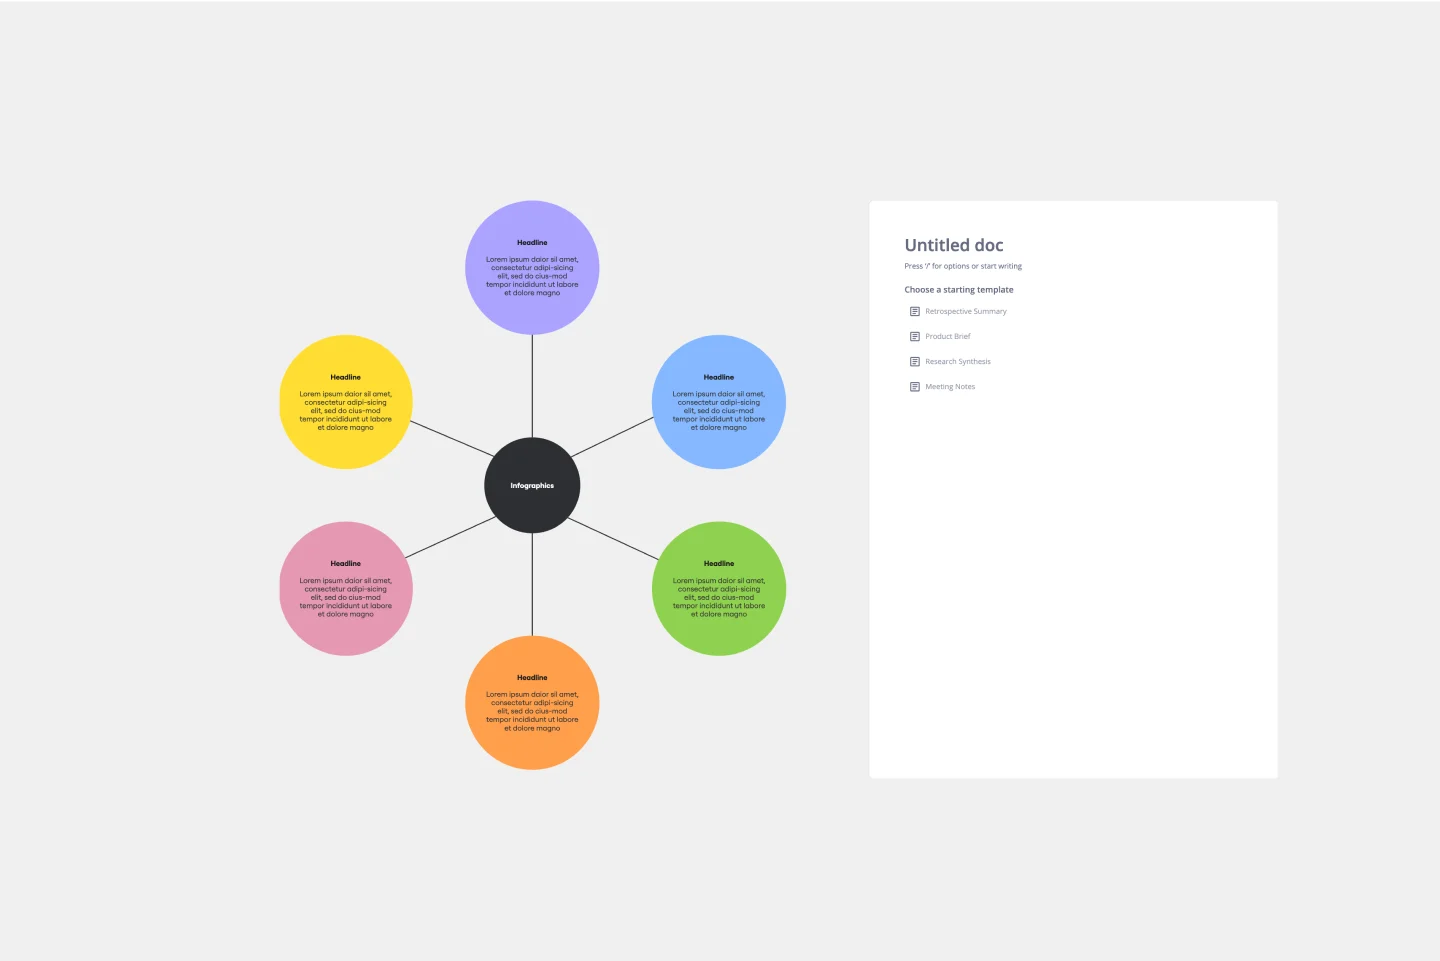
Web Diagram Template
Miro's Web Diagram Template simplifies complex project organization and promotes effective communication. It allows users to easily connect elements and gain a comprehensive understanding of complex relationships, making it a versatile and invaluable asset for diverse projects.
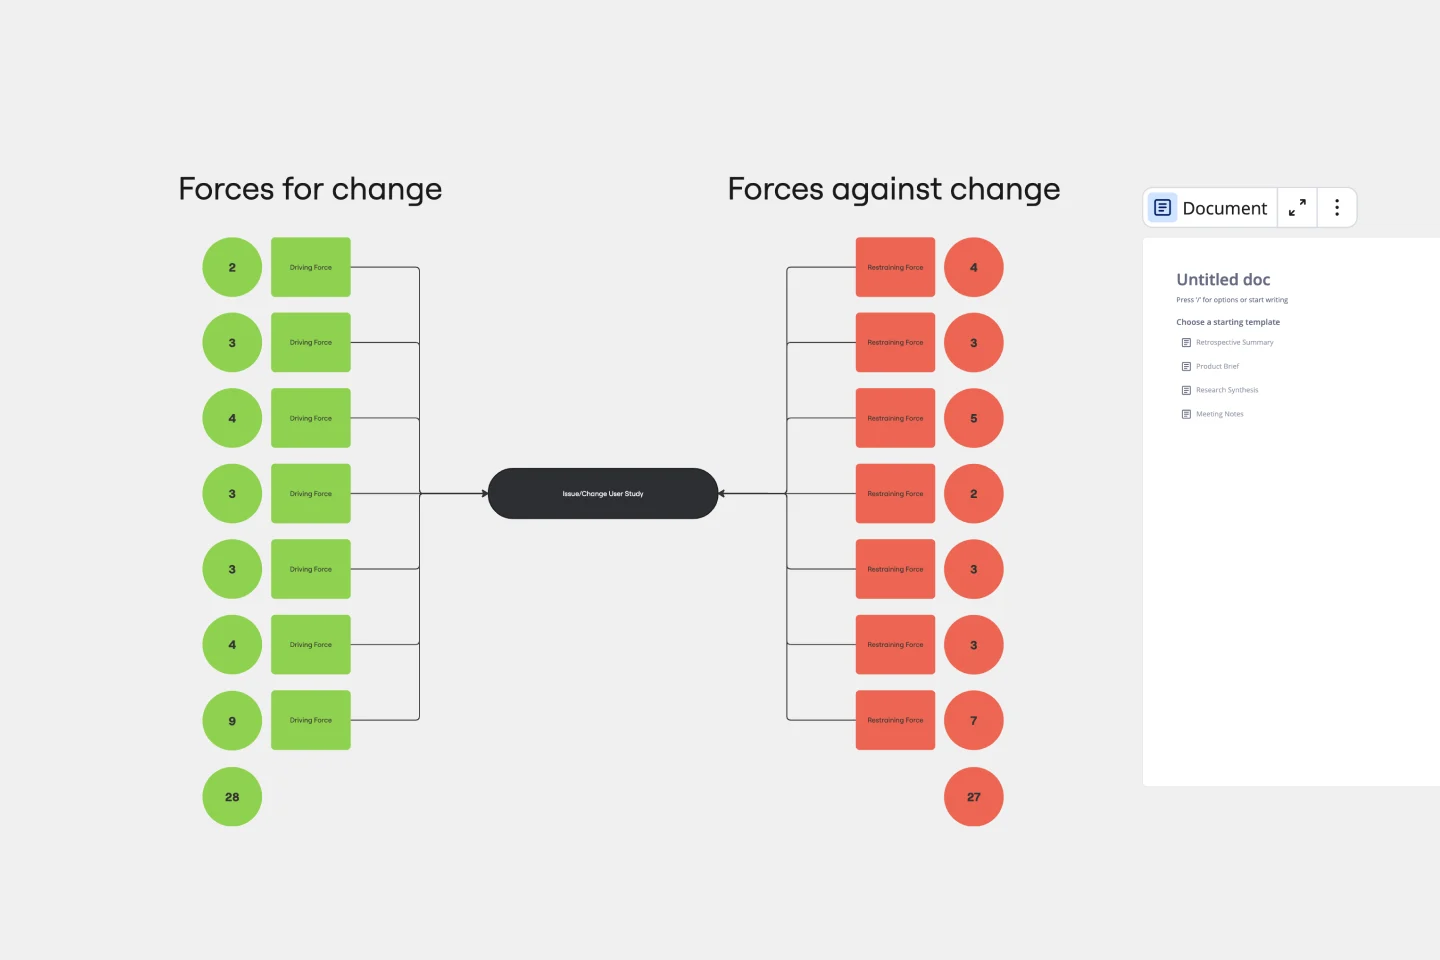
Force Field Analysis Template
Works best for:
Diagramming, Strategic Planning
A Force Field Analysis Template is a powerful tool that helps teams identify and analyze the forces supporting or hindering progress toward a specific change or goal. This template provides a visual space where you can brainstorm and plot out 'driving forces' that push objectives forward and 'restraining forces' that prevent advancement, all on a single, intuitive board. One of the primary benefits of utilizing the Force Field Analysis template is that it fosters a shared understanding among team members. By visually mapping out and discussing each force, teams can prioritize efforts, build consensus on the central issues to tackle, and collaboratively devise strategic plans to strengthen positive influences while reducing negative ones.
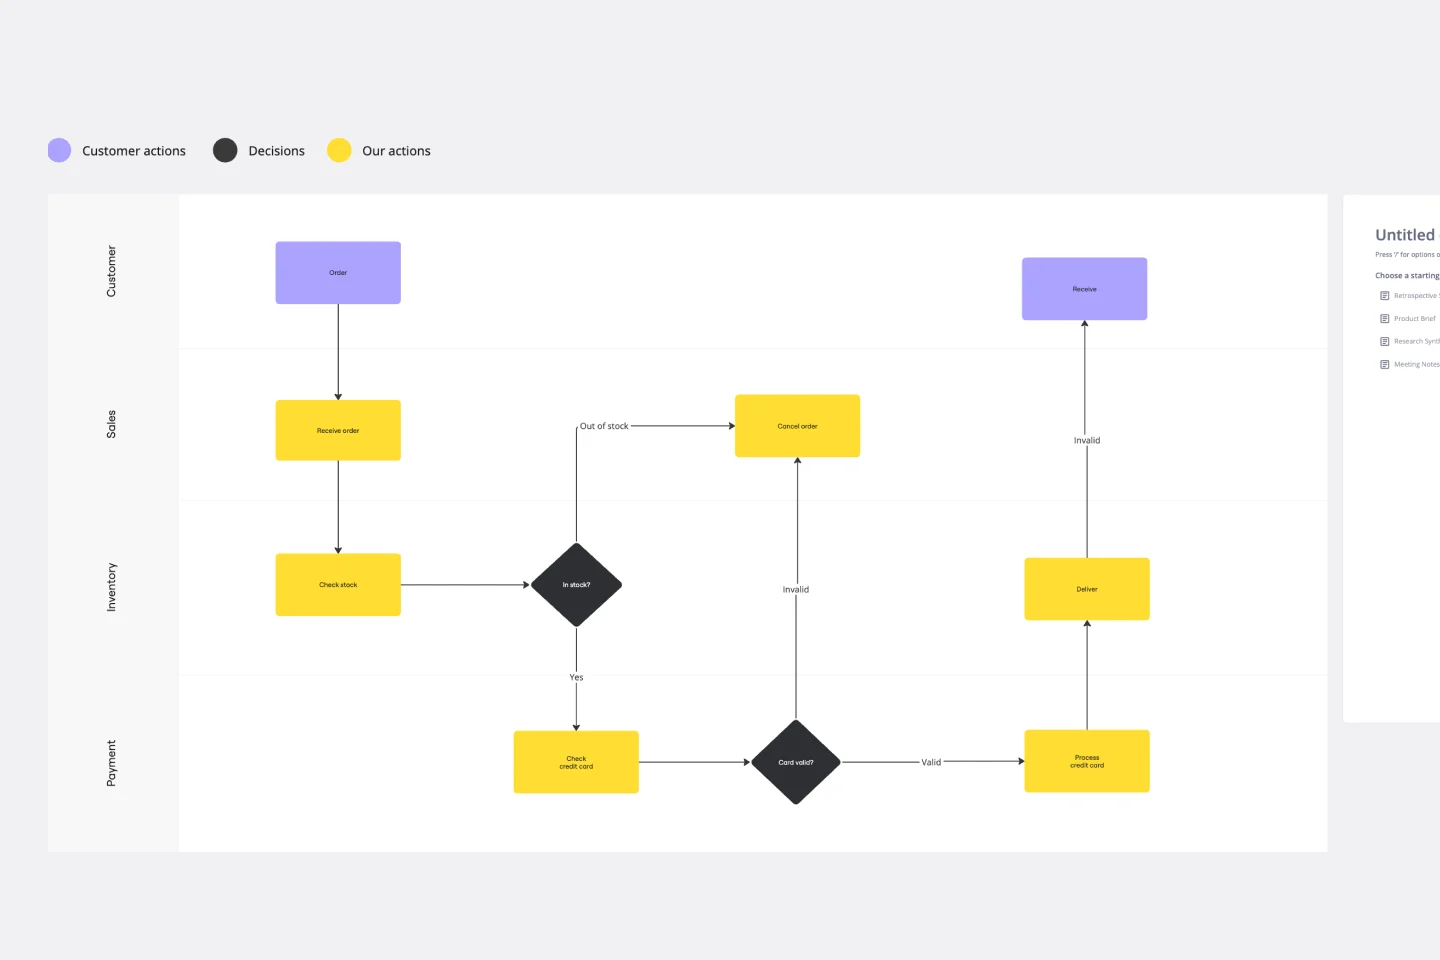
Swimlane Diagram Template
Works best for:
Flowcharts, Diagrams, Workflows
A swimlane diagram shows you which stakeholders are responsible for each area of your critical processes. You can use it to understand current processes or plan new ones.
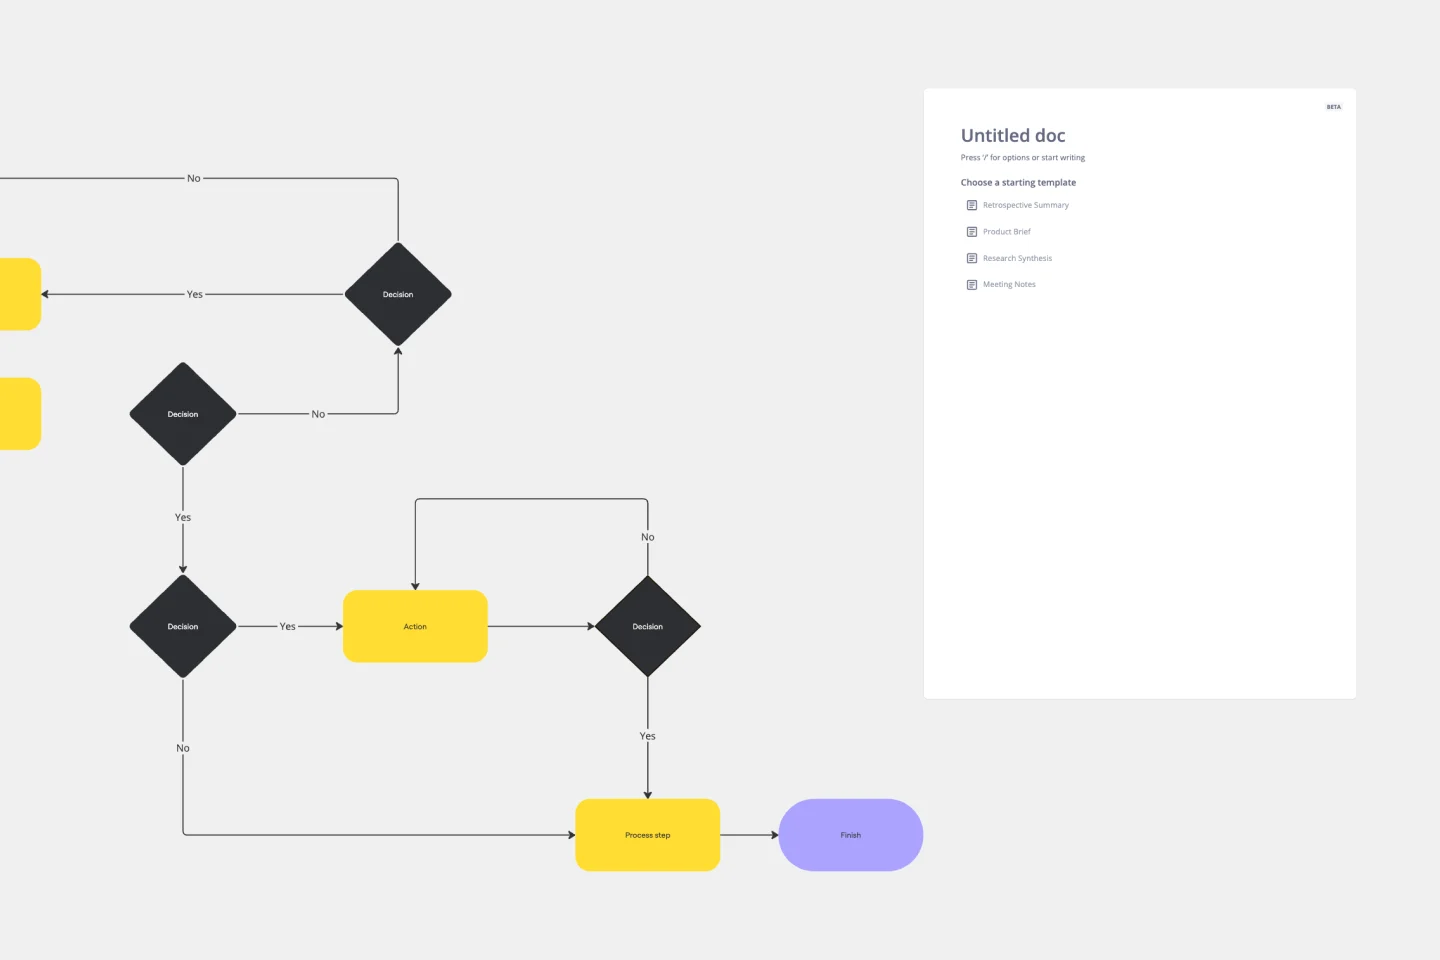
Production Flowchart Template
Works best for:
Flowcharts
The Production Flowchart Template is a well-crafted tool that clearly represents a production process from start to finish. It breaks down complex procedures into easy-to-understand segments, making it easier for stakeholders to grasp the entire process. One of the key benefits of using this template is that it helps to clarify complex production pathways. By mapping out operations visually, teams can identify potential bottlenecks or inefficiencies, facilitating timely and well-informed decision-making.
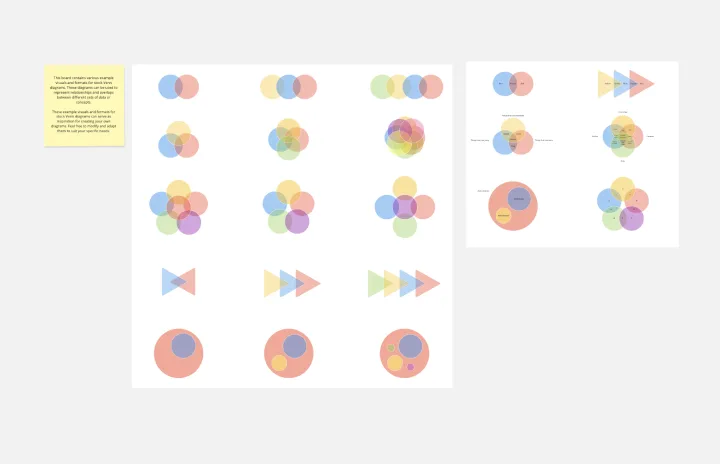
Venn Diagrams
Works best for:
Venn Diagram
Visualize relationships and intersections clearly with the Collection Venn Diagram template. This tool is perfect for comparing multiple sets of data, identifying commonalities, and showcasing unique elements. Use it in presentations, research, and data analysis to make complex information more digestible. Ideal for educators, researchers, and analysts seeking to present data insights effectively.