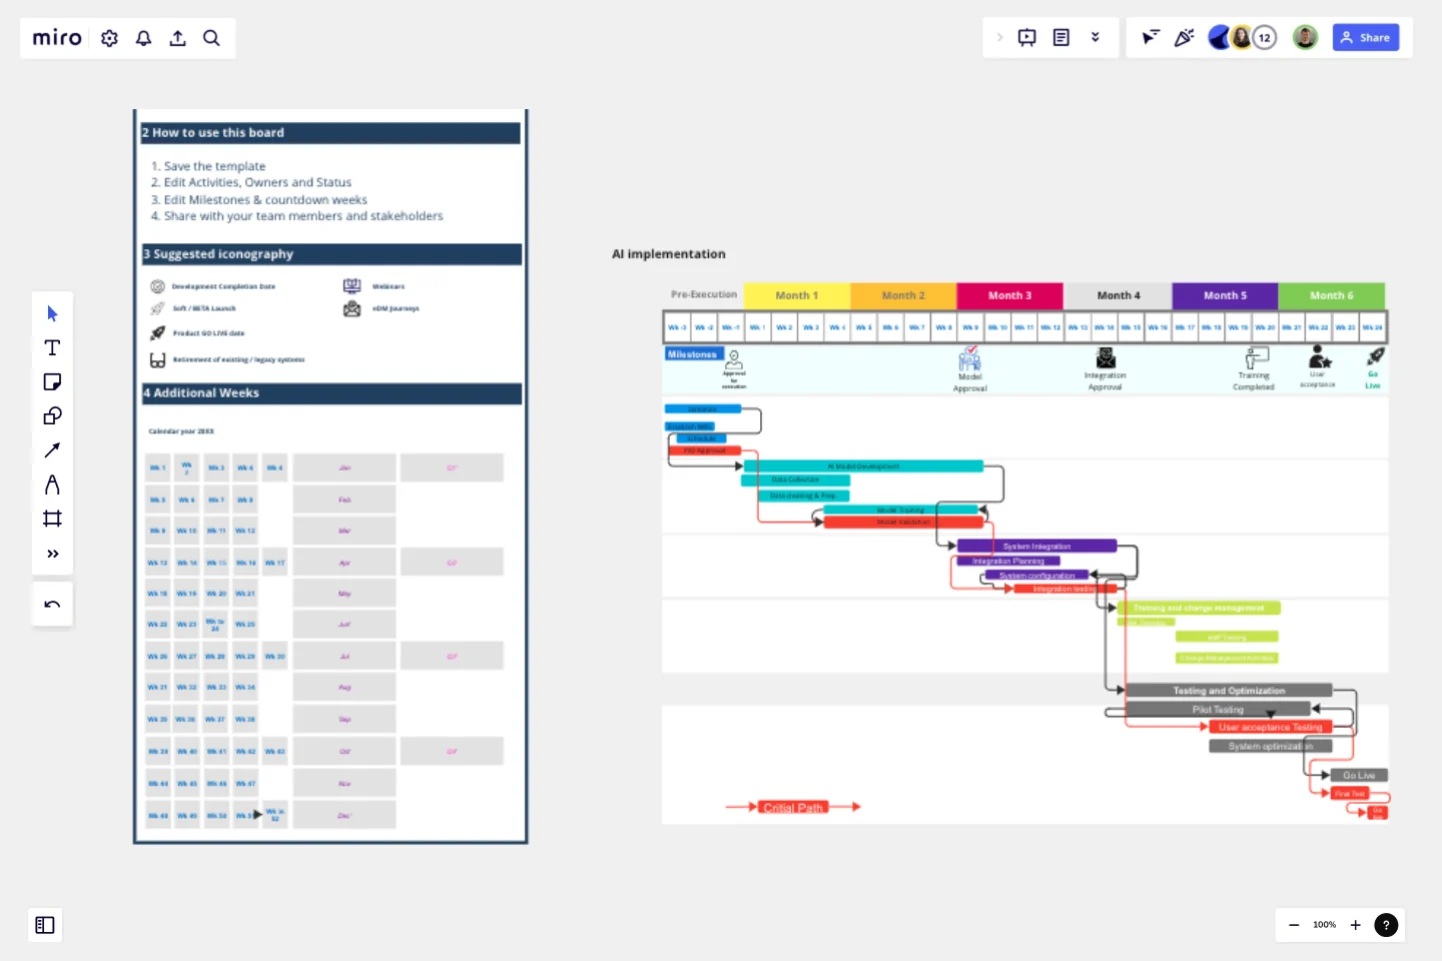
Gantt Chart for Project Scheduling
A Gantt chart is a project management tool that helps in planning, scheduling, and monitoring a project.
A Gantt chart is a project management tool that helps in planning, scheduling, and monitoring a project.
A Gantt chart is a horizontal bar chart used to display the start date and duration of each task that makes up a project.
It represents all information visually through a horizontal bar graph.
Project managers and team members can view the task schedules, dependencies, and progress by just glancing at the chart.
Components:
Y-axis: Represents the tasks in the project.
X-axis: Represents the duration of each task.
Bars: Each task is represented by a bar, and the length of the bar indicates its duration.
Overlapping Bars: If two bars overlap on the X-axis, they occur simultaneously.
Get started with this template right now.
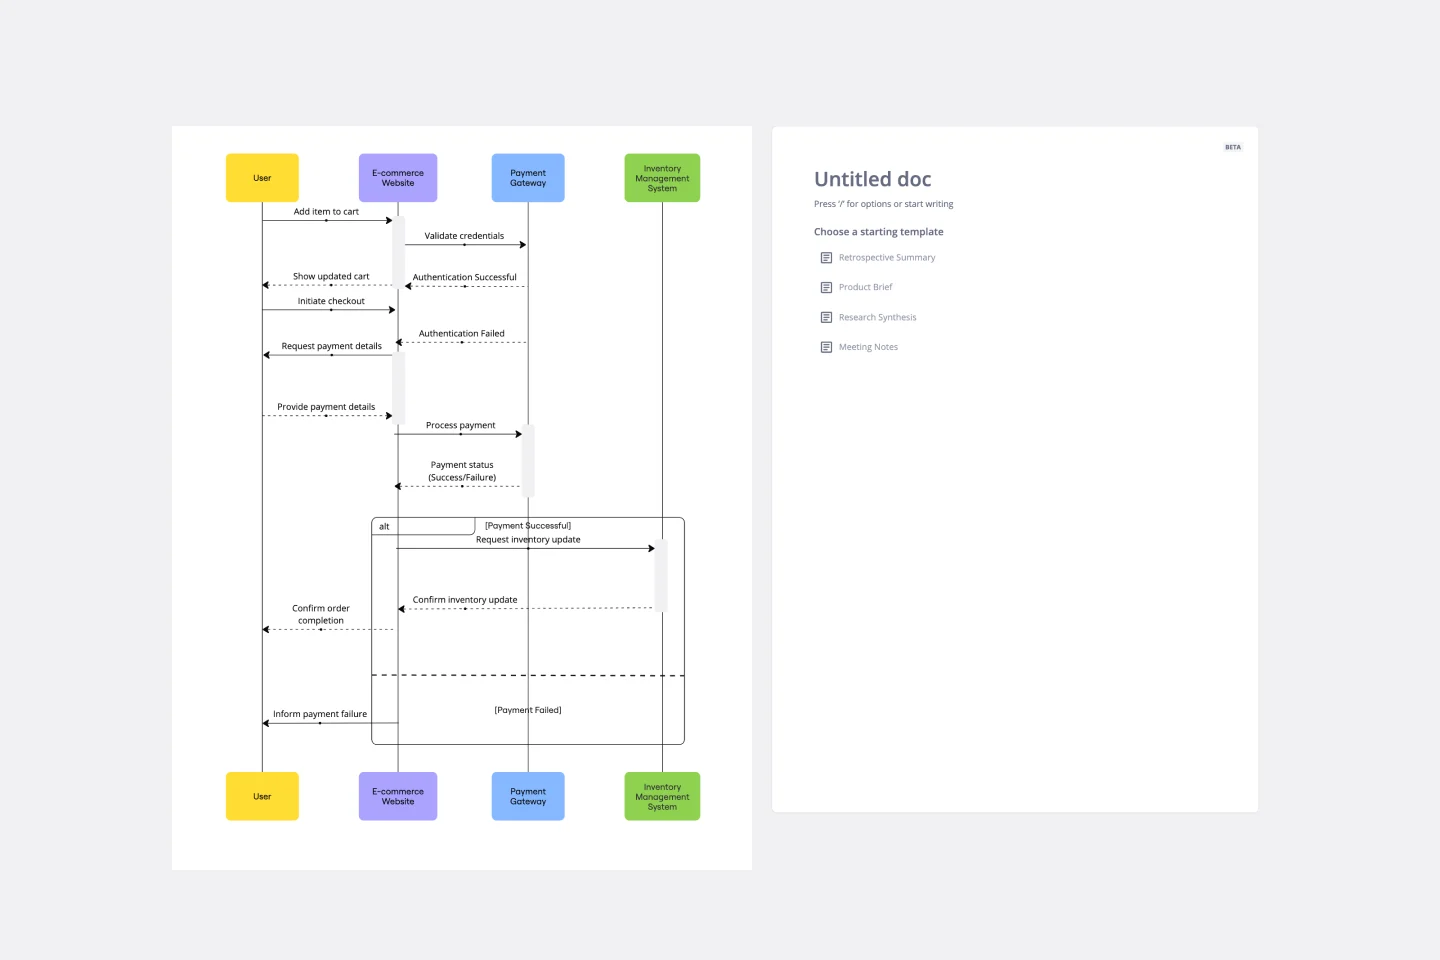
UML Sequence E-commerce Checkout Template
Works best for:
UML
The UML Sequence E-commerce Checkout Template in Miro is a versatile tool for visualizing and analyzing e-commerce checkout processes. It provides a step-by-step visual representation of system interactions, is highly customizable, supports real-time collaboration, and is suitable for various e-commerce platforms. It serves as an efficient documentation tool, fosters team collaboration, and contributes to a more streamlined checkout experience for customers.
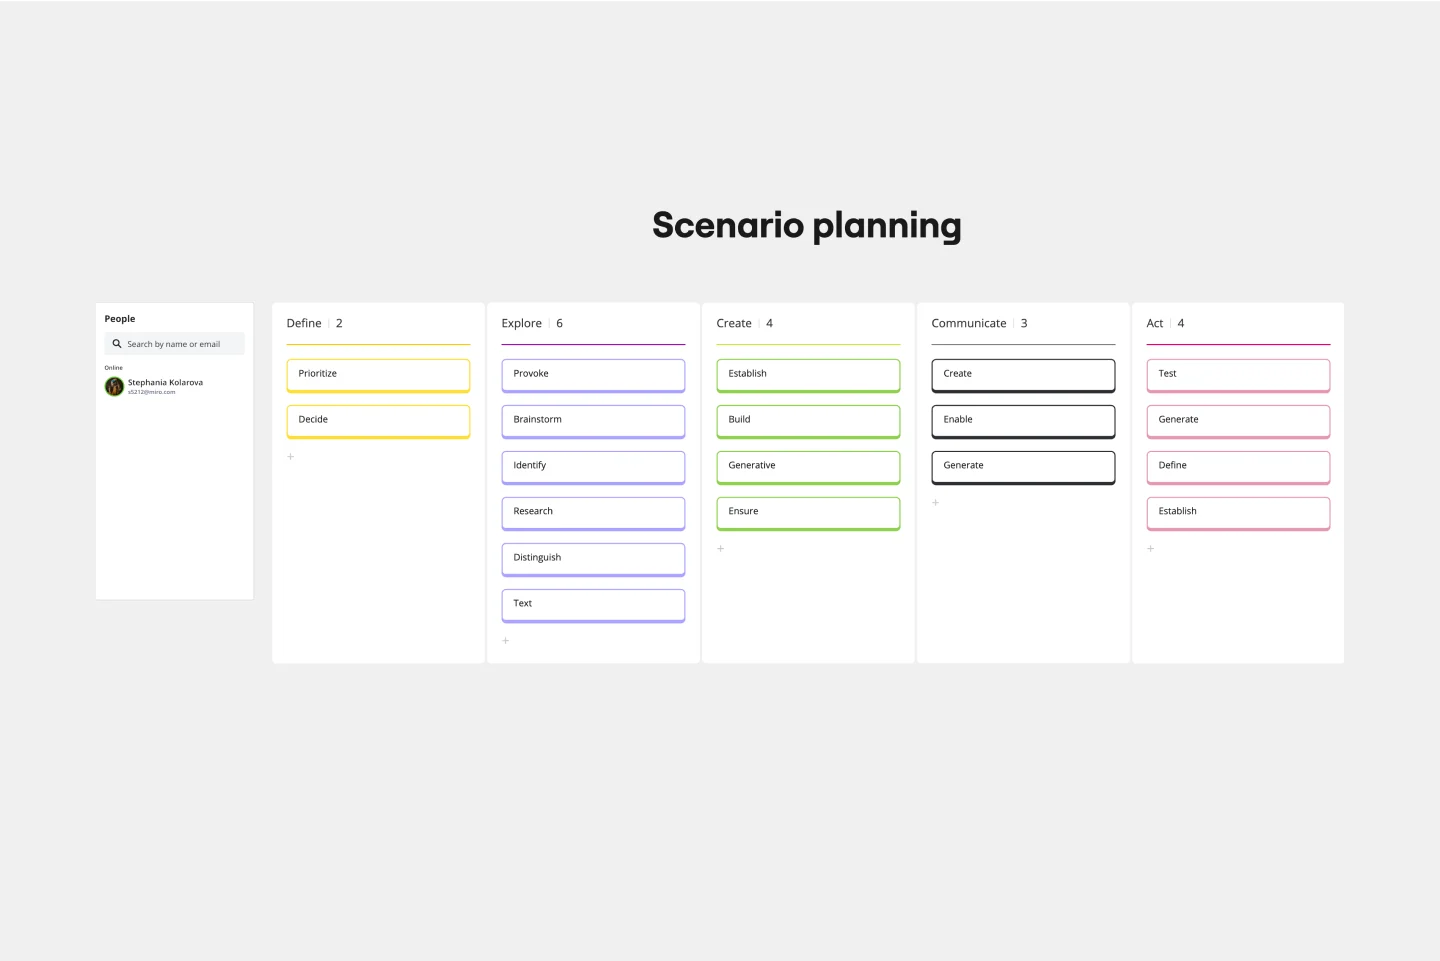
Scenario Planning Template
Works best for:
Planning
The Scenario Planning Template simplifies the complex process of strategizing and envisioning various future scenarios. The template’s clear structure helps teams and individuals effectively navigate the multifaceted steps of project planning and execution. A standout benefit of this template is its capability to foster structured thinking. With its distinct sections ranging from definition to action, it ensures that ideas are organized coherently, promoting logical progression and reducing the chances of oversight, making the planning process both efficient and comprehensive.
Recruitment Strategy Roadmap
Works best for:
Roadmap, Planning, Mapping
The Recruitment Strategy Roadmap template helps organizations plan and execute their talent acquisition initiatives effectively. It provides a structured framework for identifying hiring needs, sourcing candidates, and evaluating recruitment channels. By aligning recruitment efforts with business objectives, organizations can attract and retain top talent, driving organizational growth and success.

Venn Diagram for Product Development
Works best for:
Venn Diagrams
Streamline your product development process with the Venn Diagram for Product Development template. Use it to compare product features, identify market needs, and explore design options. This template helps you visualize relationships and prioritize features based on customer requirements and competitive analysis. It's an essential tool for product managers, designers, and development teams aiming to create successful and user-centric products.
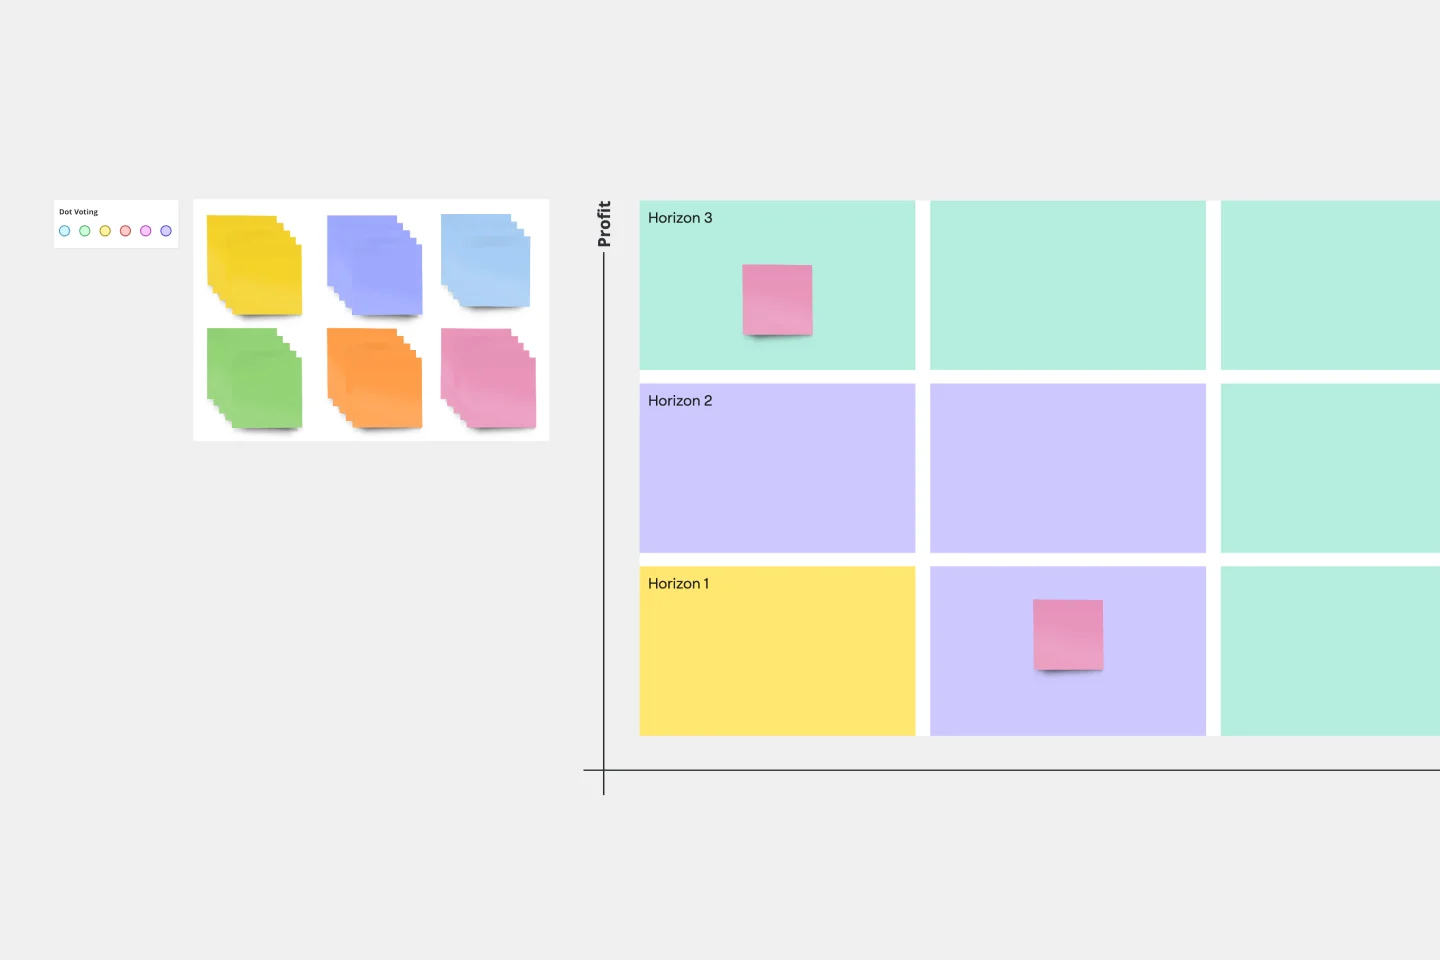
3 Horizons of Growth Template
Works best for:
Leadership, Strategic Planning, Project Planning
Featured in The Alchemy of Growth, this model gives ambitious companies a way to balance the present and the future—in other words, what’s working in the existing business and what emerging, possibly-profitable growth opportunities lie ahead. Then teams across the organization can make sure that their projects map to and support the organization’s goals. The 3 Horizons of Growth model is also a powerful way to foster a culture of innovation—one that values and depends on experimentation and iteration—and to identify opportunities for new business.

OKR Board for Product, UX and Engineering Teams
The OKR Board for Product, UX, and Engineering Teams template aligns cross-functional teams around common objectives using Objectives and Key Results (OKRs). By setting ambitious goals, defining measurable outcomes, and tracking progress collaboratively, this template fosters alignment and focus. With sections for defining team OKRs, prioritizing initiatives, and monitoring performance, it enables teams to work cohesively towards shared goals. This template serves as a catalyst for driving product innovation and delivering exceptional user experiences.