Four-Circle Venn Diagram
Welcome to the Four-Circle Venn Diagram template!
Miro Template: Four-Circle Venn Diagram
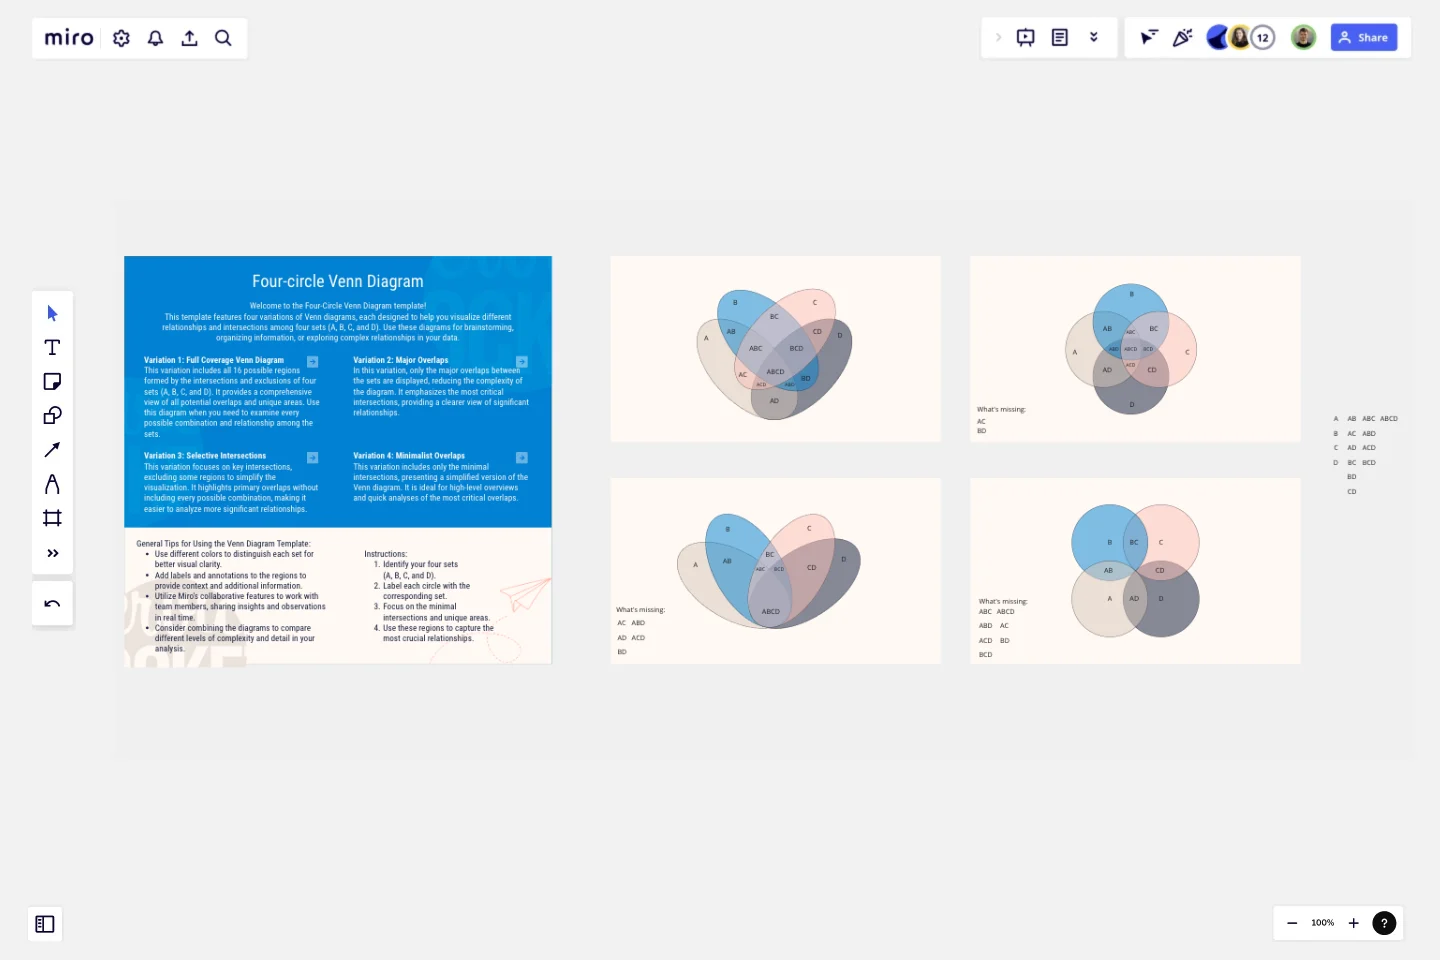
Welcome to the Four-Circle Venn Diagram template! This template features four variations of Venn diagrams, each designed to help you visualize different relationships and intersections among four sets (A, B, C, and D). Use these diagrams for brainstorming, organizing information, or exploring complex relationships in your data.
Variation 1: Full Coverage Venn Diagram
This variation includes all 16 possible regions formed by the intersections and exclusions of four sets (A, B, C, and D). It provides a comprehensive view of all potential overlaps and unique areas. Use this diagram when you need to examine every possible combination and relationship among the sets.
Variation 2: Major Overlaps
In this variation, only the major overlaps between the sets are displayed, reducing the complexity of the diagram. It emphasizes the most critical intersections, providing a clearer view of significant relationships.
Variation 3: Selective Intersections
This variation focuses on key intersections, excluding some regions to simplify the visualization. It highlights primary overlaps without including every possible combination, making it easier to analyze more significant relationships.
Variation 4: Minimalist Overlaps
This variation includes only the minimal intersections, presenting a simplified version of the Venn diagram. It is ideal for high-level overviews and quick analyses of the most critical overlaps.
Instructions:
Identify your four sets (A, B, C, and D).
Label each circle with the corresponding set.
Focus on the minimal intersections and unique areas.
Use these regions to capture the most crucial relationships.
General Tips for Using the Venn Diagram Template:
Use different colors to distinguish each set for better visual clarity.
Add labels and annotations to the regions to provide context and additional information.
Utilize Miro's collaborative features to work with team members, sharing insights and observations in real time.
Consider combining the diagrams to compare different levels of complexity and detail in your analysis.
This template aims to provide flexibility and clarity in visualizing the relationships among four sets. Choose the variation that best fits your needs and start exploring the intersections and unique aspects of your data!
Get started with this template right now.
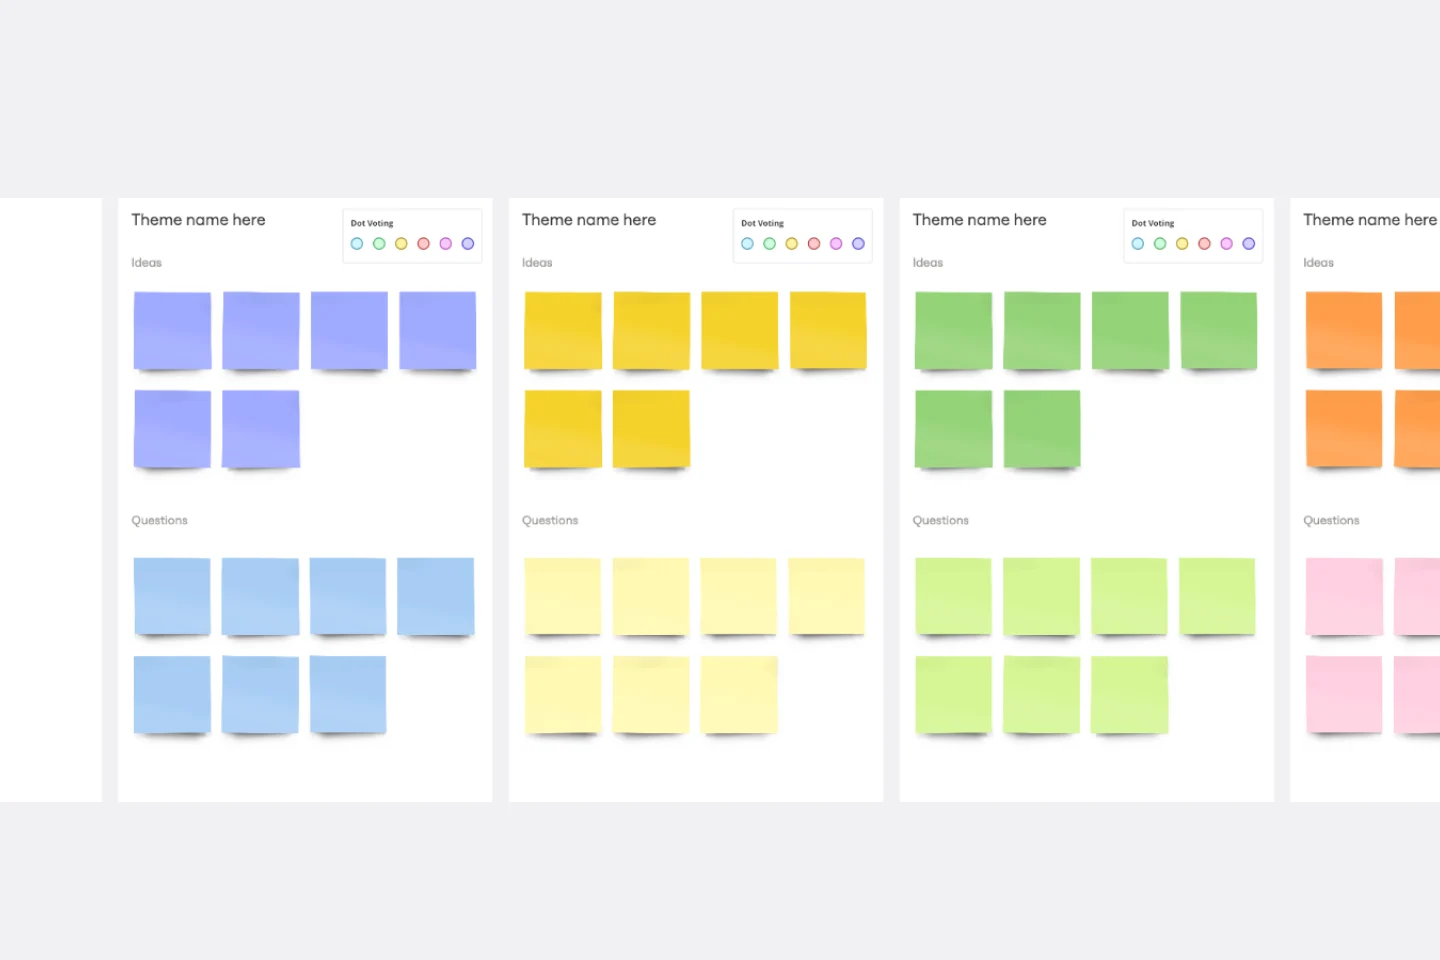
Affinity Diagram Template
Works best for:
Desk Research, Mapping, Product Management
You can use an affinity diagram to generate, organize, and consolidate information that comes out of a brainstorming session. Whether you’re building a product, working through a complex problem, establishing a process, or piecing apart an issue, an affinity diagram is a useful and simple framework that gives each team member the opportunity to pitch in and share their thoughts. But it’s not just ideal for brainstorms—this is a great template and tool when you need to reach consensus or analyze data such as survey results.
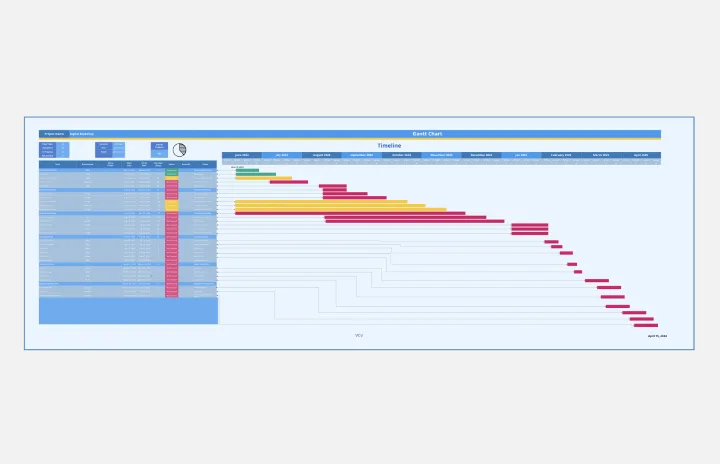
Gantt Chart Project
Works best for:
Strategy, Planning
The Gantt Chart Project template is a versatile tool for managing various types of projects. It provides a clear visual timeline of your project's tasks, deadlines, and dependencies. Use it to plan, execute, and monitor your project's progress, ensuring all activities are aligned and on track. This template enhances team collaboration, improves time management, and helps address potential bottlenecks for successful outcomes.
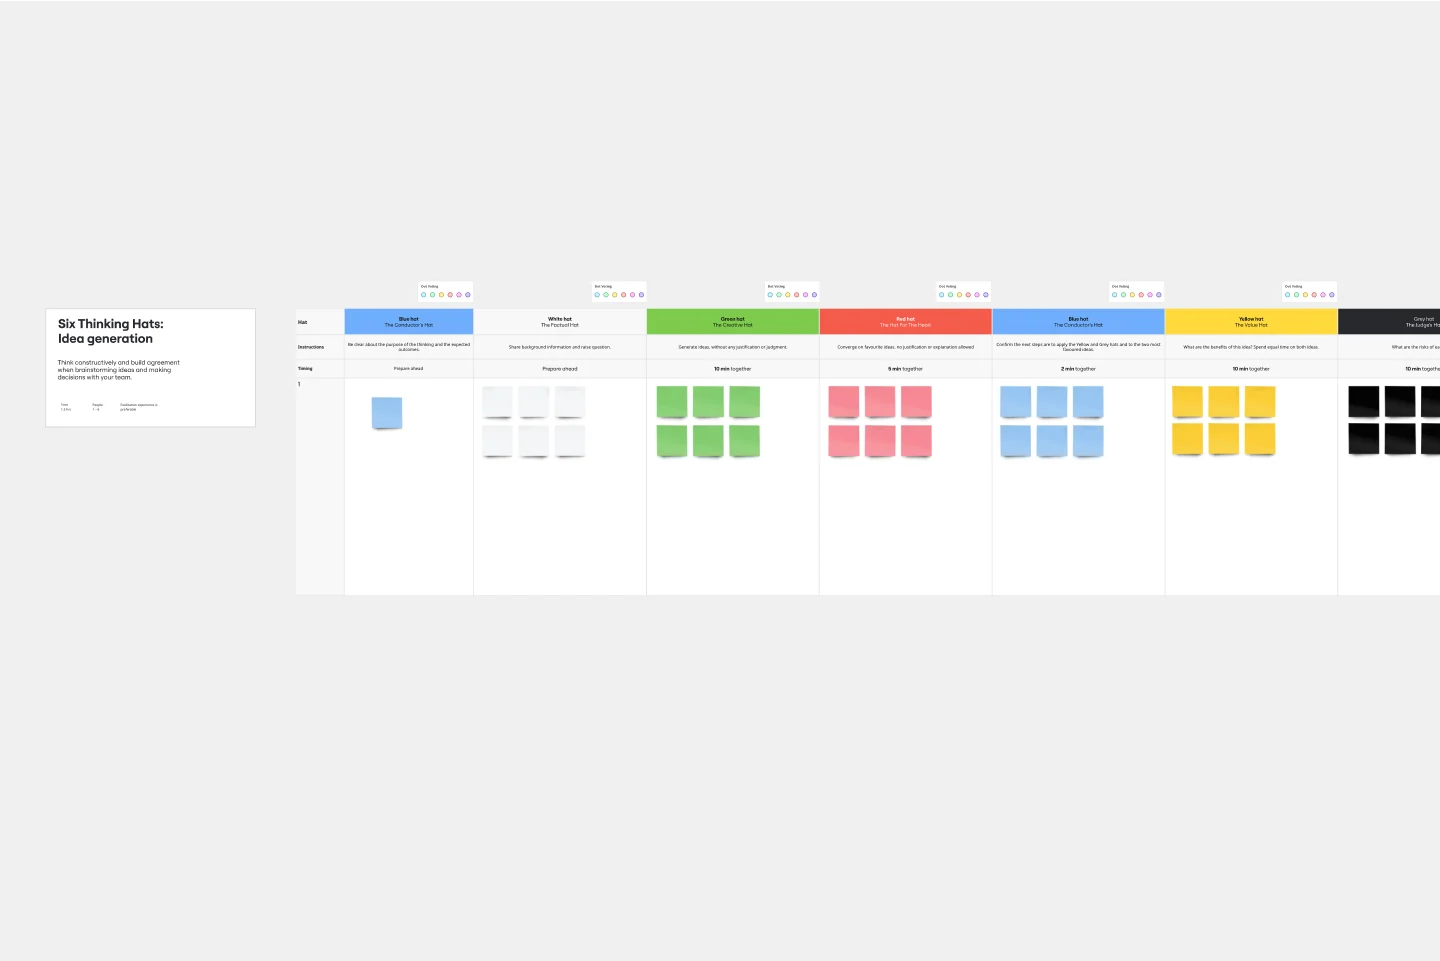
Six Thinking Hats Template
Works best for:
Ideation, Brainstorming
The Six Thinking Hats by Dr. Edward de Bono was created as an alternative to argument, it is designed to help teams explore and develop ideas collaboratively. Use this template to boost creative thinking and get different perspectives so you and your team can make better-informed decisions.
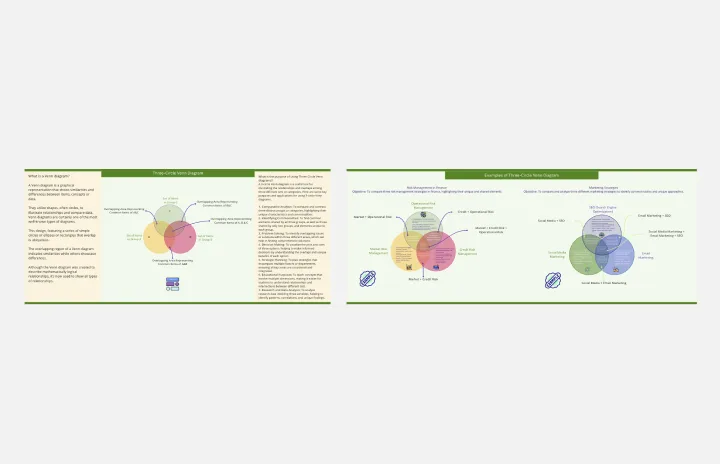
Three-Circle Venn Diagram
Works best for:
Venn Diagram
The Three Circle Venn Diagram template allows you to explore the relationships between three different sets. Use it to identify shared characteristics, unique attributes, and intersections. This tool is ideal for comparing multiple concepts or categories, facilitating strategic planning, problem-solving, and decision-making. Perfect for educators, researchers, and business professionals looking to analyze complex data visually and effectively.
Timeline Meeting
Works best for:
Timeline, Planning
The Timeline Meeting template is tailored for planning and conducting meetings with a focus on time management. It helps you set clear agendas, allocate time for each topic, and keep track of discussion points. This template ensures your meetings are productive and stay on track.