Four-Circle Venn Diagram
A Venn diagram is a graphical representation that shows similarities and differences between items, concepts or data.
Overview
A Venn diagram is a graphical representation that shows similarities and differences between items, concepts or data. They utilize shapes, often circles, to illustrate relationships and compare data.
Venn diagrams are certainly one of the most well-known types of diagrams. This design, featuring a series of simple circles or ellipses or rectangles that overlap is ubiquitous. The overlapping region of a Venn diagram indicates similarities while others showcase differences. Although the Venn diagram was created to describe mathematically logical relationships, it’s now used to show all types of relationships.
Uses:
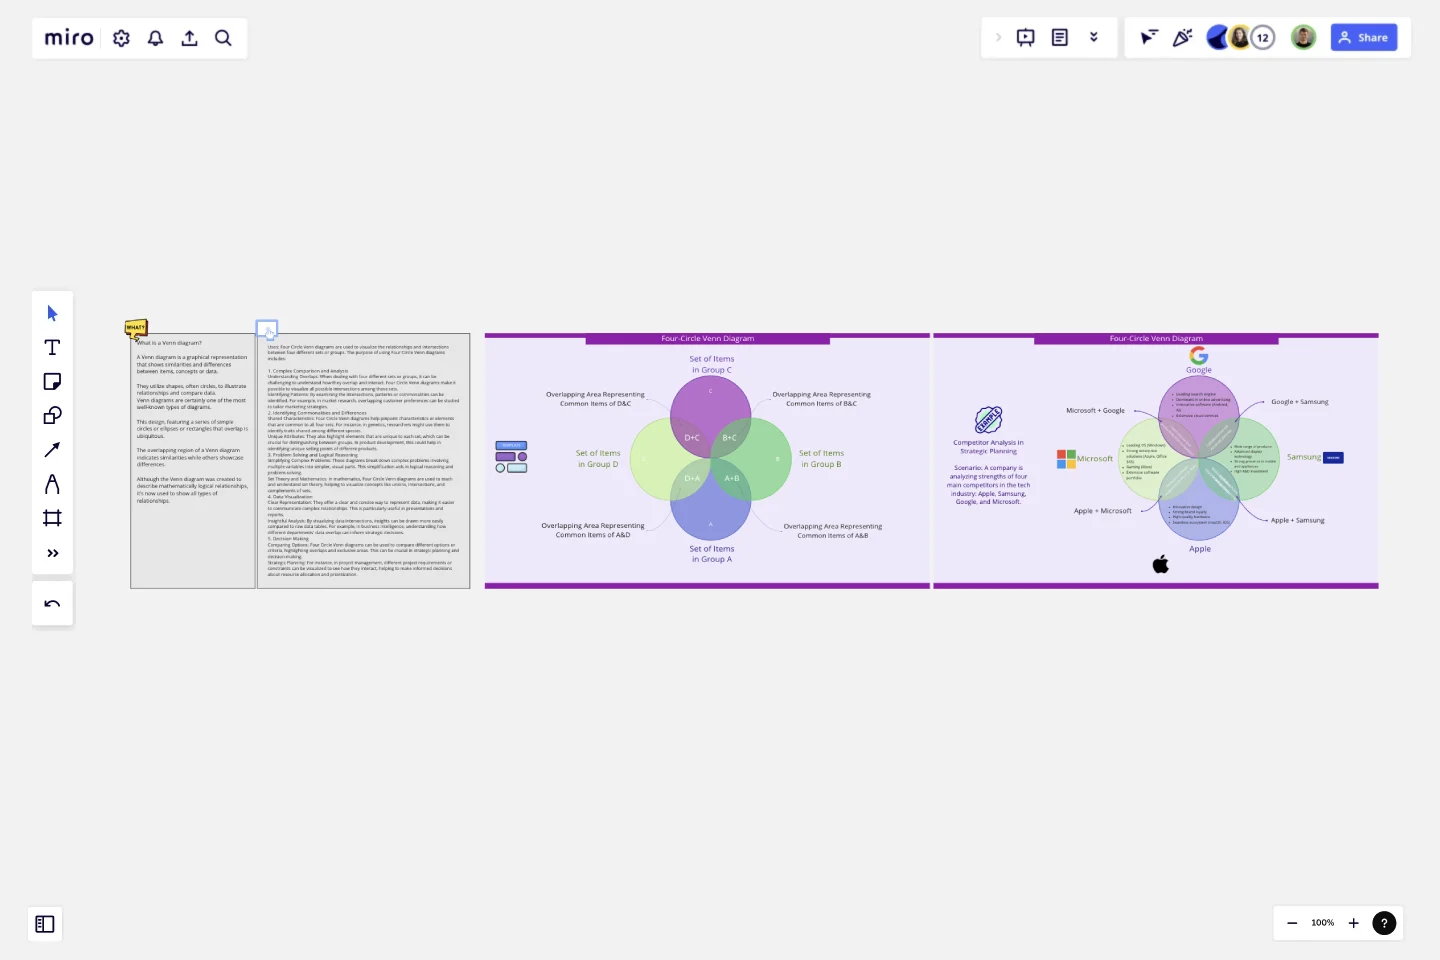
Four Circle Venn diagrams are used to visualize the relationships and intersections between four different sets or groups. The purpose of using Four Circle Venn diagrams includes:
1. Complex Comparison and Analysis
Understanding Overlaps: When dealing with four different sets or groups, it can be challenging to understand how they overlap and interact. Four Circle Venn diagrams make it possible to visualize all possible intersections among these sets.
Identifying Patterns: By examining the intersections, patterns or commonalities can be identified. For example, in market research, overlapping customer preferences can be studied to tailor marketing strategies.
2. Identifying Commonalities and Differences
Shared Characteristics: Four Circle Venn diagrams help pinpoint characteristics or elements that are common to all four sets. For instance, in genetics, researchers might use them to identify traits shared among different species.
Unique Attributes: They also highlight elements that are unique to each set, which can be crucial for distinguishing between groups. In product development, this could help in identifying unique selling points of different products.
3. Problem Solving and Logical Reasoning
Simplifying Complex Problems: These diagrams break down complex problems involving multiple variables into simpler, visual parts. This simplification aids in logical reasoning and problem-solving.
Set Theory and Mathematics: In mathematics, Four Circle Venn diagrams are used to teach and understand set theory, helping to visualize concepts like unions, intersections, and complements of sets.
4. Data Visualization
Clear Representation: They offer a clear and concise way to represent data, making it easier to communicate complex relationships. This is particularly useful in presentations and reports.
Insightful Analysis: By visualizing data intersections, insights can be drawn more easily compared to raw data tables. For example, in business intelligence, understanding how different departments' data overlap can inform strategic decisions.
5. Decision Making
Comparing Options: Four Circle Venn diagrams can be used to compare different options or criteria, highlighting overlaps and exclusive areas. This can be crucial in strategic planning and decision-making.
Strategic Planning: For instance, in project management, different project requirements or constraints can be visualized to see how they interact, helping to make informed decisions about resource allocation and prioritization. Learn from the examples provided to start your own Venn diagram.
Good Luck
Khawaja Rizwan
Get started with this template right now.
Strategy Diamond Template
Works best for:
Leadership, Operations, Strategic Planning
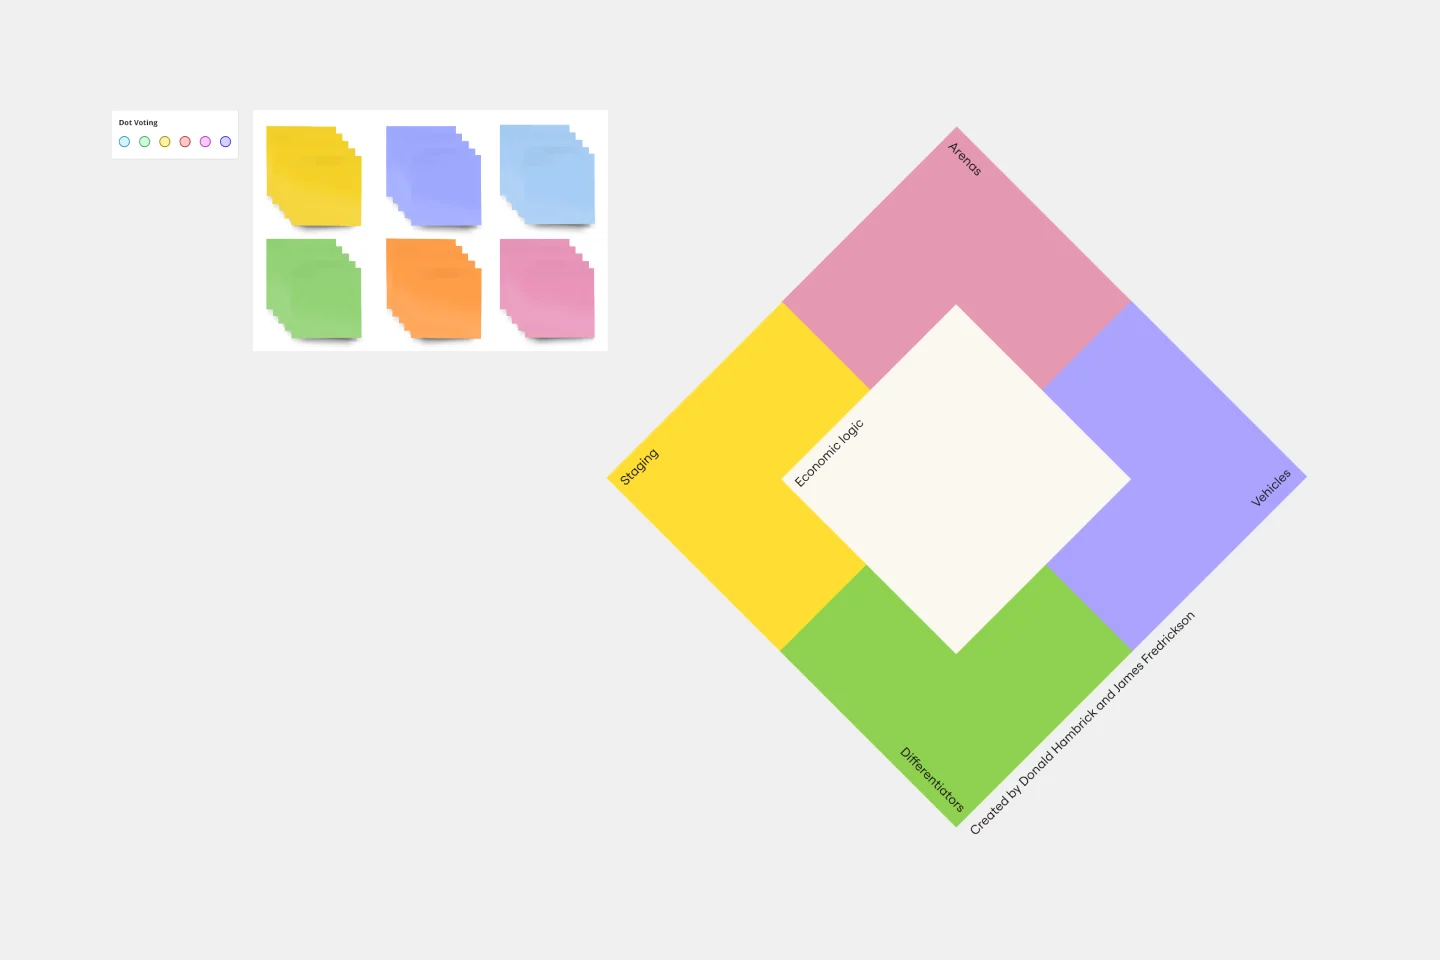
To achieve key objectives, every business assembles a series of strategies. But what elements should you consider when building a strategy? A strategy diamond is a collection of elements forming a coherent business strategy. These elements include: Arenas, Differentiators, Vehicles, Staging, and Economic Logic. Most strategic plans focus on just one or two of these elements, creating gaps that might cause problems for your business later on. A strategy diamond can help you stay focused and ensure you’re fulfilling all of your business’s needs rather than one or two.
Product Canvas Template
Works best for:
Desk Research, UX Design
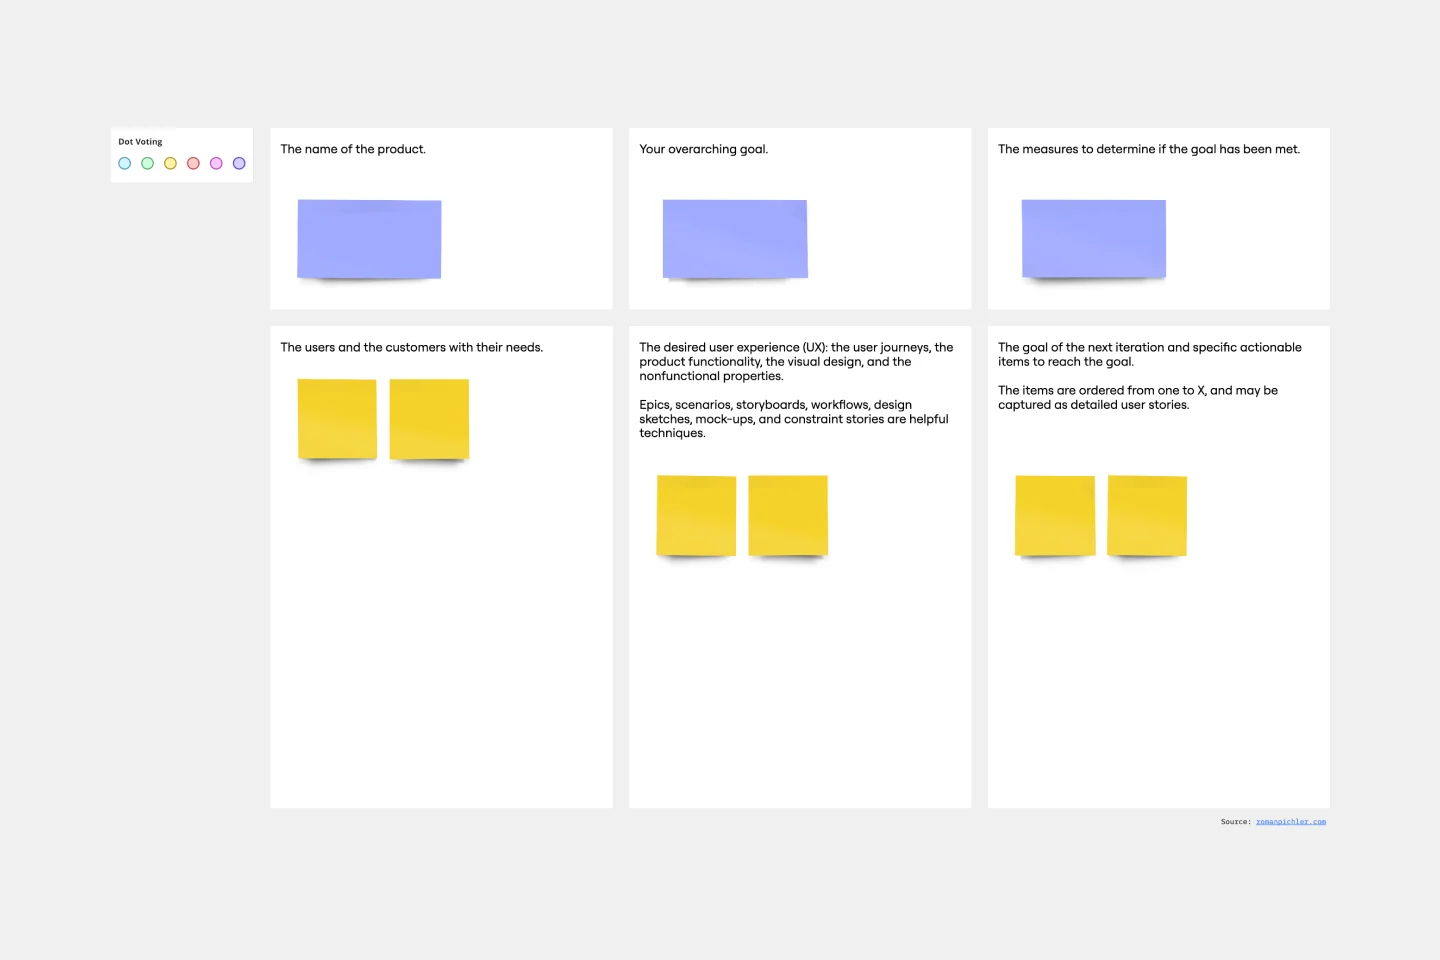
Product canvases are a concise yet content-rich tool that conveys what your product is and how it is strategically positioned. Combining Agile and UX, a project canvas complements user stories with personas, storyboards, scenarios, design sketches, and other UX artefacts. Product canvases are useful because they help product managers define a prototype. Creating a product canvas is an important first step in deciding who potential users may be, the problem to be solved, basic product functionality, advanced functionalities worth exploring, competitive advantage, and customers’ potential gain from the product.
Value Proposition Template
Works best for:
Strategy & Planning, Product Strategy
The Value Proposition Template is a framework that empowers businesses to articulate their offerings' core advantages. By breaking down an offering into its essential elements, this template ensures that stakeholders grasp the unique value a product or service brings to the market.

Product Brief Brainstorm Template
Works best for:
Product , Product Management
The Intelligent Product Brief Brainstorm template in Miro is crafted to supercharge your product development process. One standout benefit of this template is its AI-powered capabilities that elevate your brainstorming sessions. Not only does it help in organizing and capturing ideas, but it also provides additional insights and solutions, ensuring a thorough and innovative approach to problem-solving. This intelligent feature significantly cuts down the time spent on synthesizing information, allowing teams to concentrate on refining and implementing the best ideas, ultimately leading to more effective and efficient product development.

Four-Circle Venn Diagram
Works best for:
Venn Diagrams
The Four Circle Venn Diagram template offers a robust tool for detailed data comparison involving four sets. Use it to identify common and unique attributes across multiple categories. This template is perfect for complex analysis in research, strategic planning, and education. It helps visualize relationships clearly, making it easier to draw insights and communicate findings. Ideal for professionals and educators needing advanced comparative tools.

8 Different Ways to Organize Your Backlog
Works best for:
Agile
Explore 8 different techniques for managing and prioritizing work effectively with this template. From prioritization matrices to story mapping, it offers a comprehensive overview of backlog management strategies. By understanding the strengths and limitations of each approach, teams can tailor their backlog organization to optimize workflow, empowering teams to stay organized and focused on delivering value.