Community Building: A 5 Step Roadmap
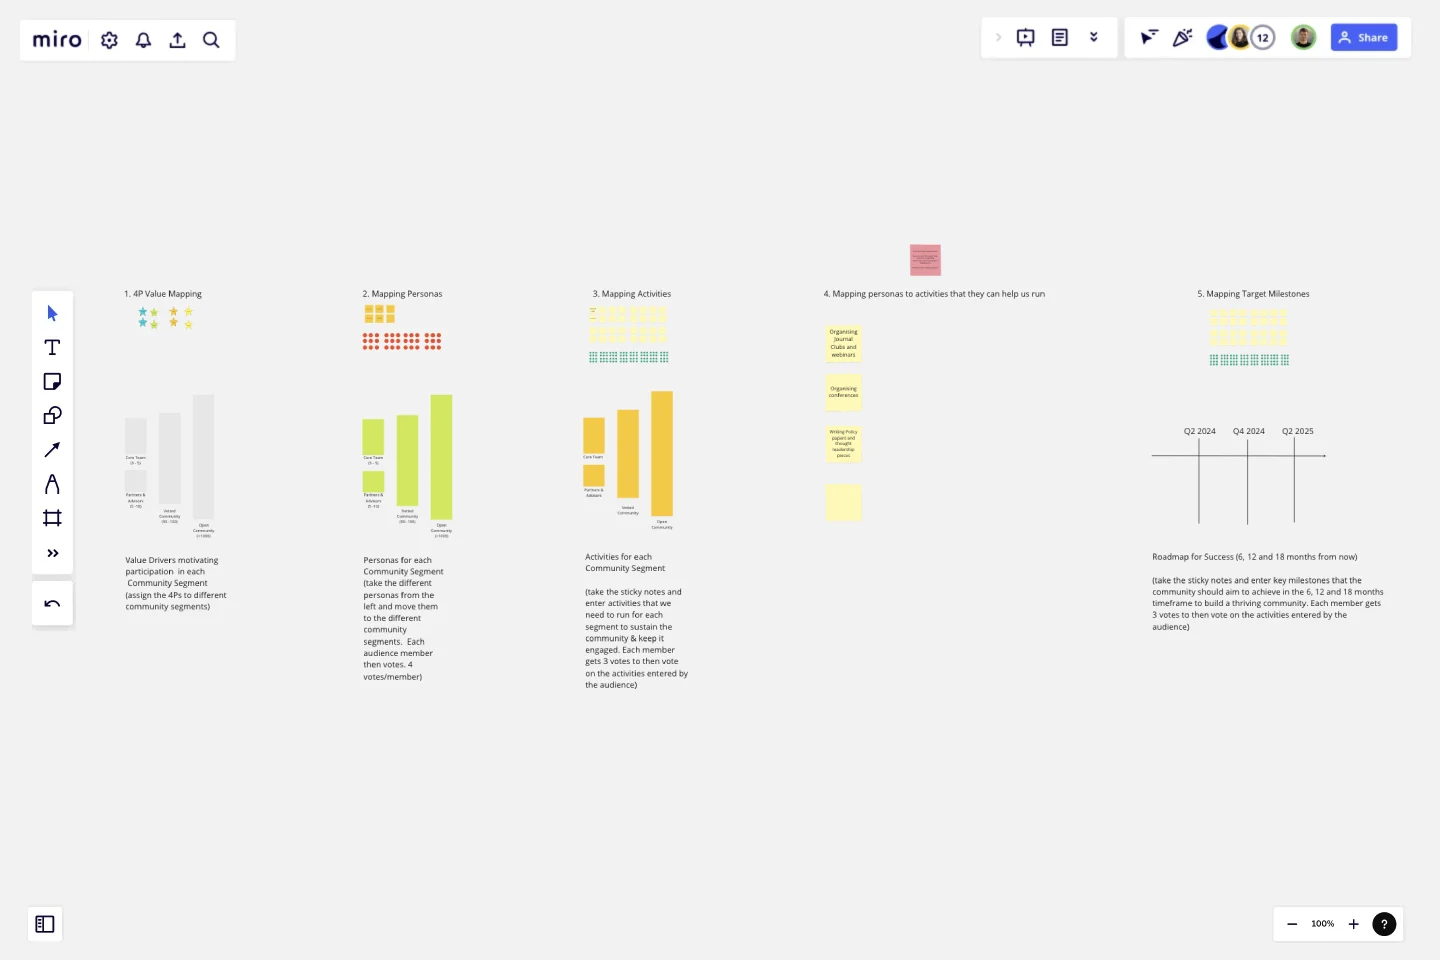
Use this five step process for building a community development roadmap.
Use this five step process for building a community development roadmap.
Start with a 4P value mapping for each of your community segments where you map the values that drive someone to be part of each community segment
Follow this by a persona mapping where you identify personas that you want as part of each community segment and map them to each
In the thirst step, based on the personas you mapped to each segment and the values you know will bring them to participate in their respective community segment, identify the activities that you need to run.
In the fourth step, you list all the activities you want to run, and identify the personas who can help you run those activities.
In the last and final step, based on the community building objectives you want to achieve, create a roadmap of activities, assigne ownership and transfer it into a roadmap.
With these 5 steps, and the template, you can run a workshop to align your team and organisation on an effective community development roadmap. All of these can be done in 2-3 sessions.
Recommended split:
Session 1: Step 1 and 2
Session 2: Step 3 and 4
Session 3: Step 5
Get started with this template right now.
Strategic Group Mapping Template
Works best for:
Mapping, Strategy
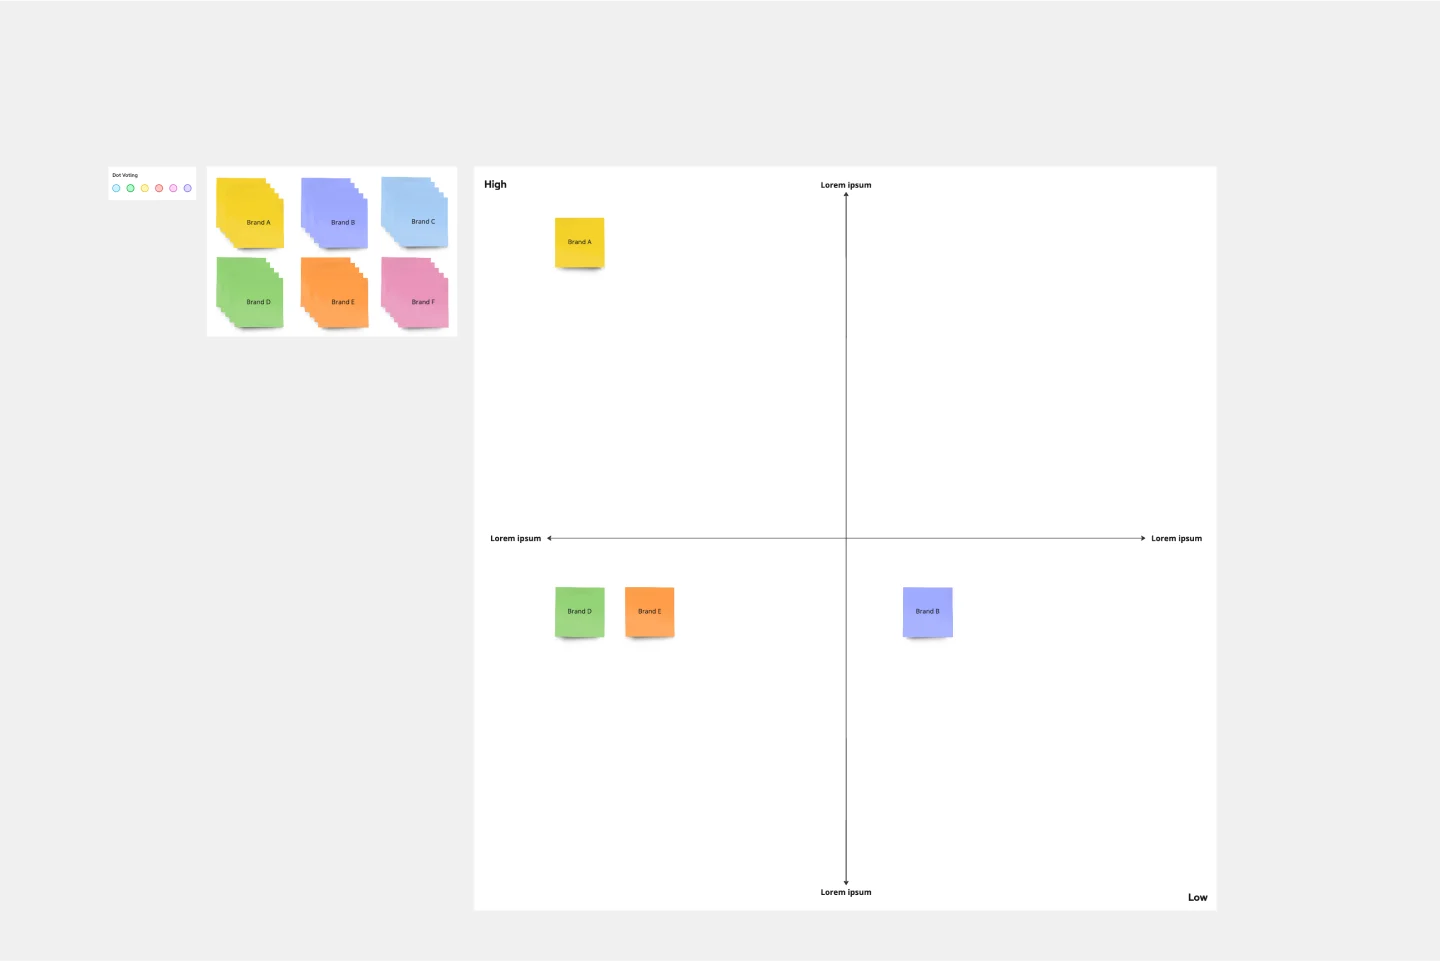
The Strategic Group Mapping Template is a cutting-edge visual tool designed to translate the competitive landscape of their industry. By allowing users to plot entities based on distinct criteria, this template provides an at-a-glance view of market dynamics. One standout benefit of using this tool is its ability to identify clusters of competitors and market gaps, paving the way for businesses to strategically position themselves for optimal success.
UML Sequence Deployment Pipeline Template
Works best for:
UML
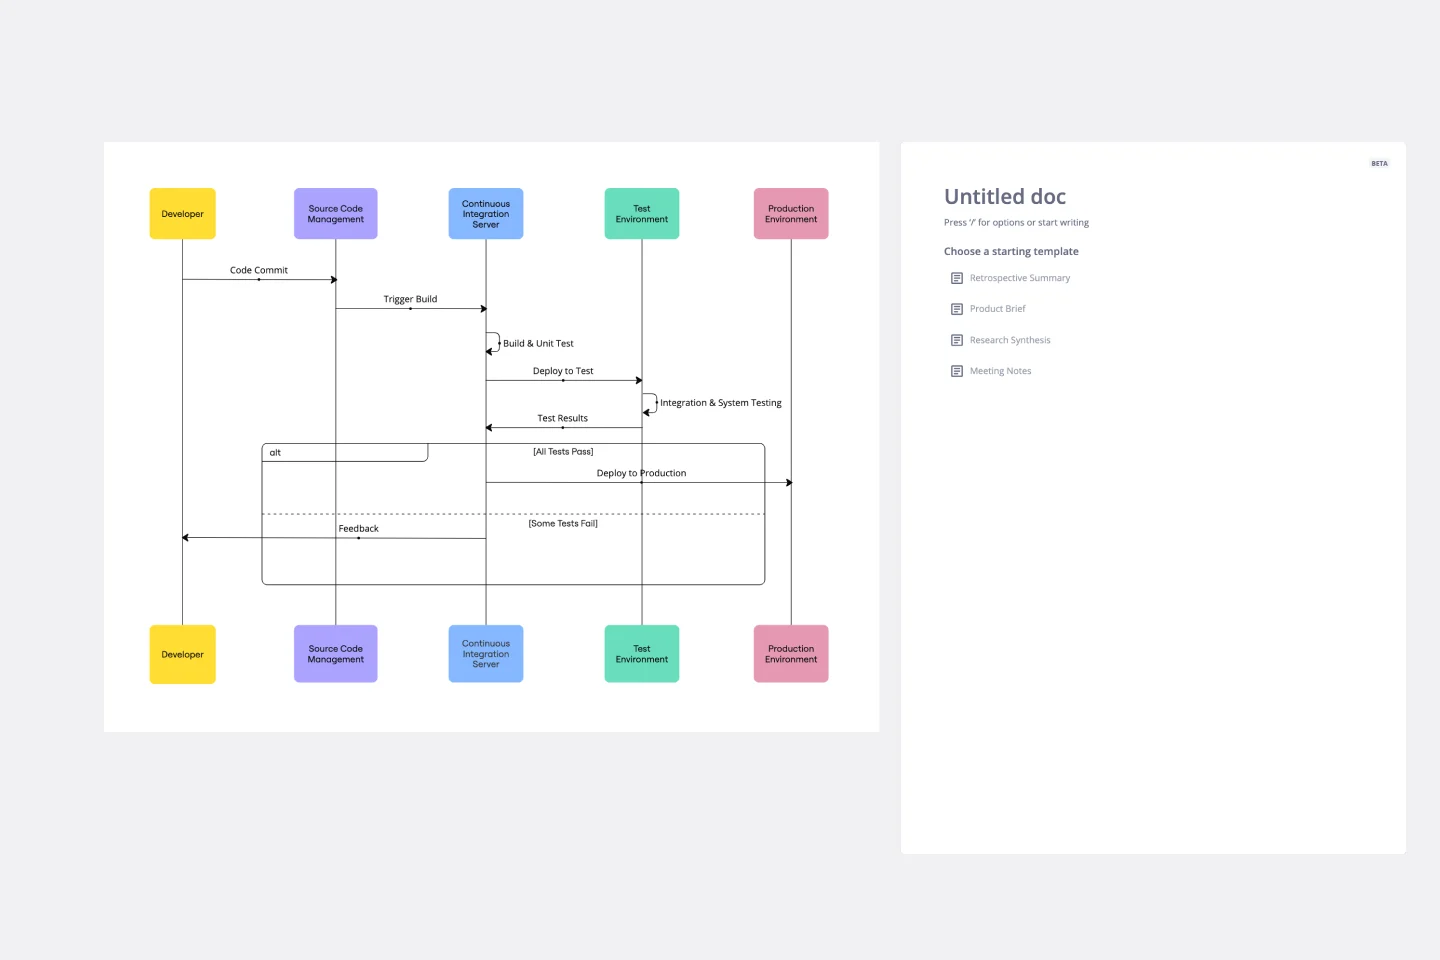
The UML Sequence Deployment Pipeline Template in Miro visually maps the sequence of steps in an automated deployment pipeline, helping teams in software development and deployment. It helps identify bottlenecks, standardizes the deployment process, and facilitates new member onboarding for continuous improvement.
Editorial Calendar Template
Works best for:
Marketing, Strategic Planning, Project Planning
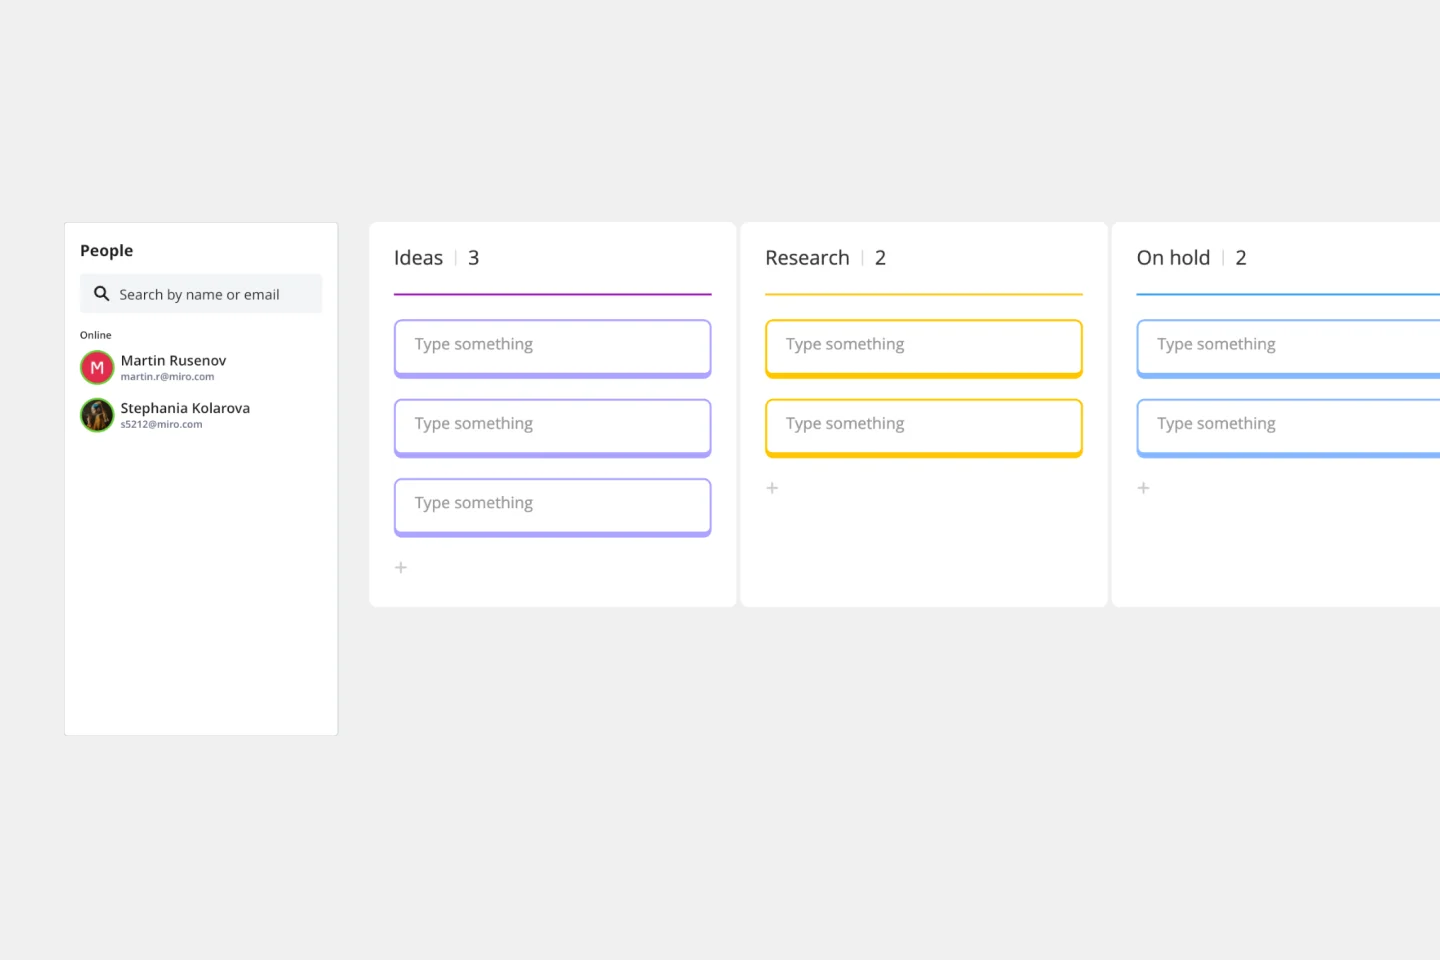
If your company is like most, content is a big thing. You create more of it (and a lot faster) than you create almost anything else. It includes blogs, newsletters, social media posts, ads, and more—and it requires ideating, writing, editing, and publishing. That’s why every content team needs an editorial calendar. The template will let you easily create a calendar that empowers your team to plan strategically, keep things organized (by content type, writer, channel, and delivery date), and finalize/post all content on schedule.
Technology Roadmap Template
Works best for:
Agile Methodology, Roadmaps, Agile Workflows
A technology roadmap helps teams document the rationale of when, why, how, and what tech-related solutions can help the company move forward. Also known as IT roadmaps, technology roadmaps show teams what technology is available to them, focusing on to-be-scheduled improvements. They allow you to identify gaps or overlap between phased-out tech tools, as well as software or programs soon to be installed. From a practical point of view, the roadmap should also outline what kinds of tools are best to spend money on, and the most effective way to introduce new systems and processes.

How to Create Product Roadmap
Works best for:
Product Management, Roadmap
Learn to craft effective product plans with the How to Create Product Roadmap by Mark V. Smetanin. This template guides you through outlining key milestones, setting priorities, and visualizing your product journey. Use it to align your team, maintain focus, and achieve strategic goals. Ideal for product managers and teams looking for a structured approach to product development and clear communication with stakeholders.

🎯 Product Roadmap Template
Works best for:
Product Management, Roadmap
Plan your product journey with the Product Roadmap by Petra Ivanigova. This template helps you outline key milestones, set priorities, and visualize your development path. Use it to align your team, ensure everyone is focused on the same goals, and keep stakeholders informed. Ideal for product managers and teams looking to streamline their planning process and achieve strategic objectives efficiently.