Fishbone RCA
Organizing your team with this Fishbone Diagram template in your next Root Cause Analysis is a systematic way to identify and solve problems.
Organizing your team with this Fishbone Diagram template in your next Root Cause Analysis is a systematic way to identify and solve problems. Also known as the Ishikawa diagram, this technique provides a visual approach to understanding the root causes of complicated issues.
Overview of the Root Cause Analysis: Fish Diagram Template
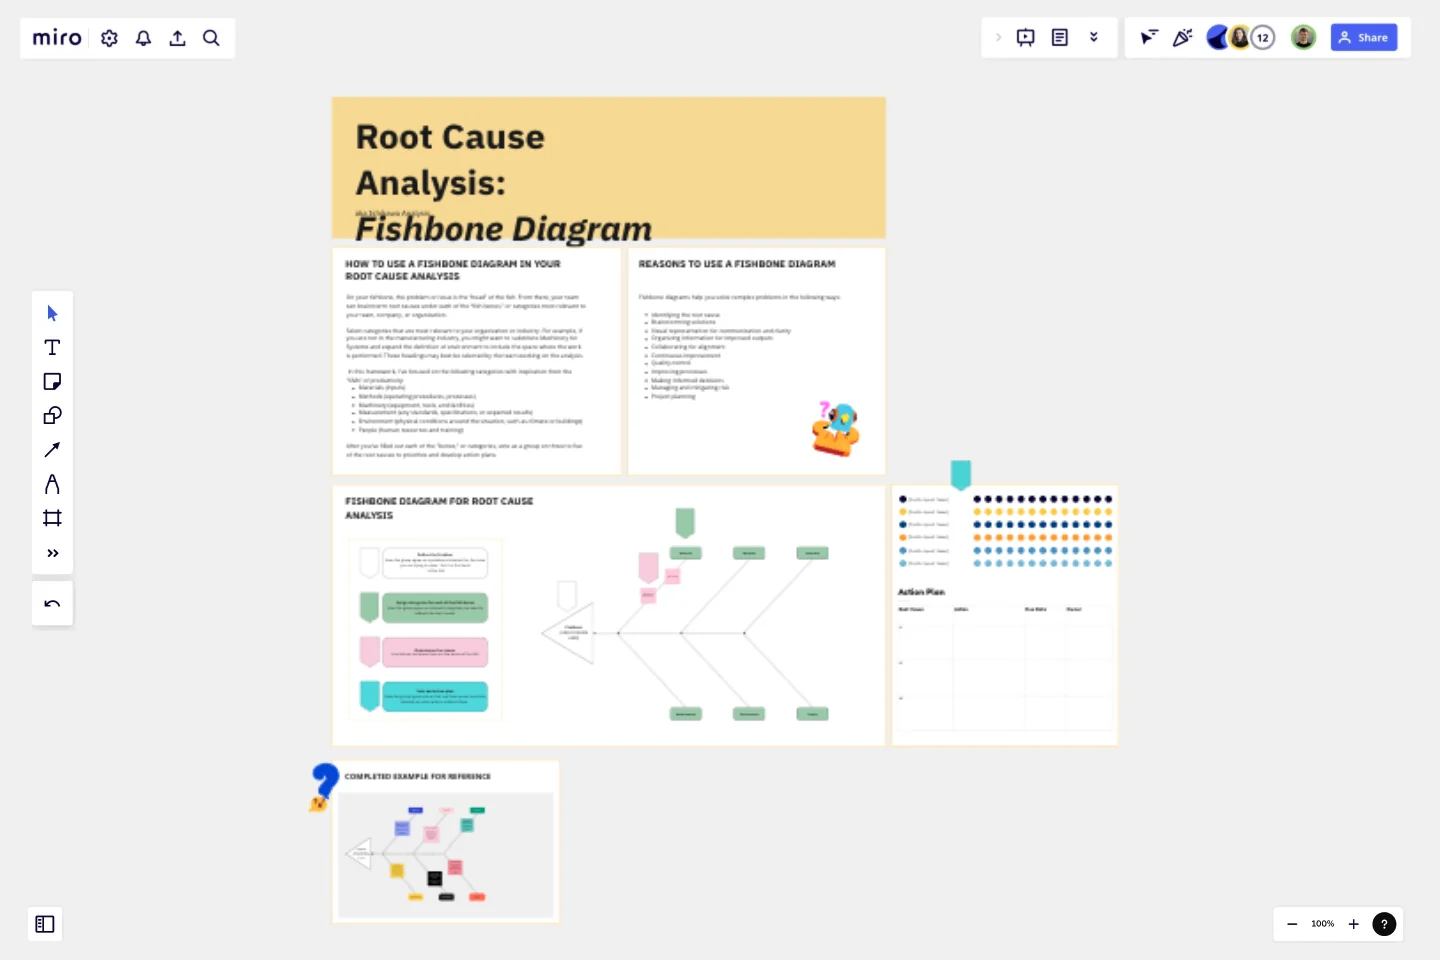
The Fish Diagram is a visual representation of causal relationships, designed to uncover the underlying factors that contribute to a problem. Named after its resemblance to a fish's skeleton, the diagram segments a problem’s causes into different categories, such as People, Process, Equipment, Materials, Environment, and Management. By mapping out these categories, the Fish Diagram offers a holistic view of the issue, helping your team to identify the root cause.
Benefits of the Fish Diagram Template
Visual clarity: The Fish Diagram presents causes and their relationships visually, which facilitates a clear understanding of complex issues for individuals and teams.
Comprehensive analysis: The segmented categories ensure that all potential causes are explored, preventing oversight and leading to a thorough analysis.
Interdisciplinary collaboration: The diagram's structure encourages cross-functional collaboration, bringing together diverse expertise to address the issue.
Identifying root causes: By systematically mapping causes, the Fish Diagram enables the identification of the central issue, resulting in targeted solutions.
How to use the Fish Diagram Methodology
Define the problem: Begin by clearly defining the problem you're analyzing. This precise definition serves as a reference point throughout the process.
Work within the Fish Diagram: Attach your problem statement at the "head" of the fish within the template. Then, select relevant categories to label the "bones" extending from the spine (People, Process, etc.).
Brainstorm causes: Collaboratively brainstorm potential causes within each category, attaching them as branches to the corresponding diagonal lines.
Analyze relationships: Evaluate how causes within different categories might interact or contribute to the problem, adding sub-branches as needed.
Identify the root cause: Examine the diagram to identify the underlying factors that appear most influential. This will help you pinpoint the root cause.
Develop solutions: Based on the root cause, devise strategies to address the issue effectively. Ensure that solutions address the specific categories and sub-causes highlighted on the diagram.
Final thoughts
Whether you're working on a manufacturing issue, a project delay, the solution to a change request or a customer service concern, the Fish Diagram empowers you to see the bigger picture and take targeted action. With this Fish Diagram, you can steer your problem-solving efforts toward effective and lasting solutions with your team.
Get started with this template right now.
Visual Story Map Template
Works best for:
Marketing, Desk Research, Mapping
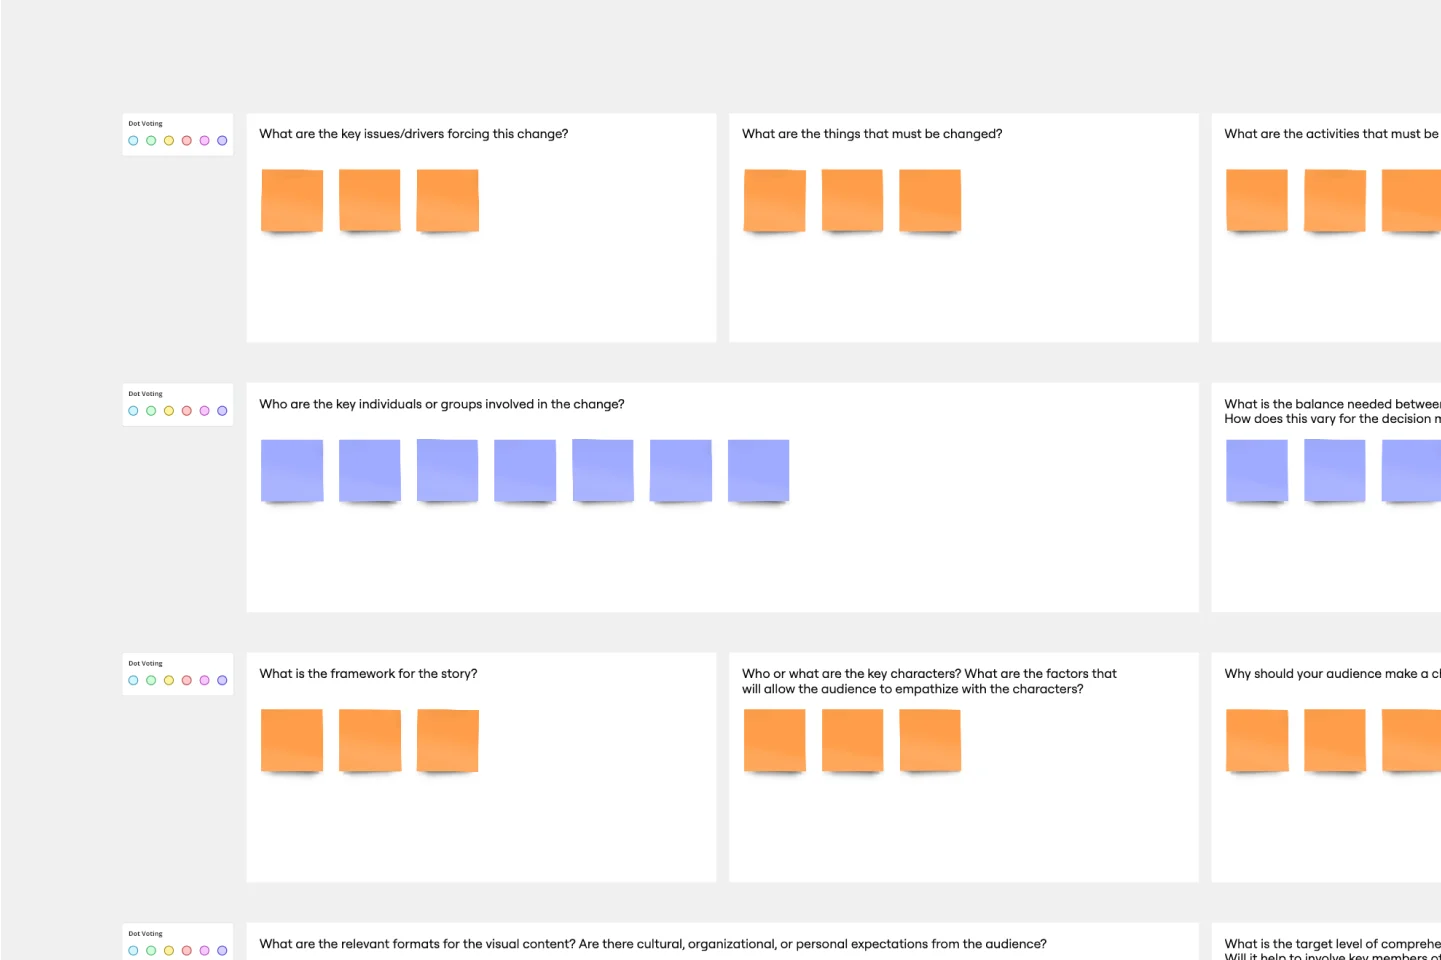
Some people like to think of a visual story map as a stylized to-do list, but it’s a lot more powerful than that. Visual story mapping allows your product management team to visualize multiple dimensions of information.
OODA Loop Template
Works best for:
Strategic Planning, Strategy
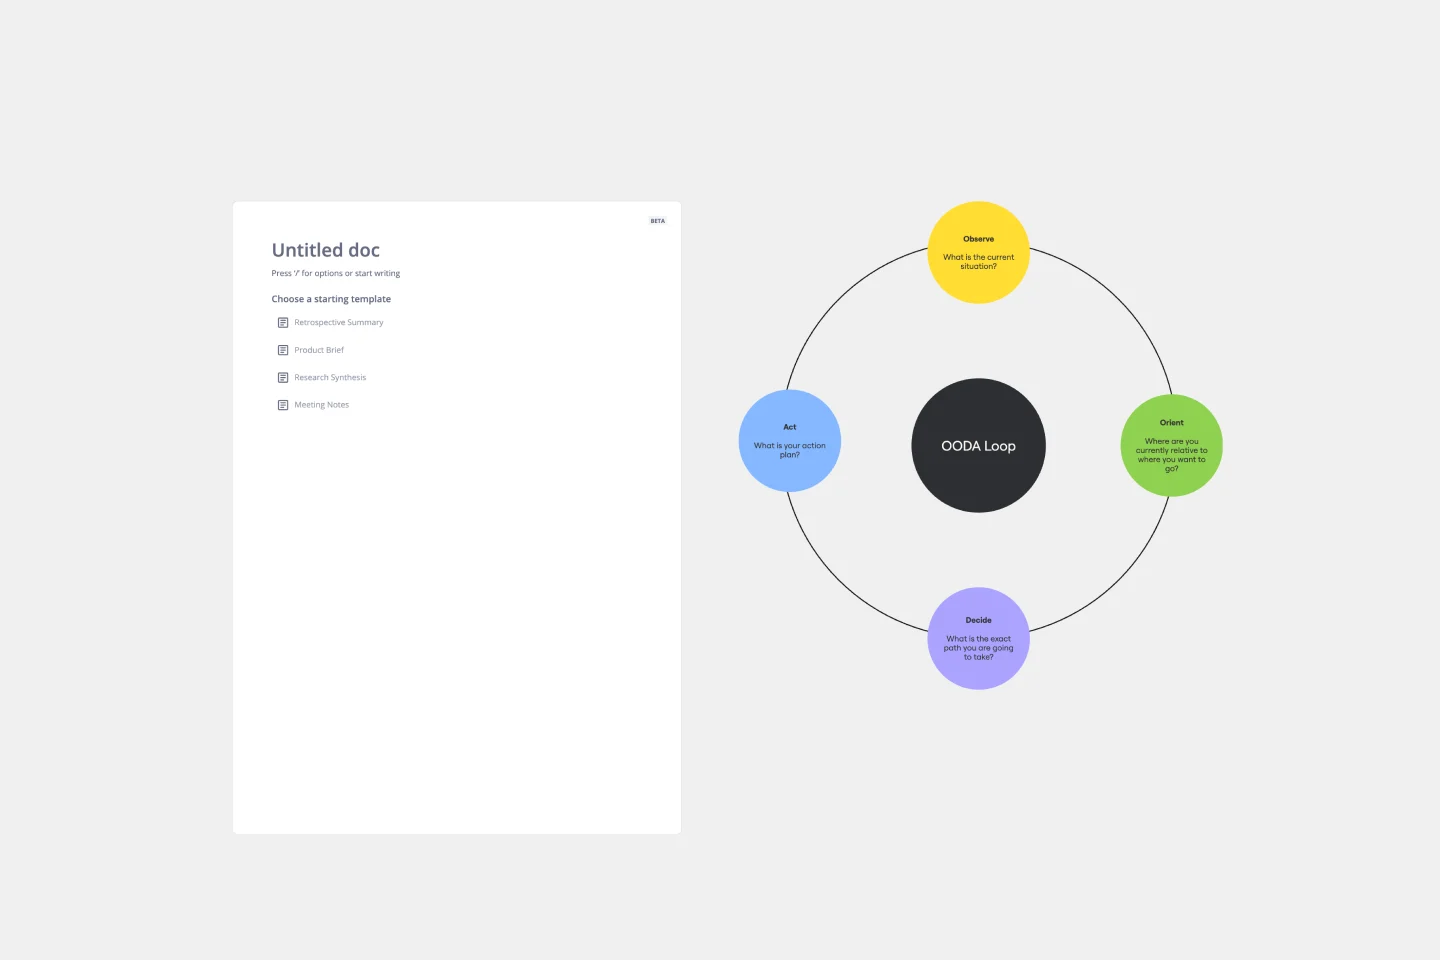
The OODA Loop template helps optimize decision-making processes by using four key stages- Observe, Orient, Decide, and Act. Its well-structured layout allows teams to systematically break down complex decisions, leading to a shared understanding of the decision-making workflow. One of the key benefits of the template is its ability to enhance collaboration. Teams can seamlessly contribute to and iterate upon the decision-making cycle in real time, resulting in more informed decisions and a more efficient process. The template provides a clear and visual representation of each stage, accelerating the decision-making process and fostering a collaborative environment where teams can work together to navigate challenges and make well-informed decisions.
Ansoff Matrix Template
Works best for:
Leadership, Operations, Strategic Planning
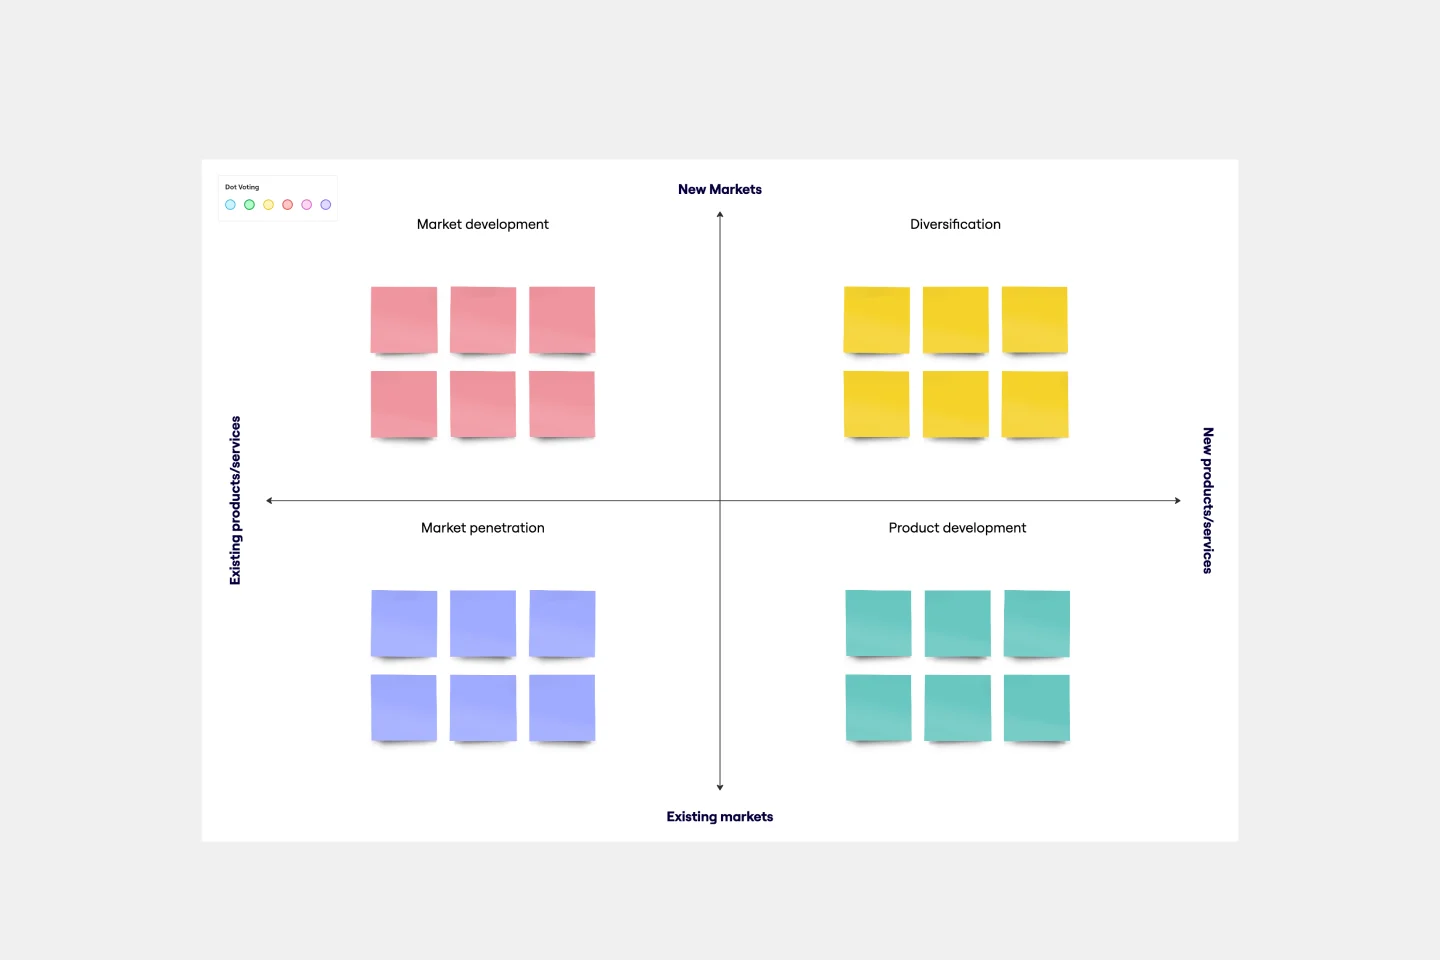
Keep growing. Keep scaling. Keep finding those new opportunities in new markets—and creative new ways to reach customers there. Sound like your approach? Then this template might be a great fit. An Ansoff Matrix (aka, a product or market expansion grid) is broken into four potential growth strategies: Market Penetration, Market Development, Product Development, and Diversification. When you go through each section with your team, you’ll get a clear view of your options going forward and the potential risks and rewards of each.
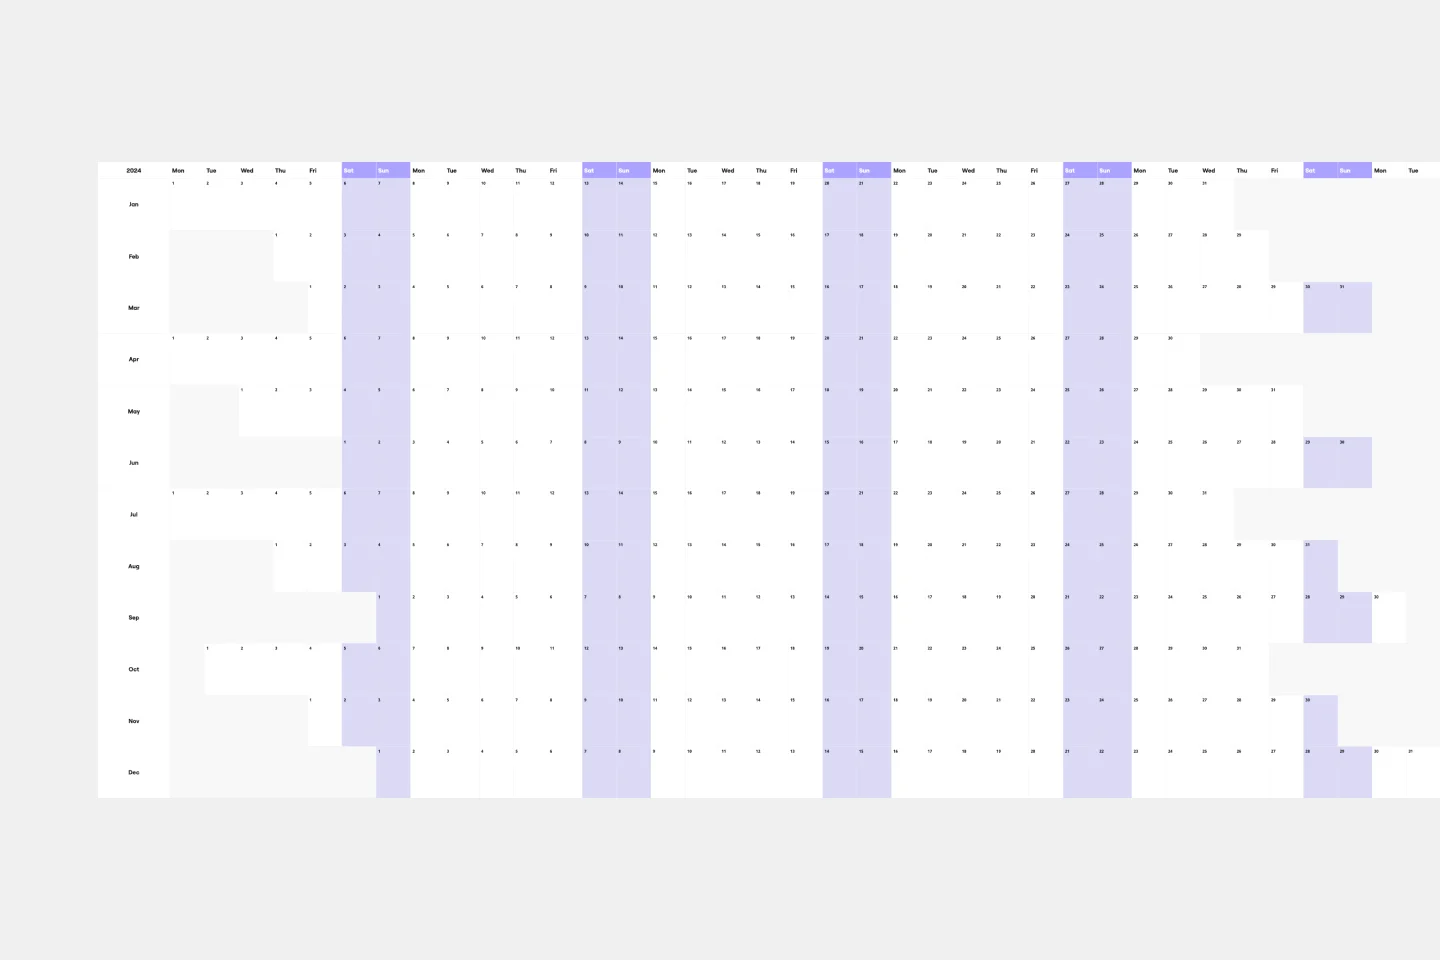
Annual Calendar Template
Works best for:
Business Management, Strategic Planning, Project Planning
Plenty of calendars help you focus on the day-to-day deadlines. With this one, it’s all about the big picture. Borrowing from the grid structure of 12-month wall calendars, this template shows you your projects, commitments, and goals one full year at a time. So you and your team can prepare to hunker down during busy periods, move things around as needed, and celebrate your progress. And getting started is so easy—just name your calendar’s color-coded streams and drag stickies onto the start date.

Product Market Fit Board
Works best for:
Product Management, Planning
The Product Market Fit Board template helps product teams assess and validate product-market fit. By capturing user feedback, analyzing market trends, and tracking key metrics, this template enables teams to evaluate product-market alignment objectively. With sections for defining target segments, identifying pain points, and prioritizing features, it guides teams through the process of optimizing product-market fit. This template serves as a tool for iteratively refining products to meet customer needs and drive market success.
Timeline Meeting
Works best for:
Timeline, Planning
The Timeline Meeting template is tailored for planning and conducting meetings with a focus on time management. It helps you set clear agendas, allocate time for each topic, and keep track of discussion points. This template ensures your meetings are productive and stay on track.