Fishbone Diagram for Quality Control
The Fishbone Diagram for Quality Control template is a specialized tool designed to help quality control teams systematically analyze and identify the root causes of quality-related issues.
The Fishbone Diagram for Quality Control template is a specialized tool designed to help quality control teams systematically analyze and identify the root causes of quality-related issues. Here’s why you should consider using this template:
Key Features:
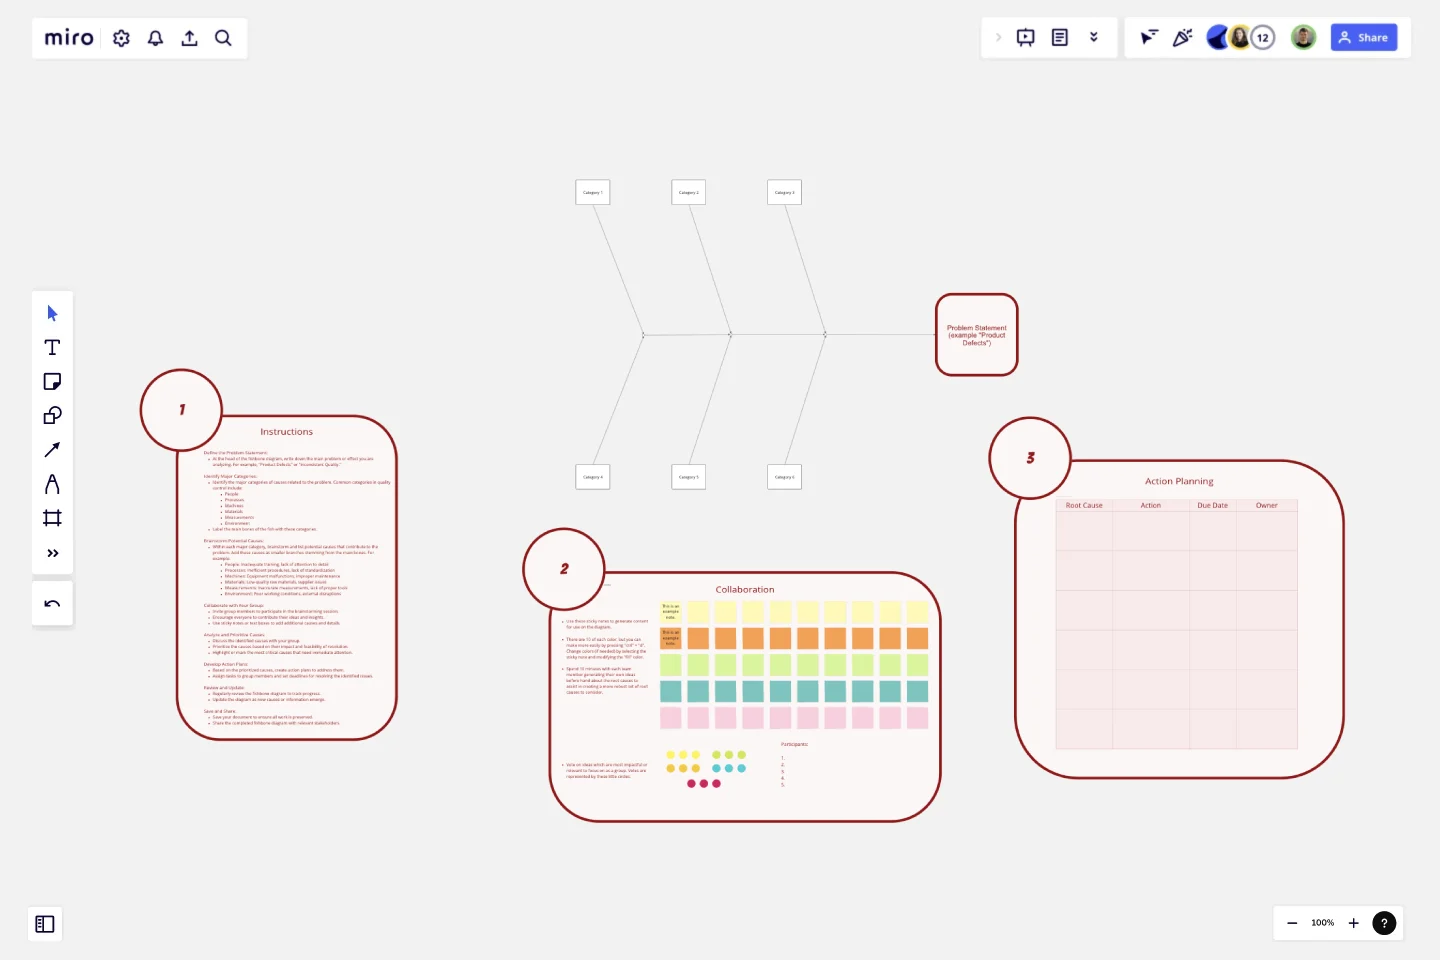
Problem-Centric Design:
The diagram starts with a clear definition of the problem or effect you are addressing, such as "Product Defects" or "Inconsistent Quality," providing a focused approach to problem-solving.
Major Categories:
The template includes predefined categories relevant to quality control, such as People, Processes, Machines, Materials, Measurements, and Environment. These categories help in organizing potential causes systematically.
Structured Brainstorming:
Each category has branches for listing potential causes, encouraging thorough brainstorming and ensuring that no aspect of the quality control process is overlooked.
Collaborative Framework:
The template is designed for team collaboration, allowing multiple users to contribute their insights and ideas in a structured manner, fostering a comprehensive analysis.
Visual Clarity:
The fishbone (Ishikawa) diagram's visual structure makes it easy to understand the relationships between the problem and its potential causes, facilitating better communication and discussion among team members.
Why Use This Template?
Systematic Problem Analysis:
The Fishbone Diagram for Quality Control template helps in systematically breaking down complex problems into manageable parts, making it easier to identify root causes.
Holistic View:
By considering multiple categories, the template ensures that all possible aspects of the quality control process are examined, leading to a more thorough investigation.
Improved Collaboration:
The template promotes team collaboration, ensuring that diverse perspectives are considered, which can lead to more innovative solutions and a better understanding of the problem.
Enhanced Decision-Making:
The structured approach of the template aids in prioritizing causes based on their impact, helping teams focus on the most critical areas first, thus improving decision-making and action planning.
Effective Communication:
The visual nature of the fishbone diagram makes it easier to communicate findings and strategies to stakeholders, ensuring that everyone is on the same page.
By using the Fishbone Diagram for Quality Control template, teams can effectively analyze quality control issues, identify root causes, and develop targeted action plans to improve product quality and process consistency.
Get started with this template right now.
Flyer Maker Template
Works best for:
Design, Marketing
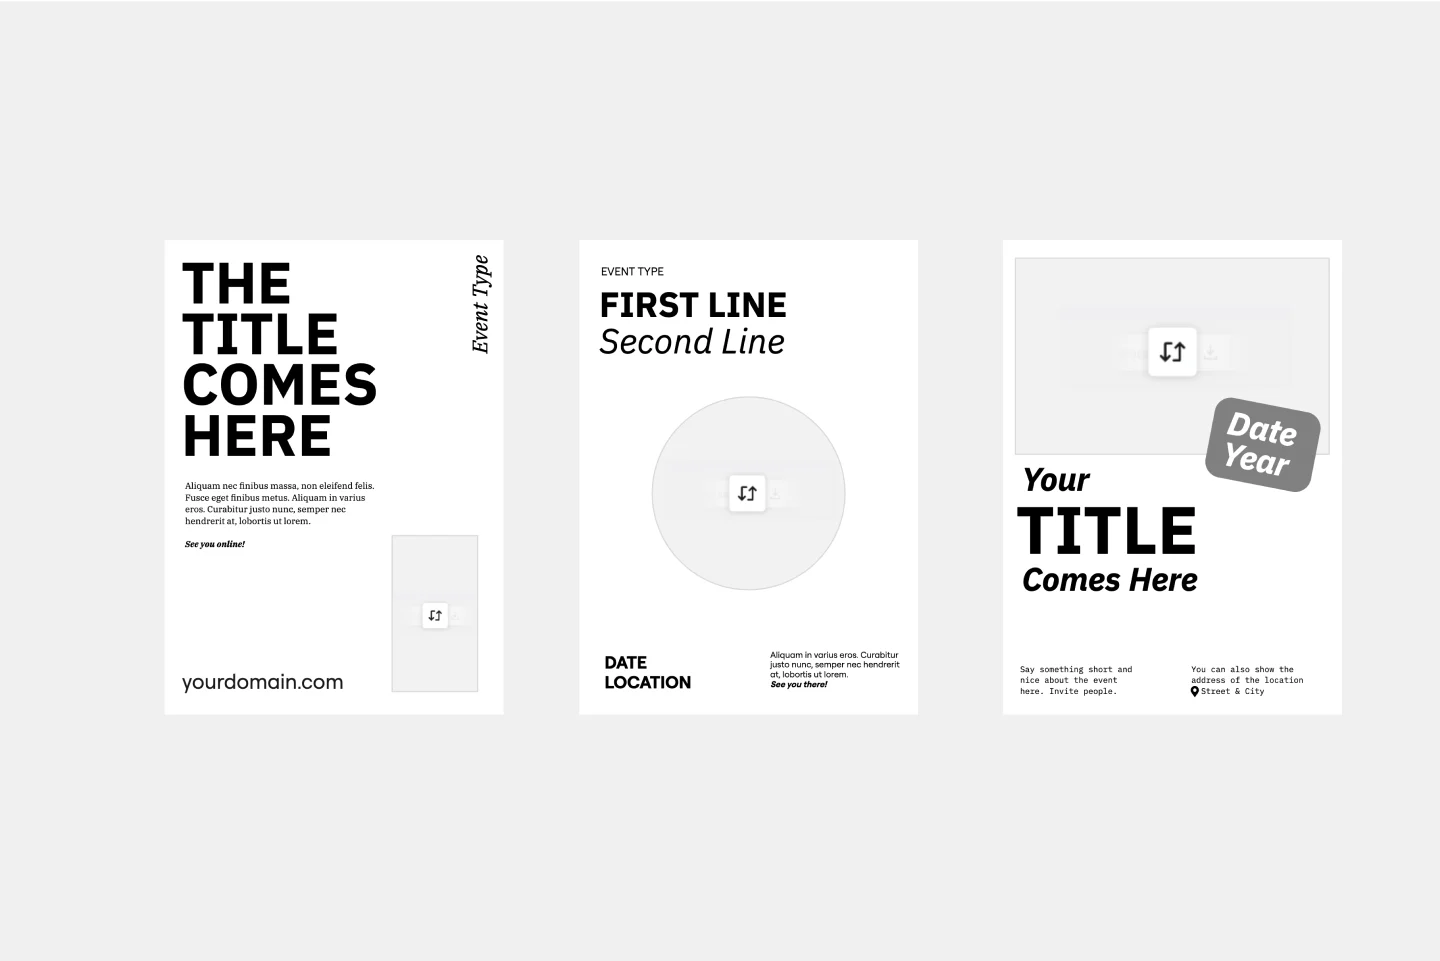
Whether it’s a client party or a nonprofit fundraiser, your event needs one key thing to be a smashing success: people to show up. That’s why promoting it is such an important part of the planning—and creating and sending a flyer is the first step. These single-page files will grab your guests’ attention and give them the key details, such as the time, date, and location (and if it’s a fundraiser, who/what the funds will benefit). This template will let you lay out text and customize a flyer design.
Buyer Persona Template
Works best for:
Marketing, Desk Research, User Experience
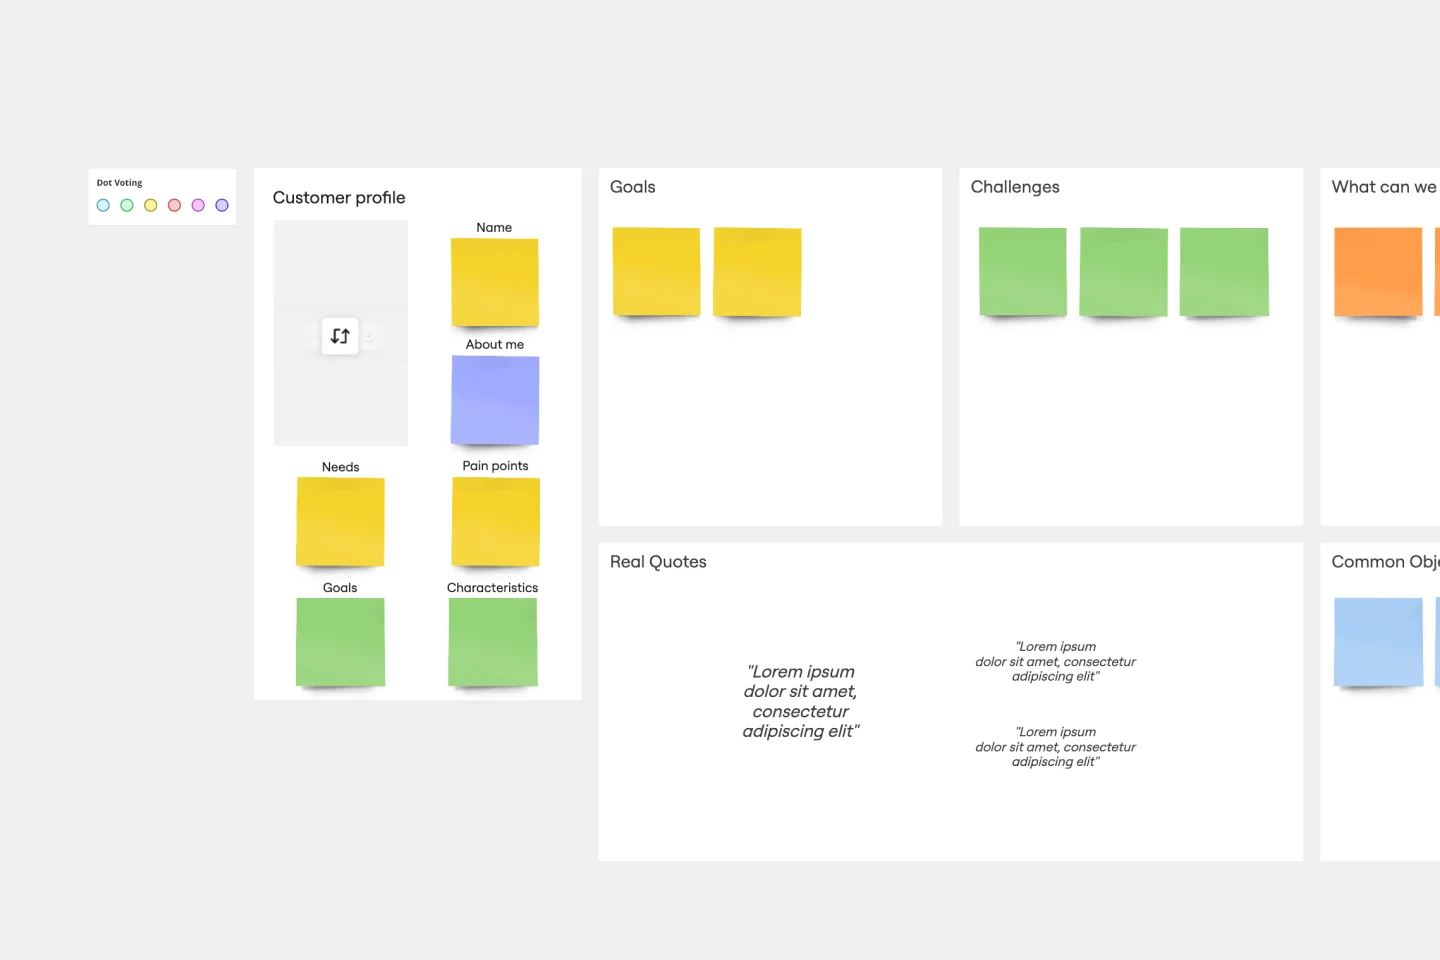
You have an ideal customer: The group (or few groups) of people who will buy and love your product or service. But to reach that ideal customer, your entire team or company has to align on who that is. Buyer personas give you a simple but creative way to get that done. These semi-fictional representations of your current and potential customers can help you shape your product offering, weed out the “bad apples,” and tailor your marketing strategies for serious success.
ERD Healthcare Management System Template
Works best for:
ERD
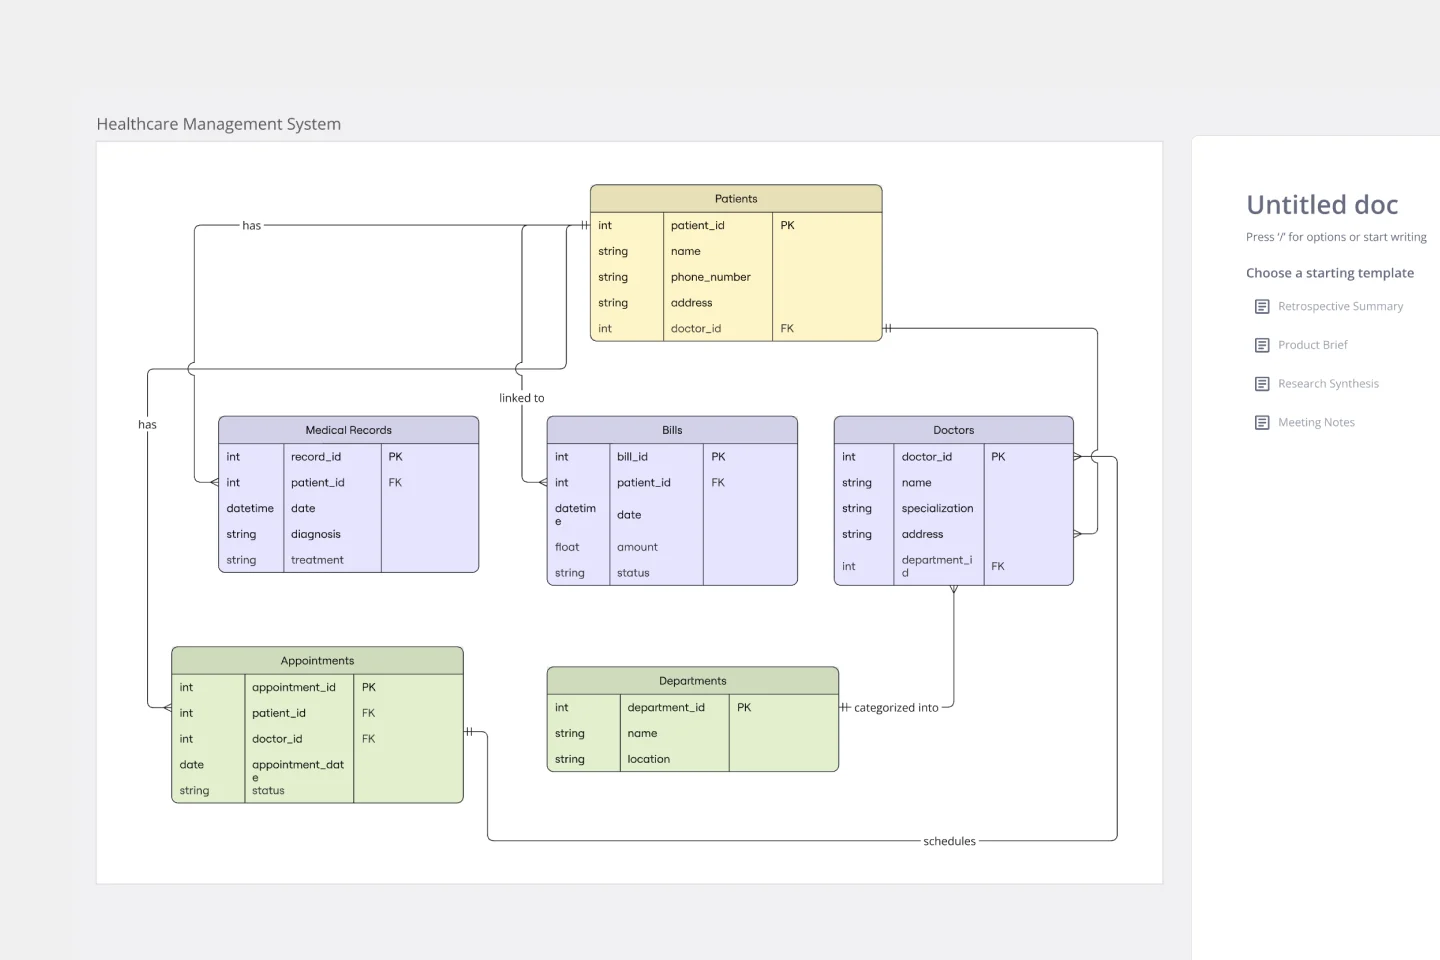
The ERD Healthcare Management System Template streamlines the process of creating and managing entity-relationship diagrams for healthcare management systems. This template helps users visualize the complex relationships between different entities such as patients, healthcare providers, medical records, and billing information. It offers a flexible and customizable framework that can be adapted to fit the specific needs of any healthcare management system, ensuring clarity and efficiency in system design and database structure.
Weekly Schedule Template
Works best for:
Planning, Project Management
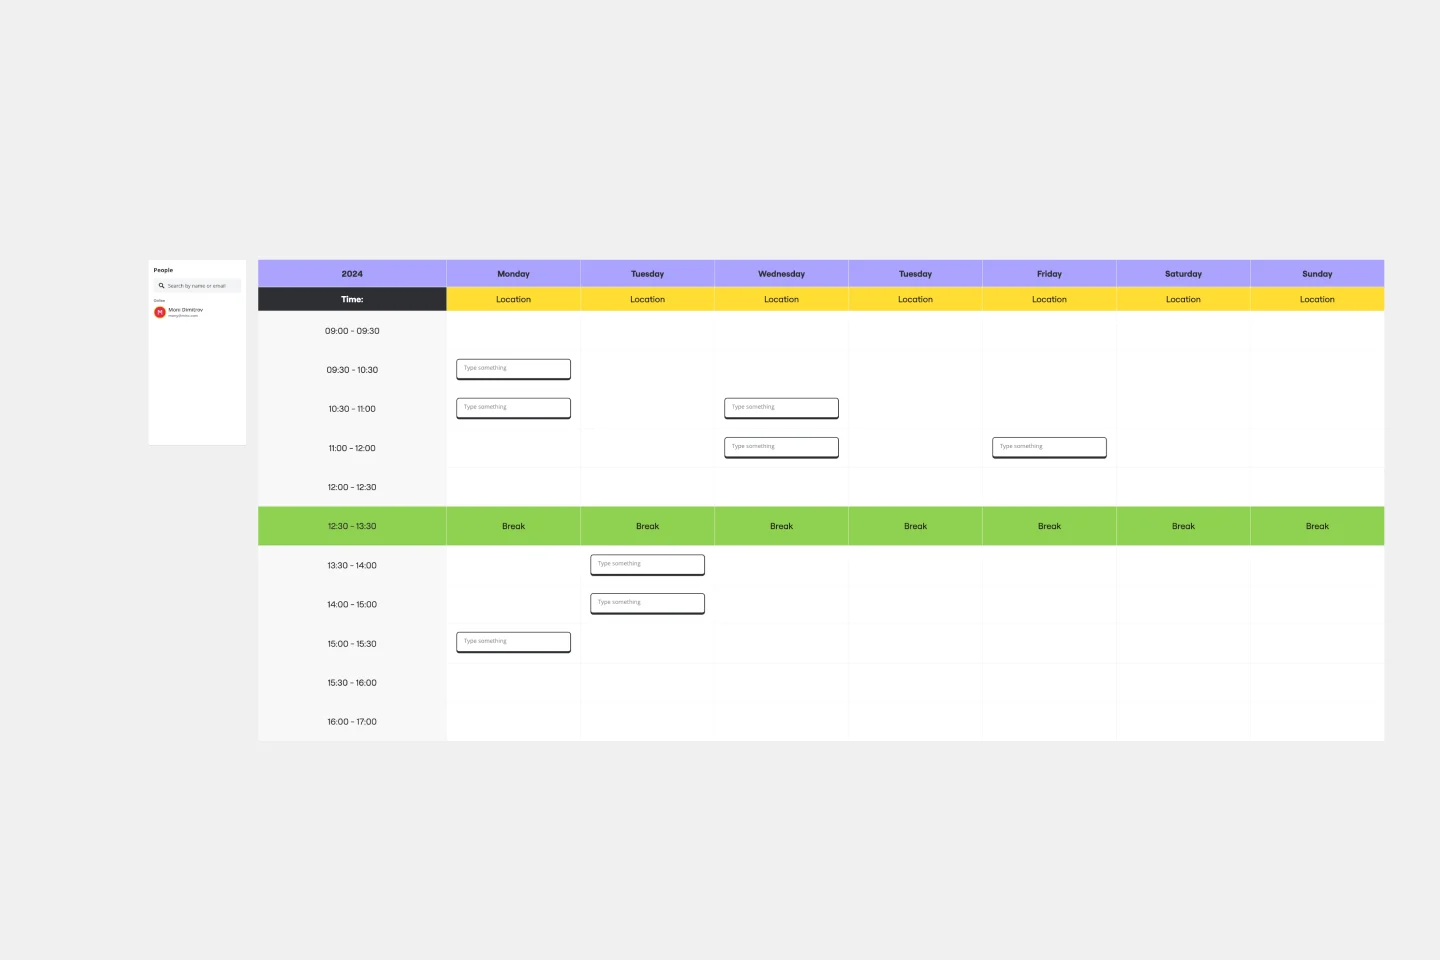
The Weekly Schedule Template is a powerful tool that makes it easy for users to manage their time effectively. Specifically designed for weekly planning, this template provides a visual guide for organizing tasks, events, and activities. Its most notable feature is its ability to prioritize and allocate time systematically throughout the week. This unique flexibility ensures that users have a comprehensive overview of their schedule and can adjust it as needed to meet changing priorities and goals. With this template, people can achieve a well-organized and balanced week, promoting increased productivity and focus.
Product Positioning Template
Works best for:
Marketing, Product Management, Desk Research
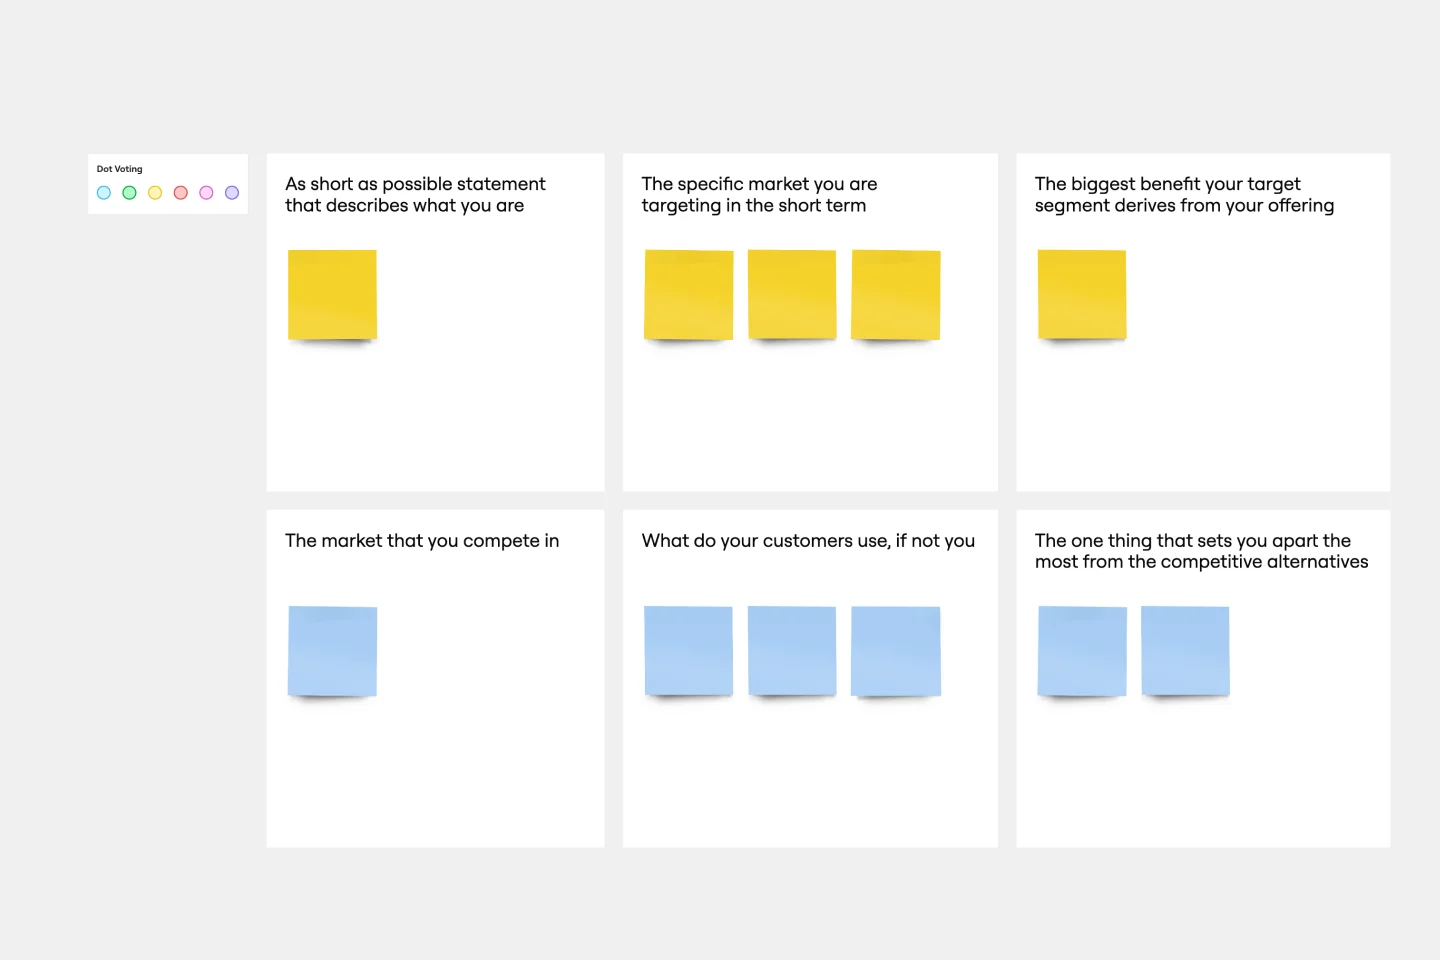
For better or for worse, your company’s chances for success hinge partially on your market. As such, before you start building products and planning strategies, it’s a good idea to conduct a product positioning exercise. A product positioning exercise is designed to situate your company and your offering within a market. The product positioning template guides you to consider key topics such as defining your product and market category, identifying your target segment and competitors, and understanding your key benefits and differentiation.
ERD Supply Chain Management System Template
Works best for:
ERD
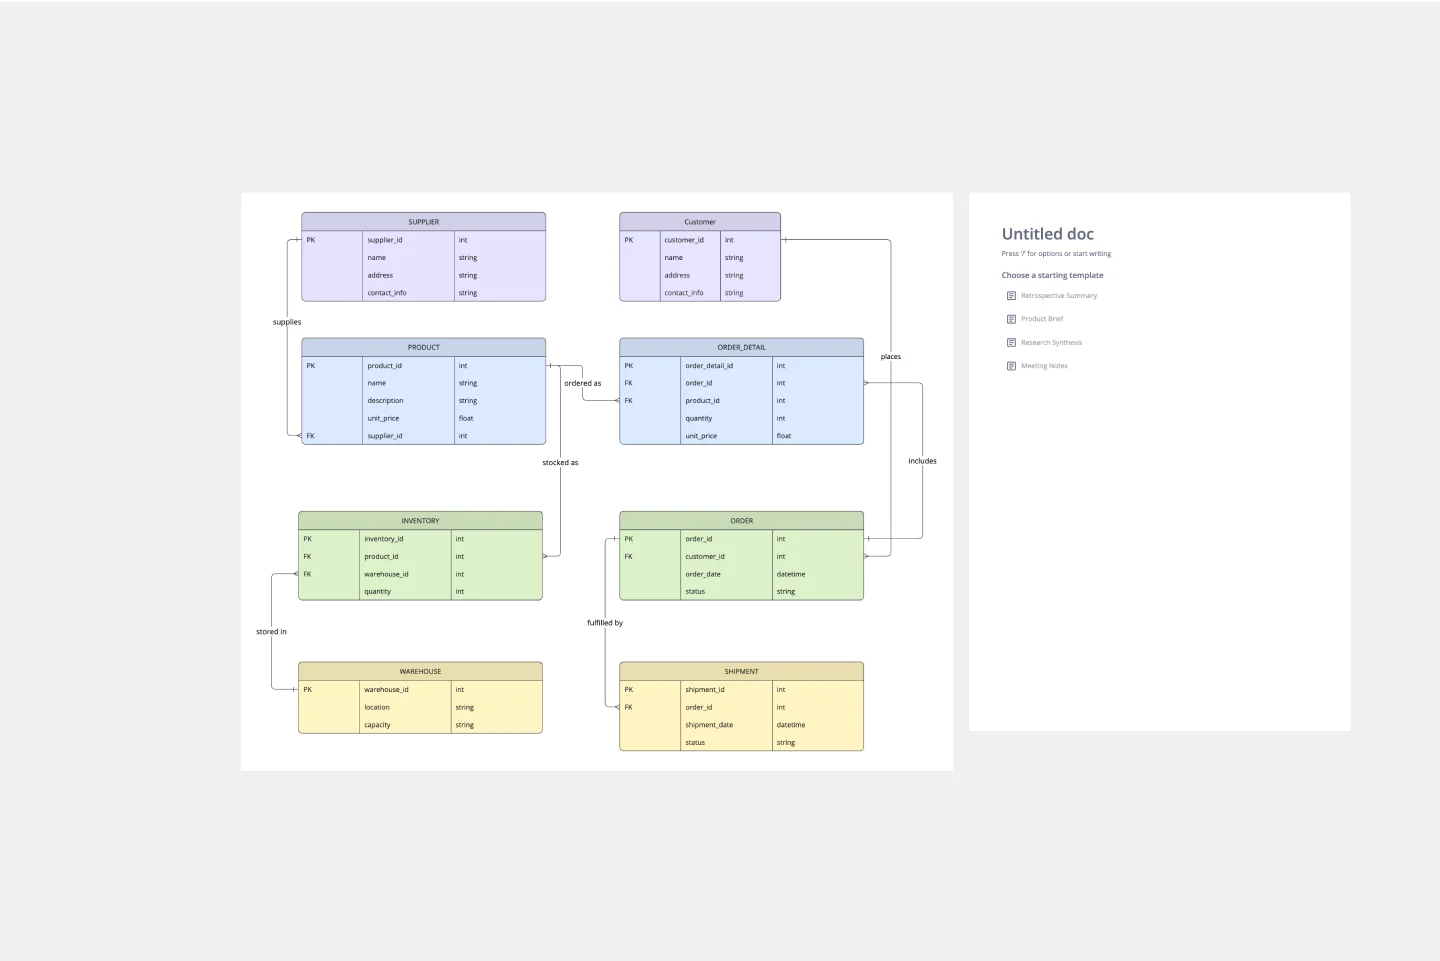
The ERD Supply Chain Management System Template streamlines and optimizes supply chain operations. It serves as a visual support that helps businesses understand and manage the complex relationships between different entities within their supply chain, such as suppliers, products, inventory, orders, and shipments. By providing a clear visualization of these relationships, the template enables users to identify inefficiencies and areas for improvement, facilitating strategic decision-making.