Fishbone Diagram for Service Improvement
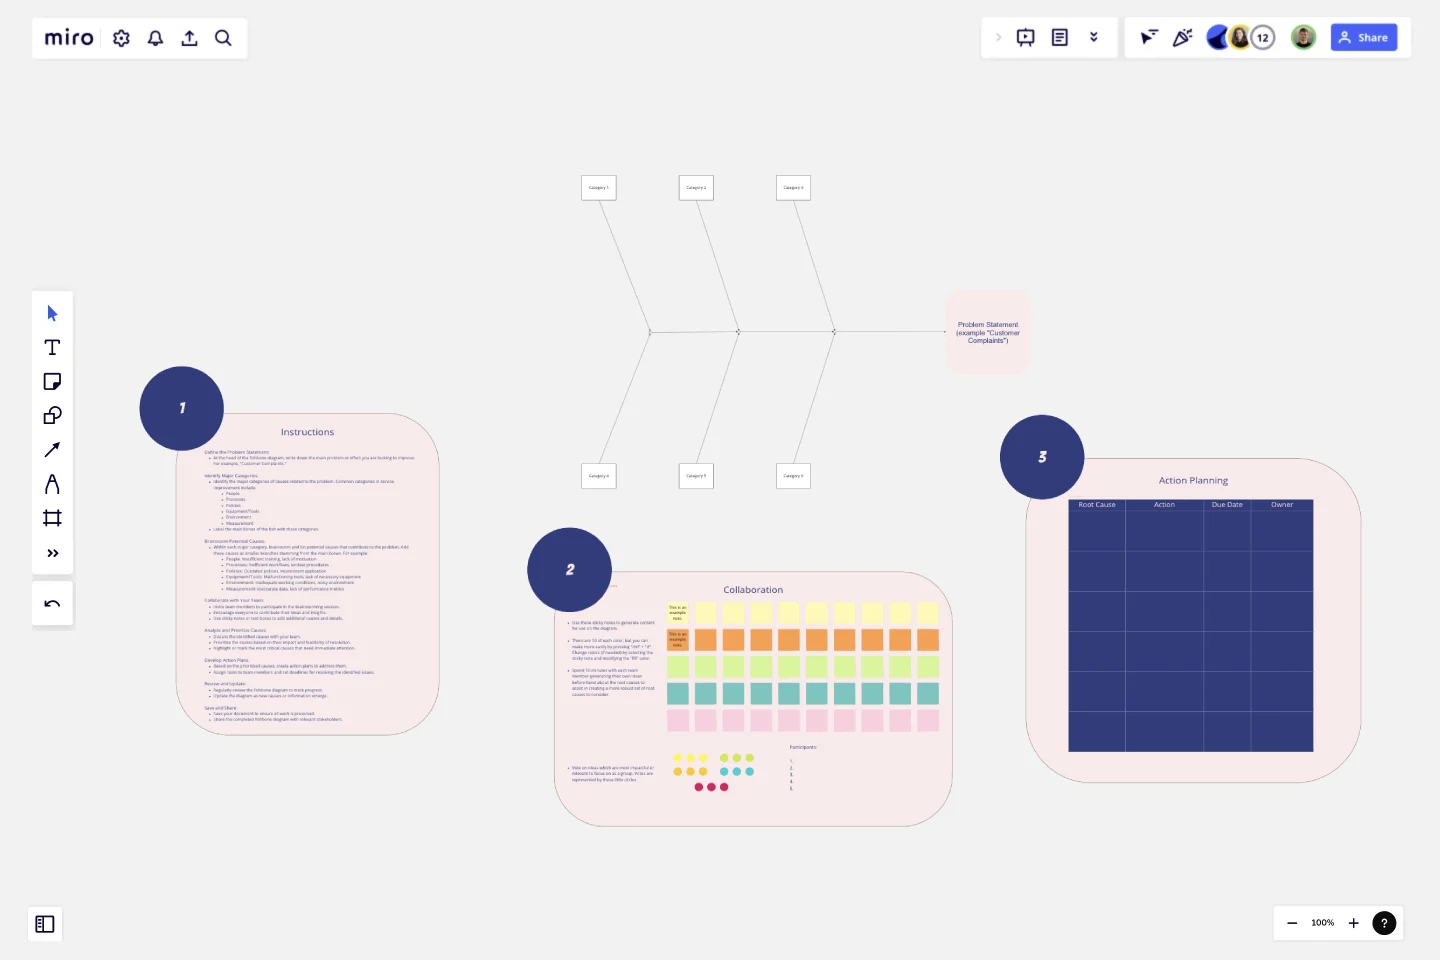
The Fishbone Diagram for Service Improvement template is a structured tool designed to help teams systematically analyze and identify the root causes of service-related issues.
The Fishbone Diagram for Service Improvement template is a structured tool designed to help teams systematically analyze and identify the root causes of service-related issues. Here’s why you should consider using this template:
Key Features:
Problem-Centric Design:
The diagram starts with a clear definition of the problem or effect you are addressing, such as "Customer Complaints" or "Service Delays," providing a focused approach to problem-solving.
Major Categories:
The template includes predefined categories relevant to service improvement, such as People, Processes, Policies, Equipment/Tools, Environment, and Measurement. These categories help in organizing potential causes systematically.
Structured Brainstorming:
Each category has branches for listing potential causes, encouraging thorough brainstorming and ensuring that no aspect of the service process is overlooked.
Collaborative Framework:
The template is designed for team collaboration, allowing multiple users to contribute their insights and ideas in a structured manner, fostering a comprehensive analysis.
Visual Clarity:
The fishbone (Ishikawa) diagram's visual structure makes it easy to understand the relationships between the problem and its potential causes, facilitating better communication and discussion among team members.
Why Use This Template?
Systematic Problem Analysis:
The Fishbone Diagram for Service Improvement template helps in systematically breaking down complex problems into manageable parts, making it easier to identify root causes.
Holistic View:
By considering multiple categories, the template ensures that all possible aspects of the service process are examined, leading to a more thorough investigation.
Improved Collaboration:
The template promotes team collaboration, ensuring that diverse perspectives are considered, which can lead to more innovative solutions and a better understanding of the problem.
Enhanced Decision-Making:
The structured approach of the template aids in prioritizing causes based on their impact, helping teams focus on the most critical areas first, thus improving decision-making and action planning.
Effective Communication:
The visual nature of the fishbone diagram makes it easier to communicate findings and strategies to stakeholders, ensuring that everyone is on the same page.
By using the Fishbone Diagram for Service Improvement template, teams can effectively analyze service issues, identify root causes, and develop targeted action plans to improve service quality and customer satisfaction.
Get started with this template right now.
Service Blueprint
Works best for:
Research & Design
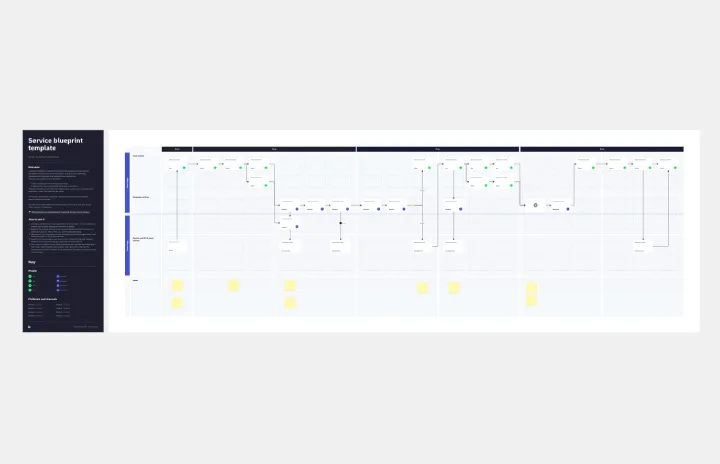
The Service Blueprint template is perfect for visualizing the orchestration of service components. It maps out frontstage and backstage elements, helping you analyze and enhance customer experiences. Use this template to align teams, identify pain points, and streamline processes, ensuring a seamless service delivery. It's ideal for creating a shared understanding of service dynamics among stakeholders and collaborators.
Hiring Process Timeline
Works best for:
Timeline, Planning
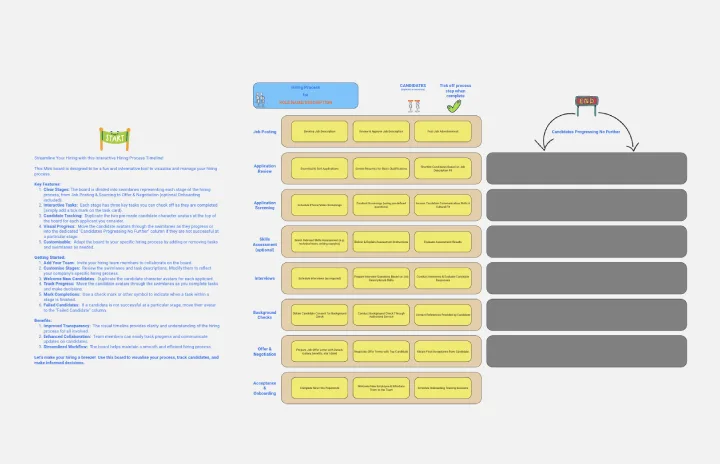
Simplify your hiring process with the Hiring Process Timeline template. This tool helps you map out each step of your recruitment process, from job posting to onboarding. Visualize deadlines, track candidate progress, and ensure a smooth and efficient hiring experience. Perfect for HR teams looking to streamline and enhance their recruitment strategy.

Product Reflection
Works best for:
Product Management, Planning
The Product Reflection template encourages teams to reflect on past experiences and lessons learned in product development journeys. By facilitating retrospective sessions, capturing insights, and identifying improvement opportunities, this template fosters a culture of continuous learning and improvement. With sections for evaluating successes, challenges, and areas for growth, it enables teams to iterate on their processes and enhance future product development efforts. This template serves as a tool for fostering team collaboration and driving iterative product innovation.
All-in-one PI Planning
Works best for:
Agile
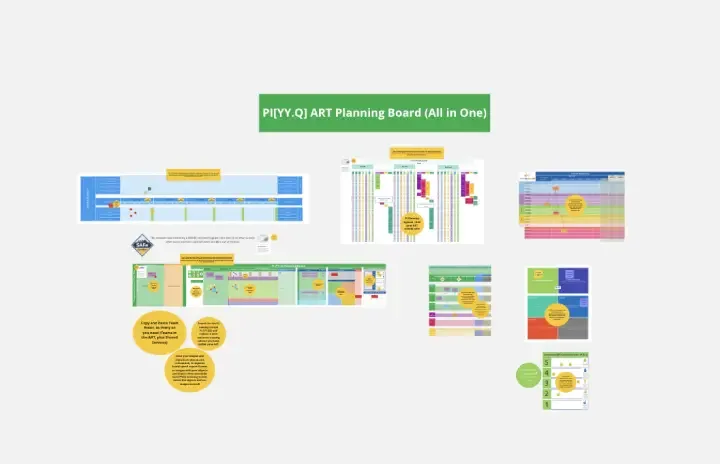
The All-in-one PI Planning template streamlines the SAFe Program Increment (PI) Planning process by providing a comprehensive framework for teams to collaboratively plan and align on objectives and dependencies. It integrates essential elements such as PI Objectives, Team Breakouts, and Program Board, enabling teams to visualize, prioritize, and coordinate work effectively. This template empowers Agile Release Trains to deliver value predictably and efficiently, driving alignment and synchronization across the organization.
Entity–Relationship Diagram (ERD) HR Management System Template
Works best for:
ERD
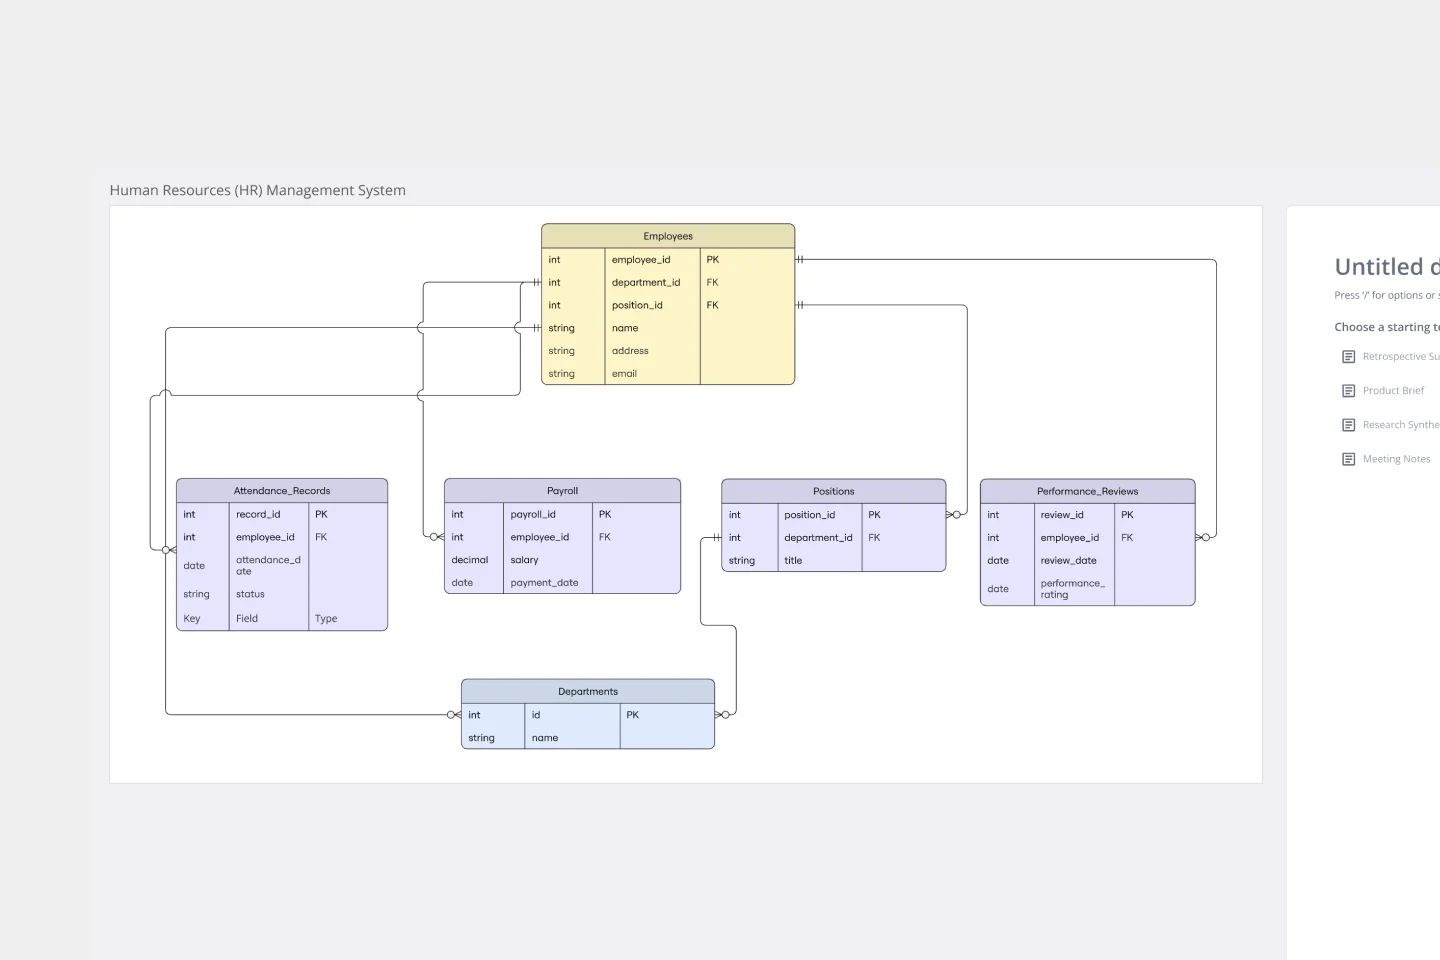
The Entity–Relationship Diagram (ERD) HR Management System Template in Miro is designed to streamline the management of employee-related information and processes within an organization. This template allows for the visualization and organization of complex HR systems, making it easier to understand relationships and processes. It enables users to map out departments, positions, and employee details, including attendance records, payroll, and performance reviews.
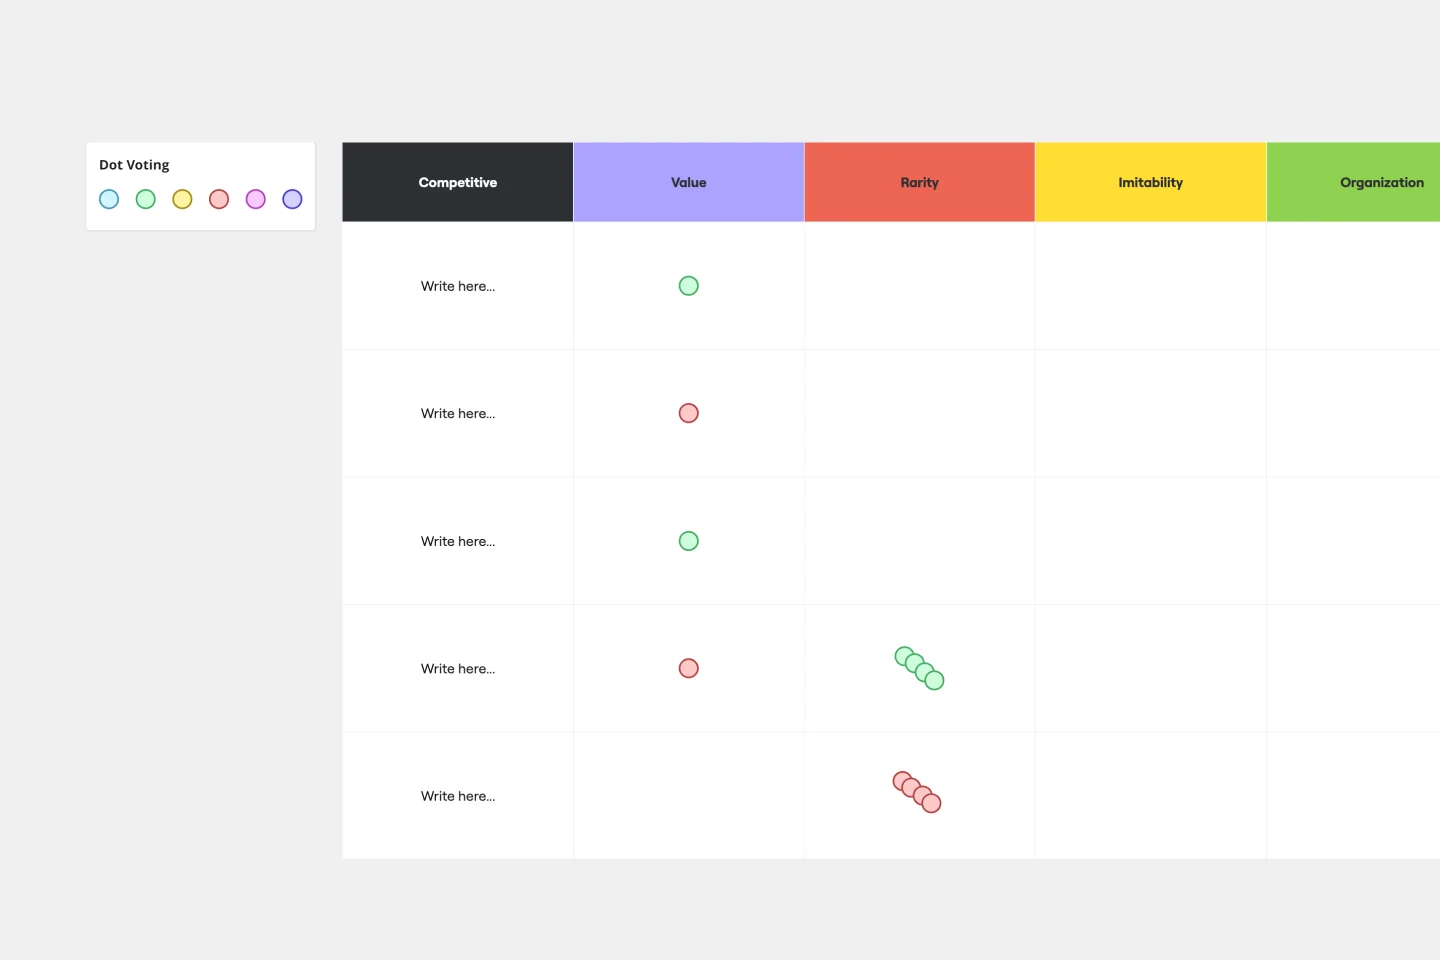
VRIO Analysis Template
Works best for:
Diagramming, Strategy
The VRIO Analysis Template is a framework that helps businesses evaluate their resources and capabilities for competitive advantage. It categorizes resources into four areas: Value, Rarity, Imitability, and Organization. This provides a comprehensive view of an organization's strengths and potential weaknesses. The template has the key benefit of offering quick visual insights. Decision-makers can immediately identify and focus on resources that are valuable, rare, hard to imitate, and well-organized. This ensures a sustainable competitive edge and saves time by avoiding lengthy textual analyses.