Expanded Service Blueprint
It uses Miro's table widget so that you can easily reorder columns and merge cells across columns (as the example shows).
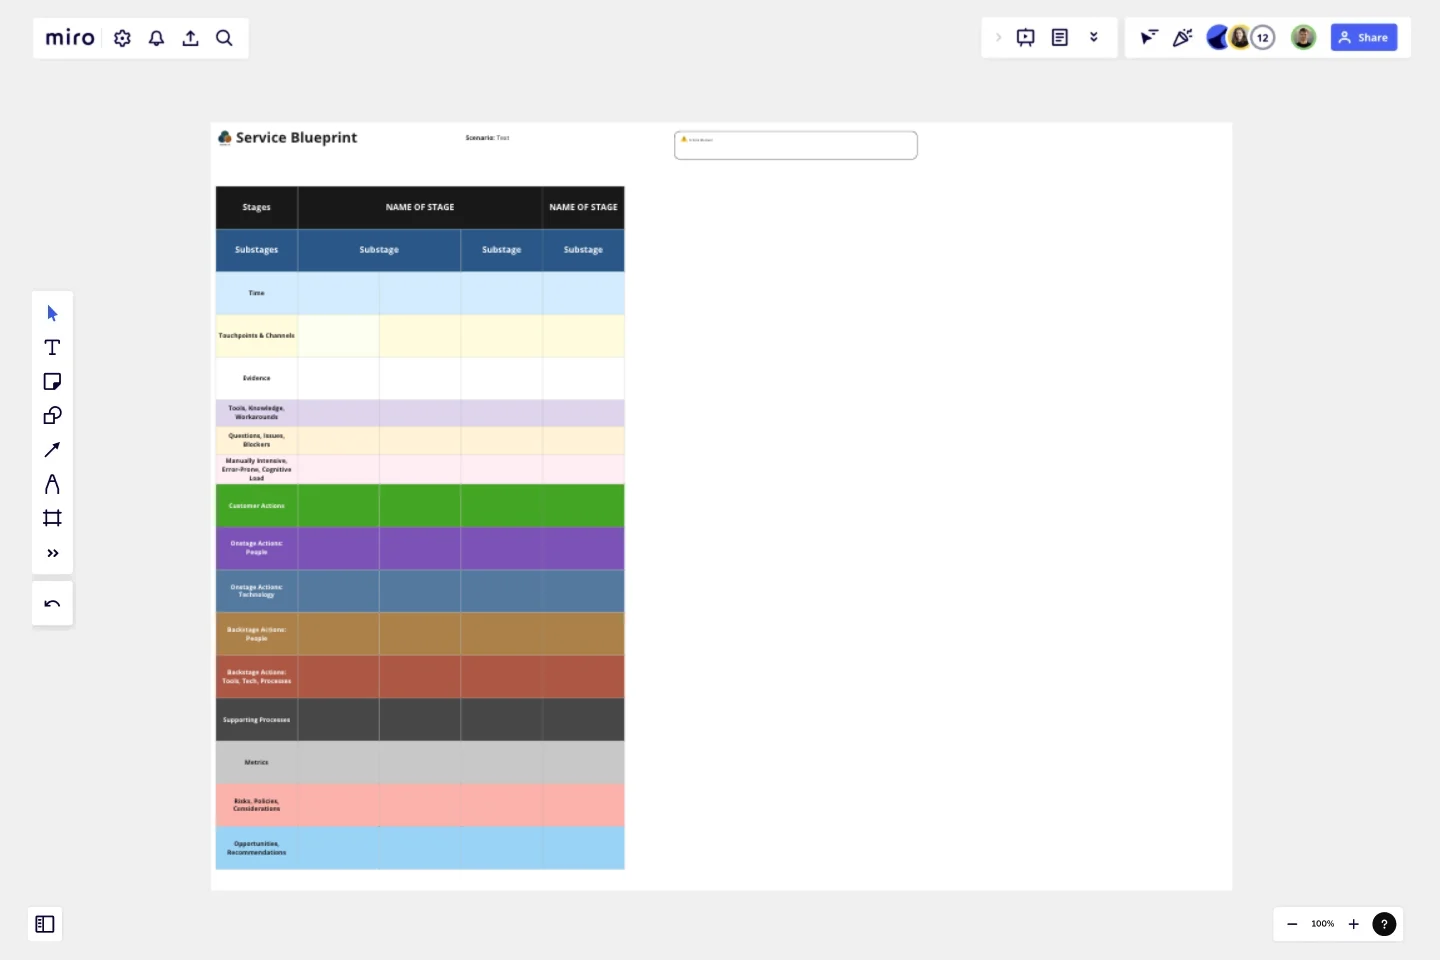
I've been experimenting with expanding service blueprints. It uses Miro's table widget so that you can easily reorder columns and merge cells across columns (as the example shows).
This has standard swim lanes, but adds:
Touchpoints, Channels - where or how is the customer interacting with us?
Aspects of Larry Marine's Task Analysis approach, including what I'm calling his Task Detractors - 3 swim lanes for tools, knowledge, workarounds; questions, issues, blockers; manually intensive, error-prone, and cognitive load. Looking at these details surfaces way opportunities to improve the flow and experience.
Metrics - how did we measure this or what numbers/data did we see related to this step? For the future state, what will we measure and how (success criteria)?
Risks, Policies, Considerations - I believe companies don't document current/potential risk enough. This might include laws and regulations we should consider.
Opportunities, Recommendations - Early insights and suggestions, step by step.
When would I use this?
Service design and service blueprinting.
After qualitative CX or UX research such as observations studies, contextual inquiry, interviews, and IDIs.
In the workshop to finalize your current or future state service blueprint.
Because your customer journey map isn't telling enough of the story.
Why doesn't this show emotions, feelings, or quotes?
It's already rather tall!
You can add emojis to the Customer Actions line if you'd like to summarize or show how they are likely to feel during that step.
This isn't a CJM. The focus is more on experiences and the interplay with our Onstage and Backstage people, processes, props, and systems.
Thanks for giving it a try, and get in touch if you have questions or suggestions! You can learn more about mapping Task Analysis and Optimized Task Flow here: https://www.youtube.com/watch?v=tEx8R4ePwmk
Get started with this template right now.
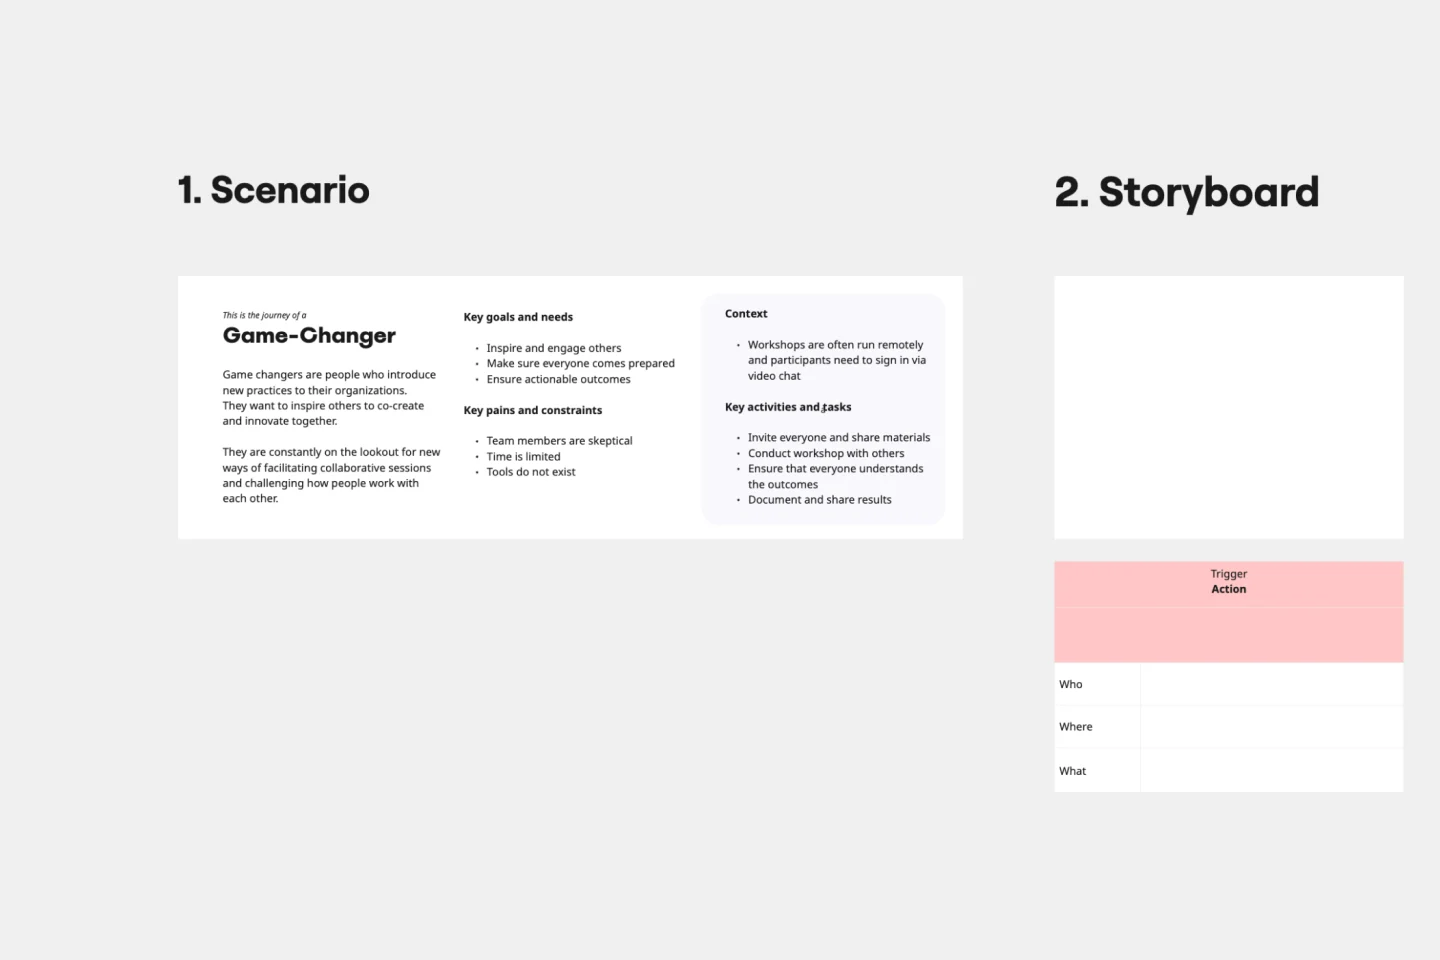
Storyboard Template
Works best for:
Design Thinking
While storyboard is typically associated with planning out scenes for a movie or TV show, it’s been widely adopted throughout the business world. A storyboard is a sequence of illustrations that are used to develop a story. You can use the Storyboarding template anytime you’d like to really put yourself in a customer or user’s position and understand how they think, feel, and act. This tactic can be especially useful when you know there’s a problem or inefficiency with an existing process. You can storyboard existing processes or workflows and plan how you would like them to look in the future.
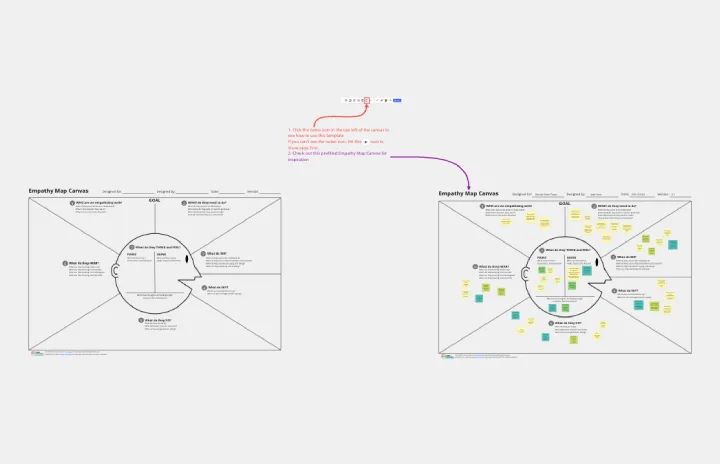
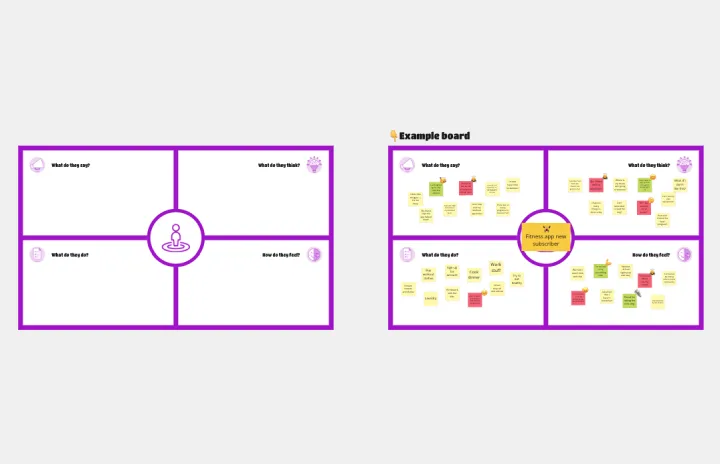
Empathy Map Canvas
Works best for:
Research & Design, Market Research
Empathy Map Canvas is an essential tool for capturing user insights. By visualizing what users think, feel, and experience, you can create more effective and user-friendly designs. This template is perfect for teams focused on user-centered design.
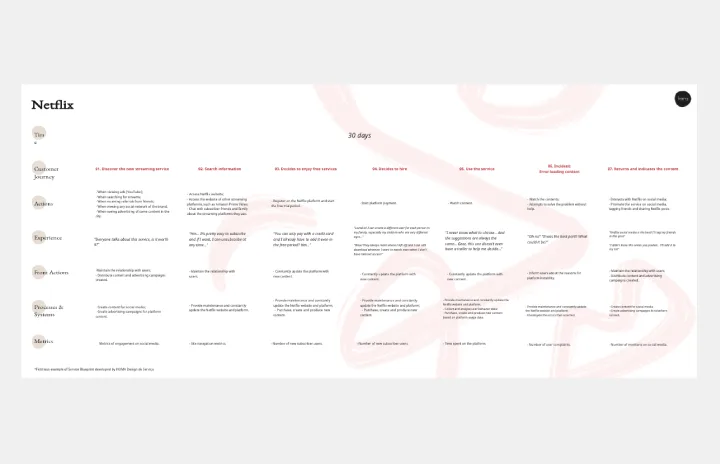
Service Blueprint
Works best for:
Research & Design
Utilize the Service Blueprint template to visualize and optimize your service processes. This template captures interactions between customers and service elements, helping you identify areas for improvement. It's ideal for teams aiming to enhance service delivery by aligning processes, identifying inefficiencies, and fostering a comprehensive understanding of the service journey. Perfect for creating a cohesive service strategy.
Purple Sector Empathy Map
Works best for:
Market Research, Research & Design
Purple Sector Empathy Map is an innovative tool for exploring user experiences. By visualizing users' thoughts, feelings, and behaviors, you can create more engaging and user-friendly products. Ideal for teams focused on user experience.
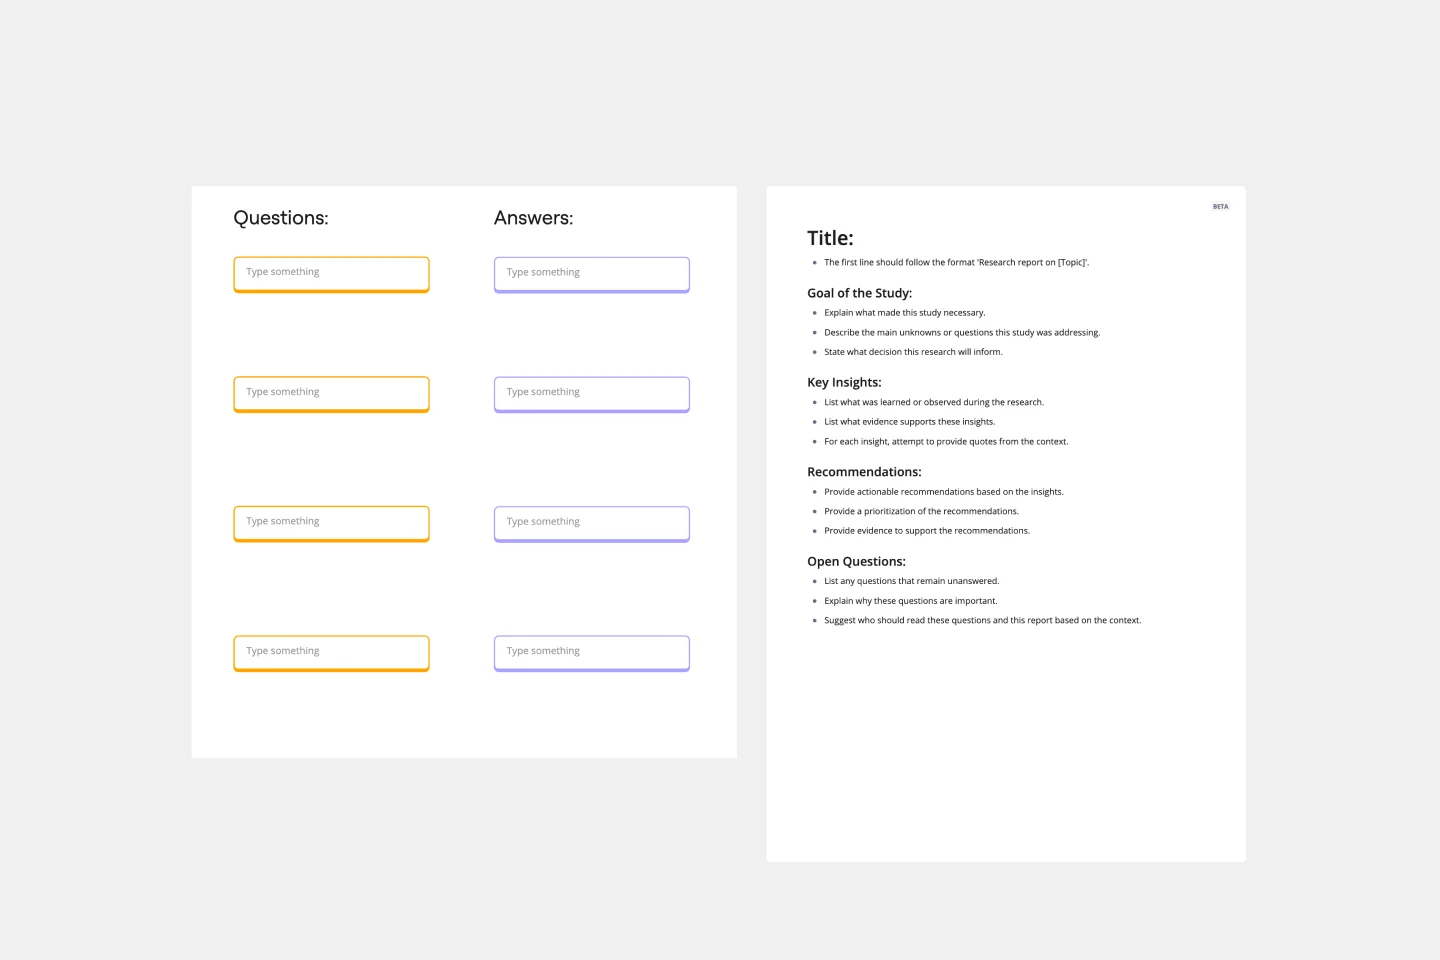
User Interview Template
Works best for:
Desk Research, Product Management
A user interview is a UX research technique in which researchers ask the user questions about a topic. They allow your team to quickly and easily collect user data and learn more about your users. In general, organizations conduct user interviews to gather background data, to understand how people use technology, to take a snapshot of how users interact with a product, to understand user objectives and motivations, and to find users’ pain points. Use this template to record notes during an interview to ensure you’re gathering the data you need to create personas.
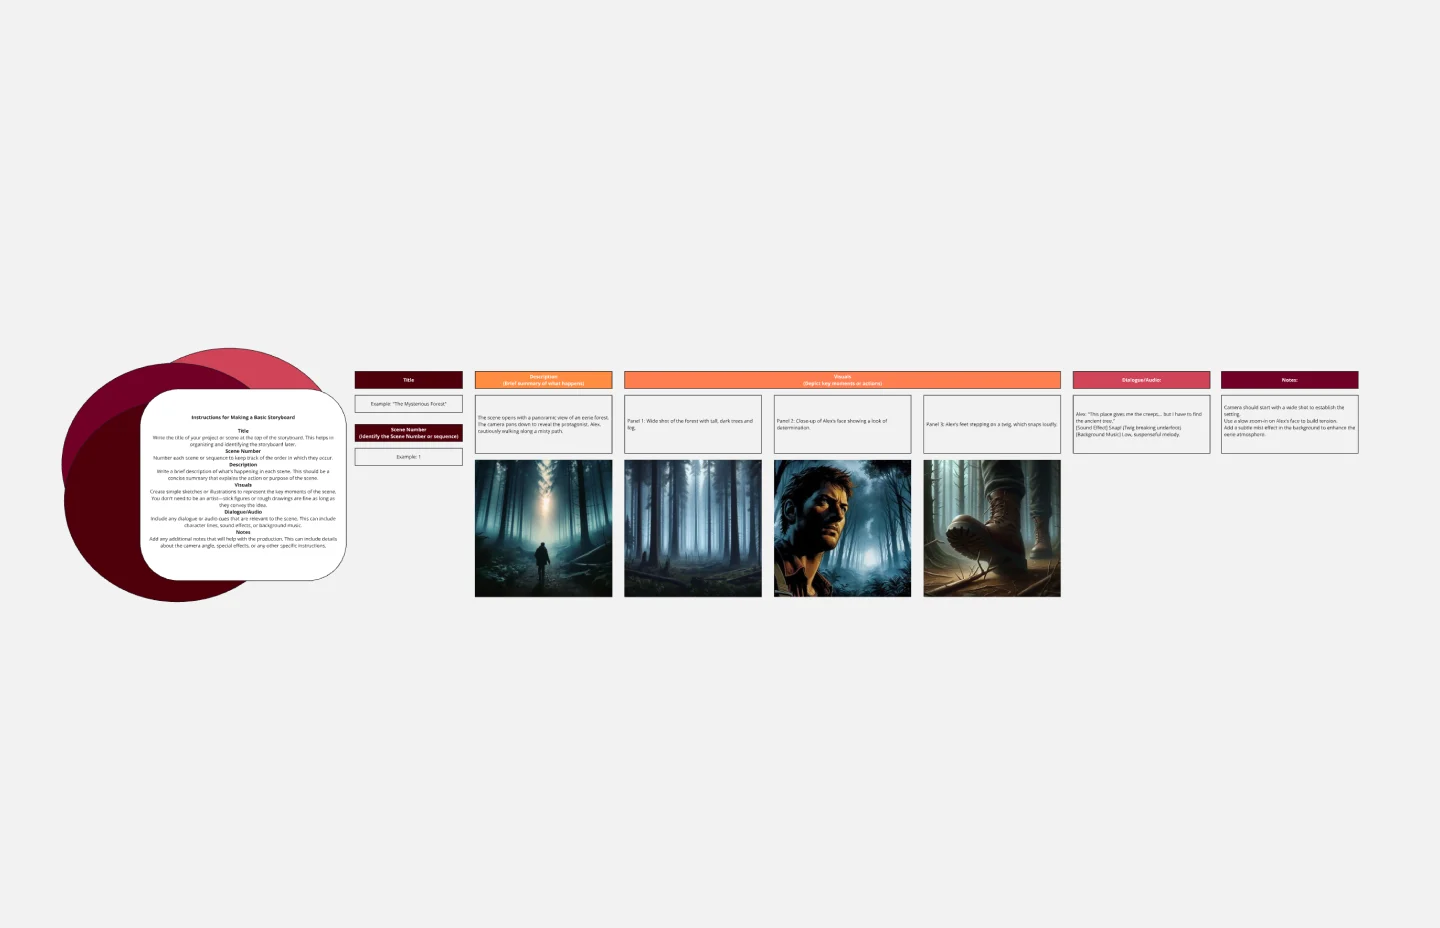
Basic Storyboard
Works best for:
Storyboard
The Basic Storyboard template helps visualize and plan creative projects by breaking down scenes into manageable parts. With spaces for visuals, dialogue, audio, and notes, it ensures clarity and organization. Perfect for teams in film, animation, or presentations, this template enhances communication and saves time by providing a structured format to plan, review, and refine your project’s narrative and flow.