Empathy Map [Research]
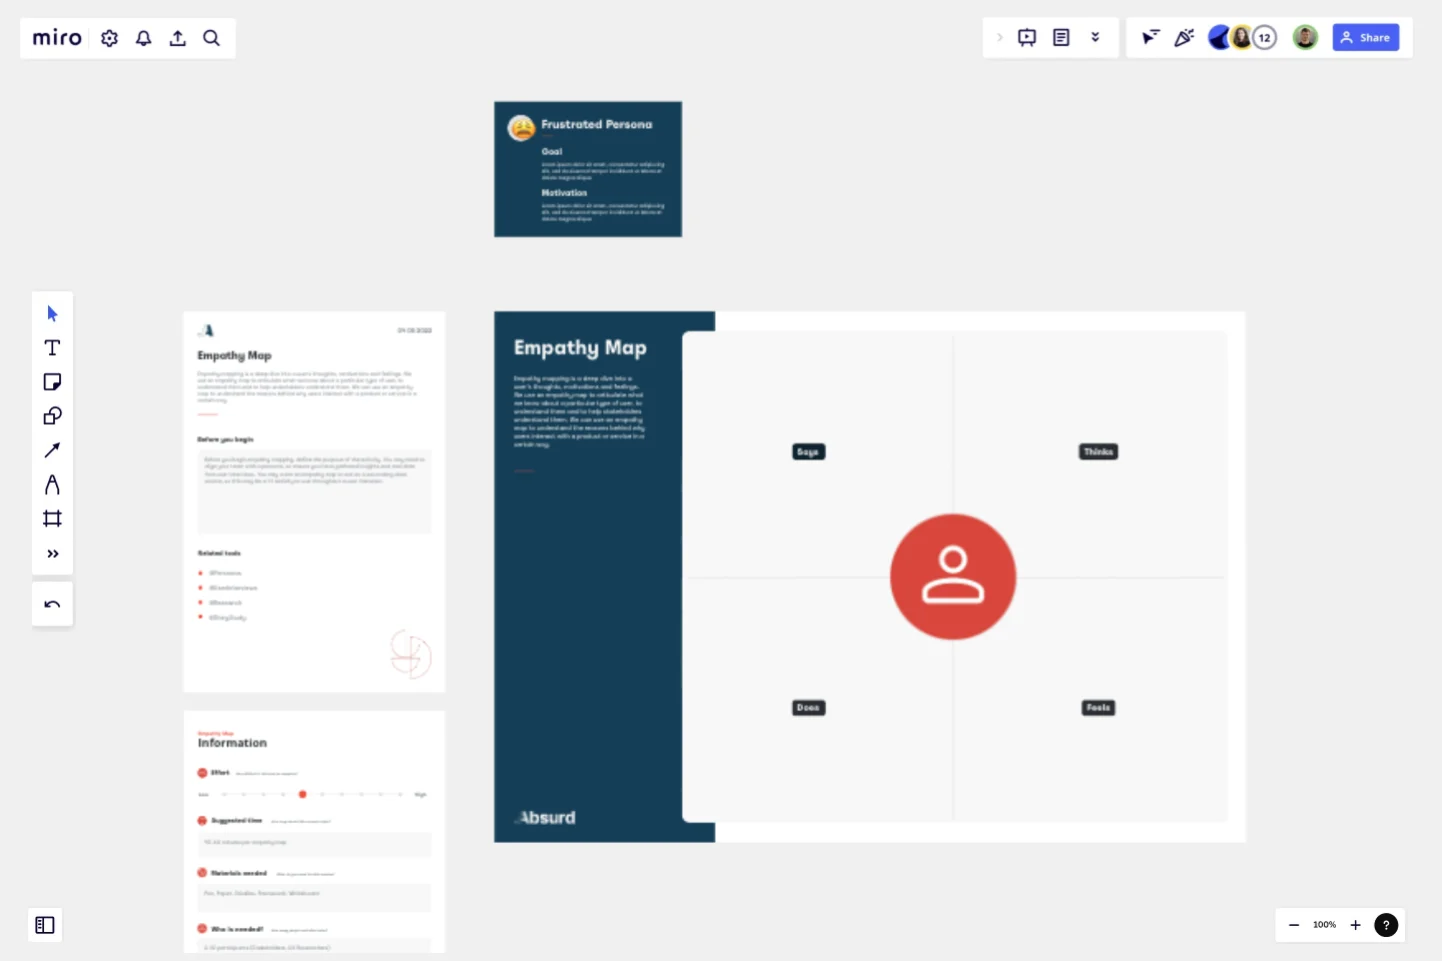
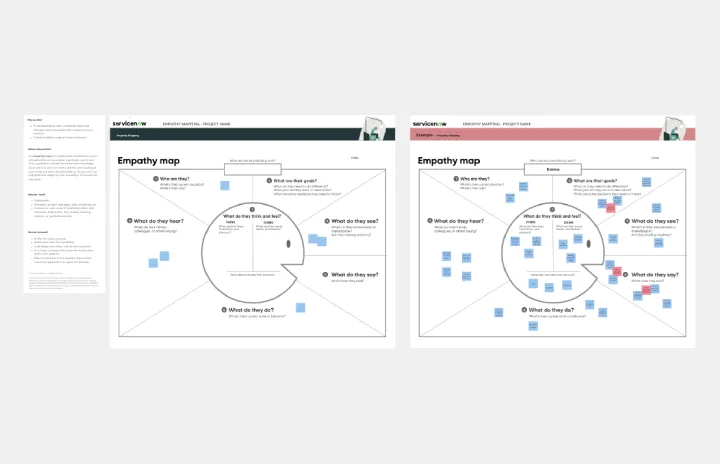
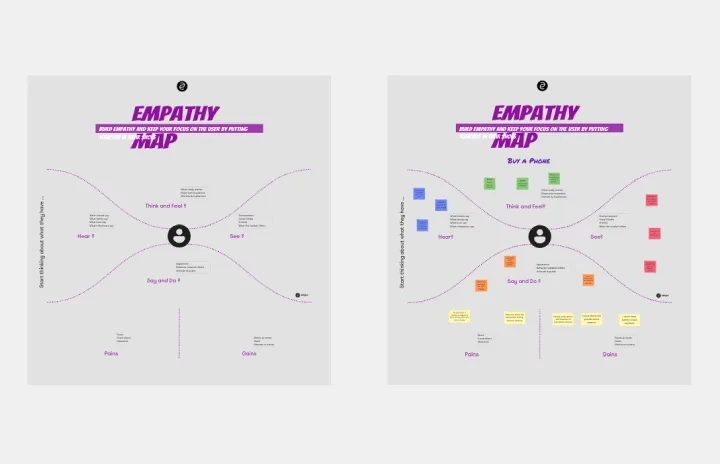
Empathy mapping is a deep dive into a user's thoughts, motivations and feelings.
Empathy mapping is a deep dive into a user's thoughts, motivations and feelings. We use an empathy map to articulate what we know about a particular type of user, to understand them, and to help stakeholders understand them.
We can use an empathy map to understand the reasons behind why users interact with a product or service in a certain way.
Get started with this template right now.
Remote Design Sprint
Works best for:
Design, Desk Research, Sprint Planning
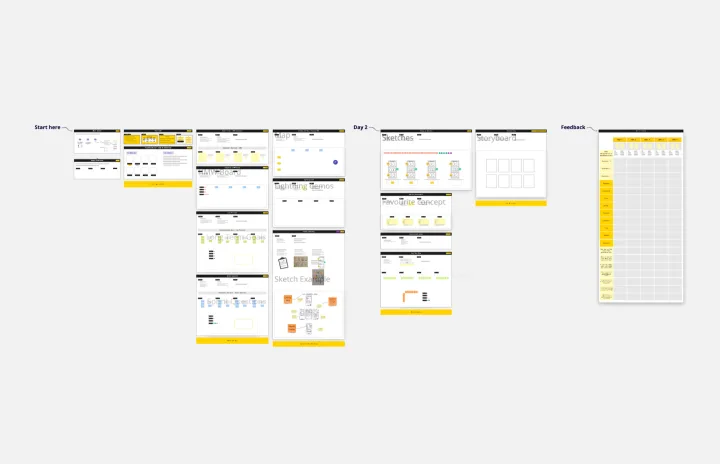
A design sprint is an intensive process of designing, iterating, and testing a prototype over a 4 or 5 day period. Design sprints are conducted to break out of stal, work processes, find a fresh perspective, identify problems in a unique way, and rapidly develop solutions. Developed by Google, design sprints were created to enable teams to align on a specific problem, generate multiple solutions, create and test prototypes, and get feedback from users in a short period of time. This template was originally created by JustMad, a business-driven design consultancy, and has been leveraged by distributed teams worldwide.
iPhone App Template
Works best for:
UX Design, Desk Research, Wireframes
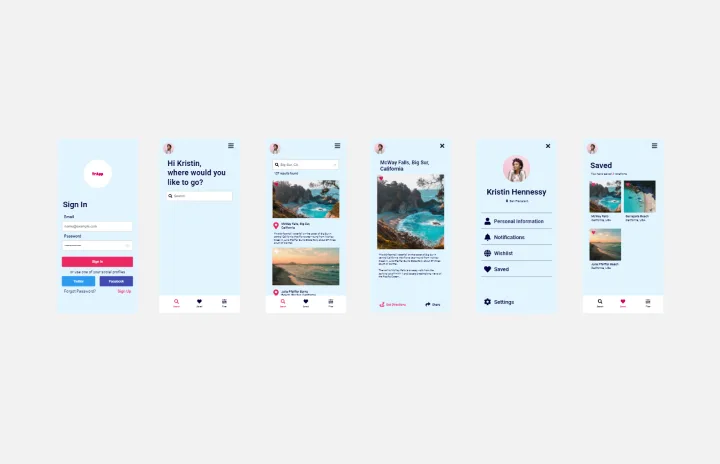
Incredible percentages of smartphone users worldwide have chosen iPhones (including some of your existing and potential customers), and those users simply love their apps. But designing and creating an iPhone app from scratch can be one seriously daunting, effort-intensive task. Not here — this template makes it easy. You’ll be able to customize designs, create interactive protocols, share with your collaborators, iterate as a team, and ultimately develop an iPhone app your customers will love.
Idea Drafting Template
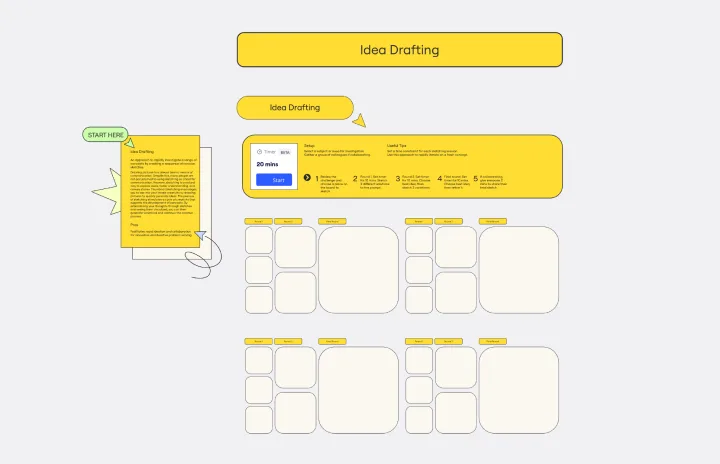
The Idea Drafting Template encourages you to tap into your innate creativity by drawing pictures to quickly generate ideas. The sketching process stimulates a cycle of creativity that supports the development of concepts. By externalizing your thoughts through sketches and seeing them visualized, you can generate variations and continue the creative process.

Service Blueprinting Workshop
Works best for:
Agile
The Service Blueprinting Workshop template helps teams visualize and improve service processes. It includes ice breakers, context canvas, empathy maps, and action plans for service transitions. Use it to align teams, identify opportunities, and prototype service delivery from a macro to microscopic level, ensuring a comprehensive understanding of service orchestration and seamless collaboration. Ideal for remote and dispersed teams.
Empathy Mapping
Works best for:
Research & Design, Market Research
The Empathy Mapping template helps teams capture detailed user insights. By understanding user perspectives, you can improve product features and customer satisfaction. This template is perfect for user research and product development.
Empathy Map
Use the Empathy Map template to delve into your users' minds. By mapping out their thoughts, feelings, and behaviors, you can develop insights that drive user-centric product development. This template is ideal for UX designers and product teams.