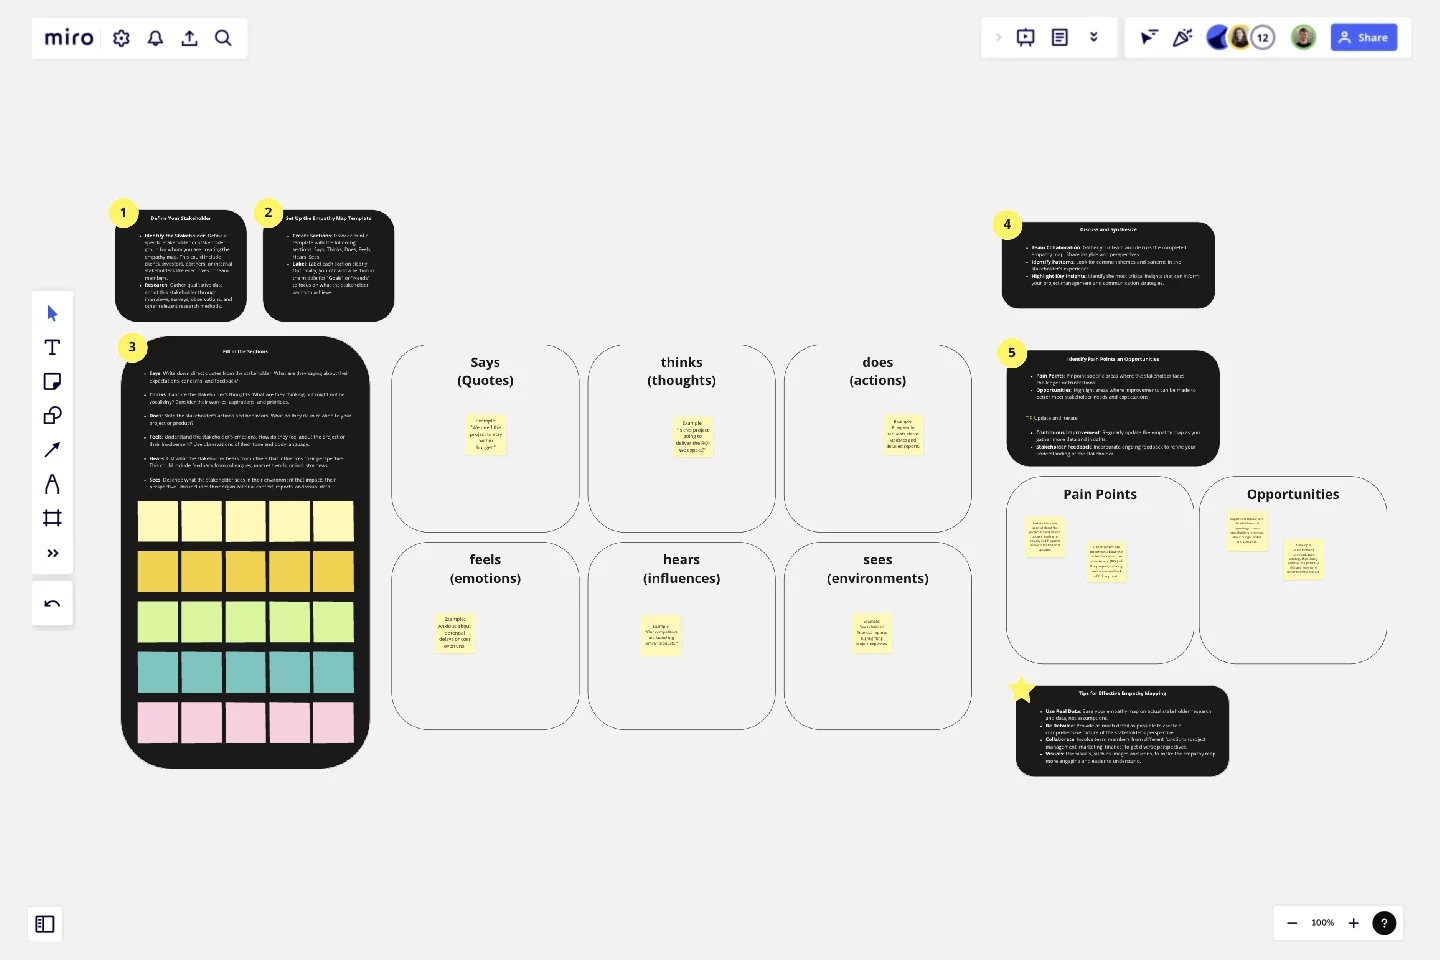
Empathy Map for Stakeholders
The Empathy Map for Stakeholders template is a strategic tool designed to help teams gain a deep understanding of their stakeholders' perspectives, needs, and concerns.
The Empathy Map for Stakeholders template is a strategic tool designed to help teams gain a deep understanding of their stakeholders' perspectives, needs, and concerns. This template is particularly useful for aligning project goals with stakeholder expectations, enhancing communication, and fostering stronger relationships. It facilitates a stakeholder-centric approach, ensuring that project decisions and strategies are informed by stakeholder insights.
Sections of the Template
Says: Captures direct quotes and statements from the stakeholder about their expectations, concerns, and feedback.
Thinks: Encompasses the stakeholder's internal thoughts and reflections, including their worries, aspirations, and priorities.
Does: Observes and notes the stakeholder's actions and behaviors in relation to your project or product.
Feels: Identifies the emotional responses and feelings of the stakeholder, inferred from their tone and body language.
Hears: Records what the stakeholder hears from others that influences their perspective, such as feedback from colleagues, market trends, or industry news.
Sees: Describes the stakeholder's environment and visual context, including organizational context, reports, and visual data.
Why Use This Template?
Stakeholder-Centric Insights:
Benefit: Helps teams focus on the stakeholder’s perspective, leading to more relevant and aligned project strategies.
Outcome: Projects and initiatives that better meet stakeholder needs and expectations, enhancing overall support and engagement.
Improved Communication:
Benefit: Encourages clear and effective communication by providing a shared understanding of stakeholder insights.
Outcome: More cohesive and integrated project management efforts, reducing misunderstandings and fostering collaboration.
Identifying Pain Points and Opportunities:
Benefit: Enables teams to pinpoint specific stakeholder challenges and areas for improvement.
Outcome: Targeted actions that address stakeholder pain points, improving project outcomes and stakeholder satisfaction.
Actionable Insights:
Benefit: Translates qualitative data into clear, actionable insights that can drive project decisions.
Outcome: More informed and effective project strategies that are aligned with stakeholder needs.
Visual and Intuitive:
Benefit: The visual format makes it easy to understand and communicate stakeholder insights.
Outcome: Simplified and effective communication among team members and stakeholders, facilitating better decision-making.
The Empathy Map for Stakeholders template is an essential tool for any team looking to create stakeholder-centered projects and initiatives. By leveraging this template, teams can gain a deeper understanding of their stakeholders, enhance communication, and drive more effective and impactful project decisions.
Get started with this template right now.
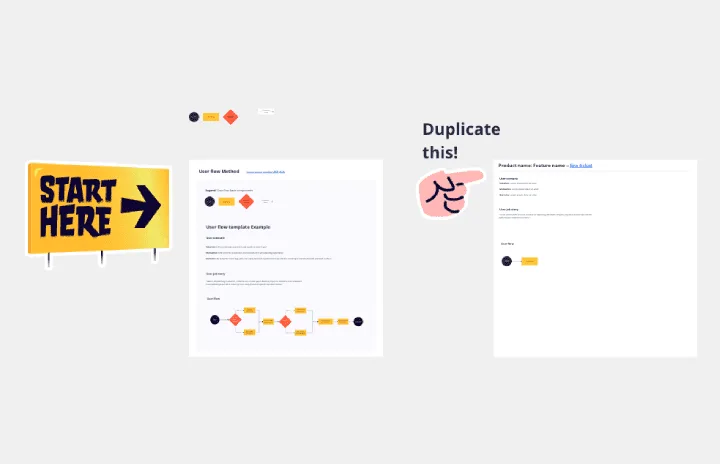
User Flow Example
Works best for:
Flowcharts, Mapping, Diagrams
The User Flow Example template offers a visual representation of a typical user flow within a digital product or service. It provides elements for documenting user interactions, navigation paths, and decision points along the user journey. This template enables UX designers and product teams to understand user behavior, identify pain points, and optimize the user experience. By providing a concrete example of user flow, the User Flow Example template serves as a valuable reference for designing intuitive and engaging digital experiences that meet user needs effectively.
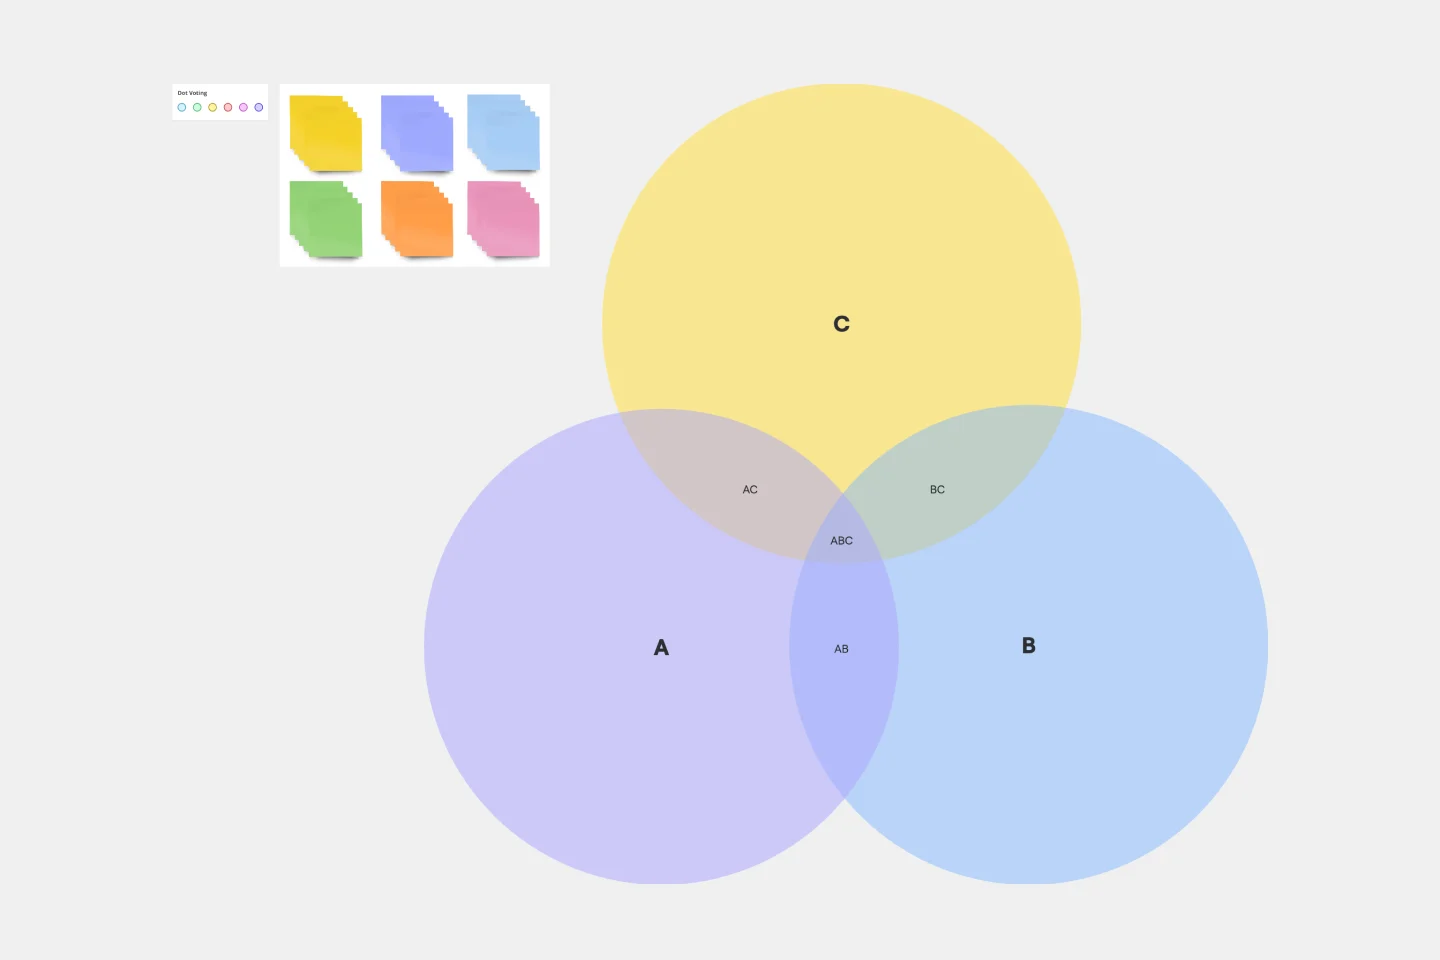
3-Circle Venn Diagram
Works best for:
Education, Diagrams, Brainstorming
Venn diagrams have been a staple of business meetings and presentations since the 1800s, and there’s a good reason why. Venn diagrams provide a clear, effective way to visually showcase relationships between datasets. They serve as a helpful visual aid in brainstorming sessions, meetings, and presentations. You start by drawing a circle containing one concept, and then draw an overlapping circle containing another concept. In the space where the circles overlap, you can make note of the concepts’ similarities. In the space where they do not, you can make note of their differences.
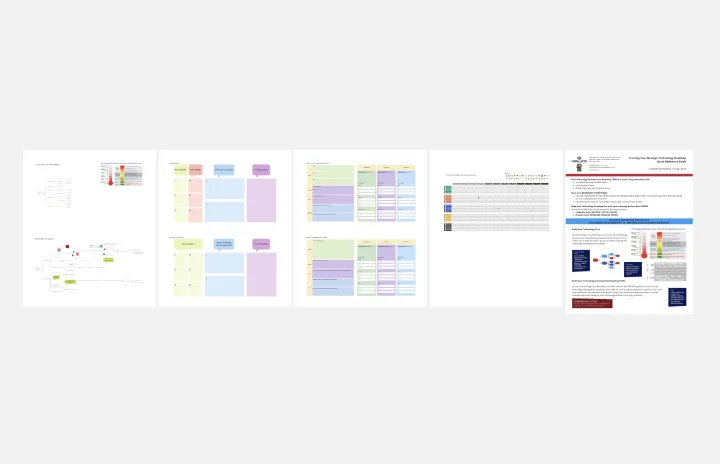
Strategic Technology Roadmap Worksheets
Works best for:
Roadmap, Planning, Mapping
We all know that technology commercialization success starts with the end in mind, a product with market viability.
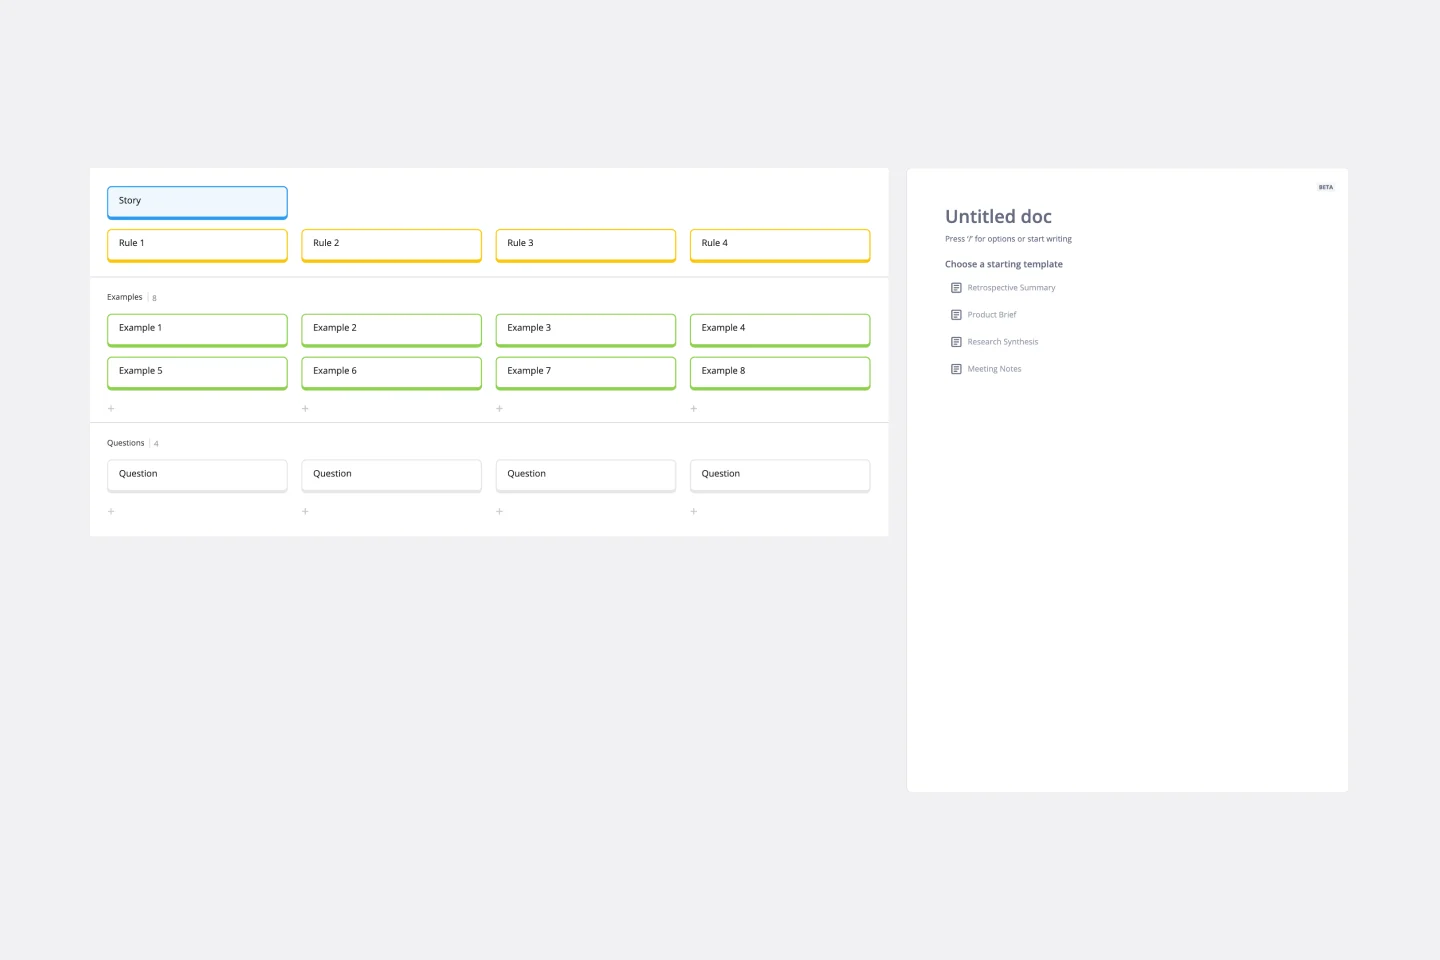
Example Mapping Template
Works best for:
Product Management, Mapping, Diagrams
To update your product in valuable ways—to recognize problem areas, add features, and make needed improvements—you have to walk in your users’ shoes. Example mapping (or user story mapping) can give you that perspective by helping cross-functional teams identify how users behave in different situations. These user stories are ideal for helping organizations form a development plan for Sprint planning or define the minimum amount of features needed to be valuable to customers.
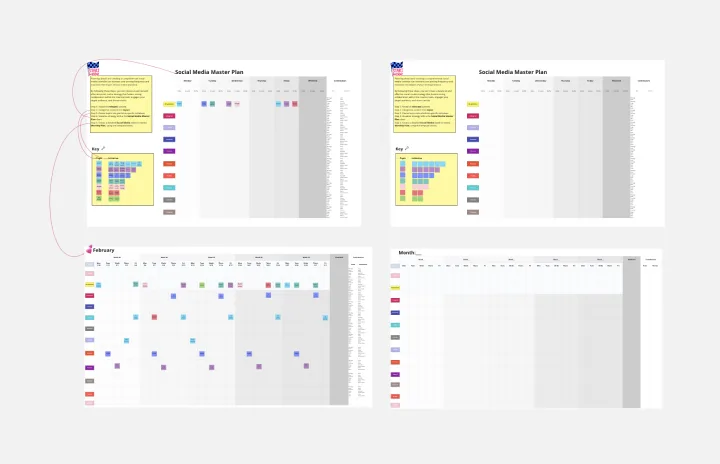
Social Media Strategy Planning
Works best for:
Roadmap, Planning, Mapping
The Social Media Strategy Planning template provides a structured approach for developing and implementing social media strategies. By defining objectives, target audiences, and content plans, teams can maximize the impact of their social media efforts. This template fosters collaboration and alignment across teams, ensuring that social media initiatives are integrated with broader marketing goals and contribute to overall business objectives.
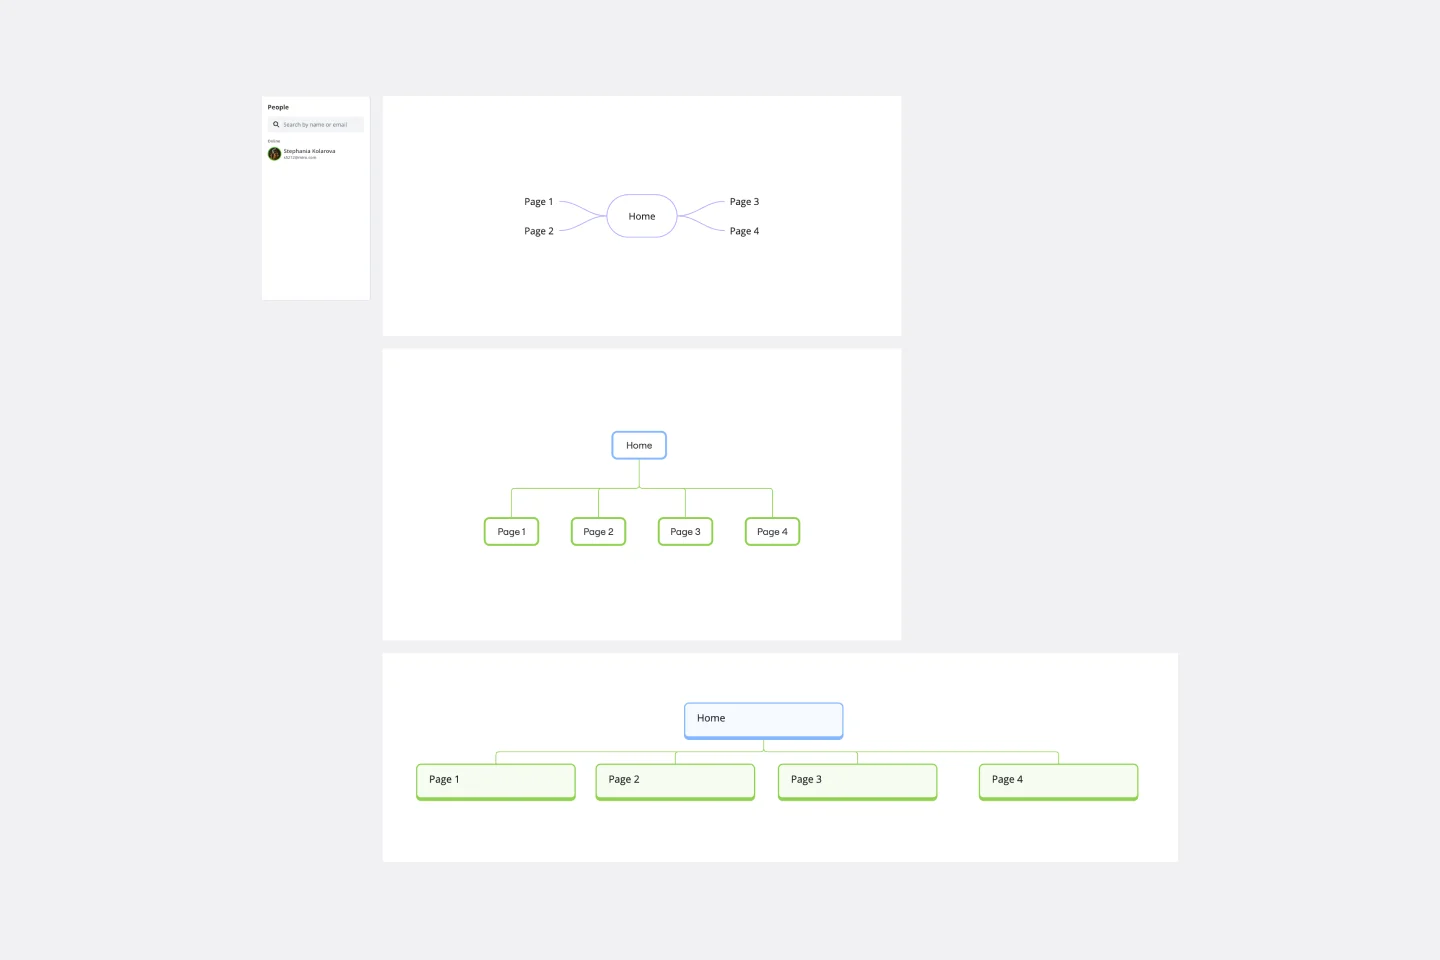
Sitemap Template
Works best for:
Mapping, Software Development, Diagrams
Building a website is a complex task. Numerous stakeholders come together to create pages, write content, design elements, and build a website architecture that serves a target audience. A sitemap is an effective tool for simplifying the website design process. It allows you to take stock of the content and design elements you plan to include on your site. By visualizing your site, you can structure and build each component in a way that makes sense for your audience.