
Driver Diagram Template
Map out your primary objectives and break them down into actionable components.
About the Driver Diagram Template
Add structure to projects using the driver diagram template to simplify complex objectives into understandable parts, ensuring a streamlined approach to achieving goals.
A driver diagram is a strategic visualization tool that delineates a main goal into its core contributors and actionable steps. Use this template to visualize and communicate the key drivers or factors that contribute to achieving a specific goal or outcome.
The template consists of three main areas:
Statement of aim/outcome: This is the heart of the diagram, indicating the ultimate objective or desired result.
Primary drivers: Directly stemming from the aim, these represent integral strategies or areas that are pivotal to achieving the overarching outcome.
Ideas: Branching out from each driver, these signify specific actions or initiatives that support the fulfillment of their respective drivers.
How to use the driver diagram template
The driver diagram template can be used to foster a shared understanding among team members, guide improvement efforts, and provide a structured approach to problem-solving and goal achievement. Here’s how to fill in the template to make it your own:
Add your primary aim: Starting with the "Statement of Aim/Outcome," define the primary goal or outcome that you want to achieve. This could be a desired improvement in a process, customer satisfaction, or any other measurable objective.
Expand your diagram: Edit the shapes and lines to add more drivers and connectors. Include secondary aims or sub-goals that are related to the primary aim. These secondary aims help break down the larger goal into more manageable components. Continue expanding the diagram to include drivers that directly impact the achievement of the secondary aims and, ultimately, the primary aim. Use arrows to indicate the relationships between different elements in the diagram.
Embed additional elements: Elevate the diagram by incorporating other elements, such as notes or reference images, to provide deeper context.
Why should you use a driver diagram template?
By visually representing the drivers and relationships, teams can better prioritize their efforts and focus on the most critical factors for success. Here are a few benefits the driver diagram template provides:
Visualization: Understand and define the cascade from overarching goals to specific actions.
Structured approach: Facilitate methodical planning by breaking down the goal into actionable steps.
Team collaboration: Encourage consistent understanding and teamwork towards a unified objective.
Efficient allocation: Allow for precise resource and time allocation based on priority and impact.
Track & refine: Filling in the driver diagram template makes monitoring progress and making necessary adjustments simpler.
If you'd prefer to start from scratch, diagramming with Miro is easy! You can choose from a wide range of diagramming shapes in Miro's extensive library, so you'll find just what you need.
Can I add more levels of ideas or drivers to the template?
Yes, the template is flexible and can be expanded to include additional layers or branches as your project needs.
How do I make the diagram more interactive?
Once you’ve added the driver diagram template to your Miro board, you have the option to add clickable links, annotations, and other interactive elements to enrich the user experience.
Can I color-code differently than what's shown?
Absolutely. The colors are customizable, allowing you to adapt based on preferences or significance.
Get started with this template right now.
Production Flowchart Template
Works best for:
Flowcharts
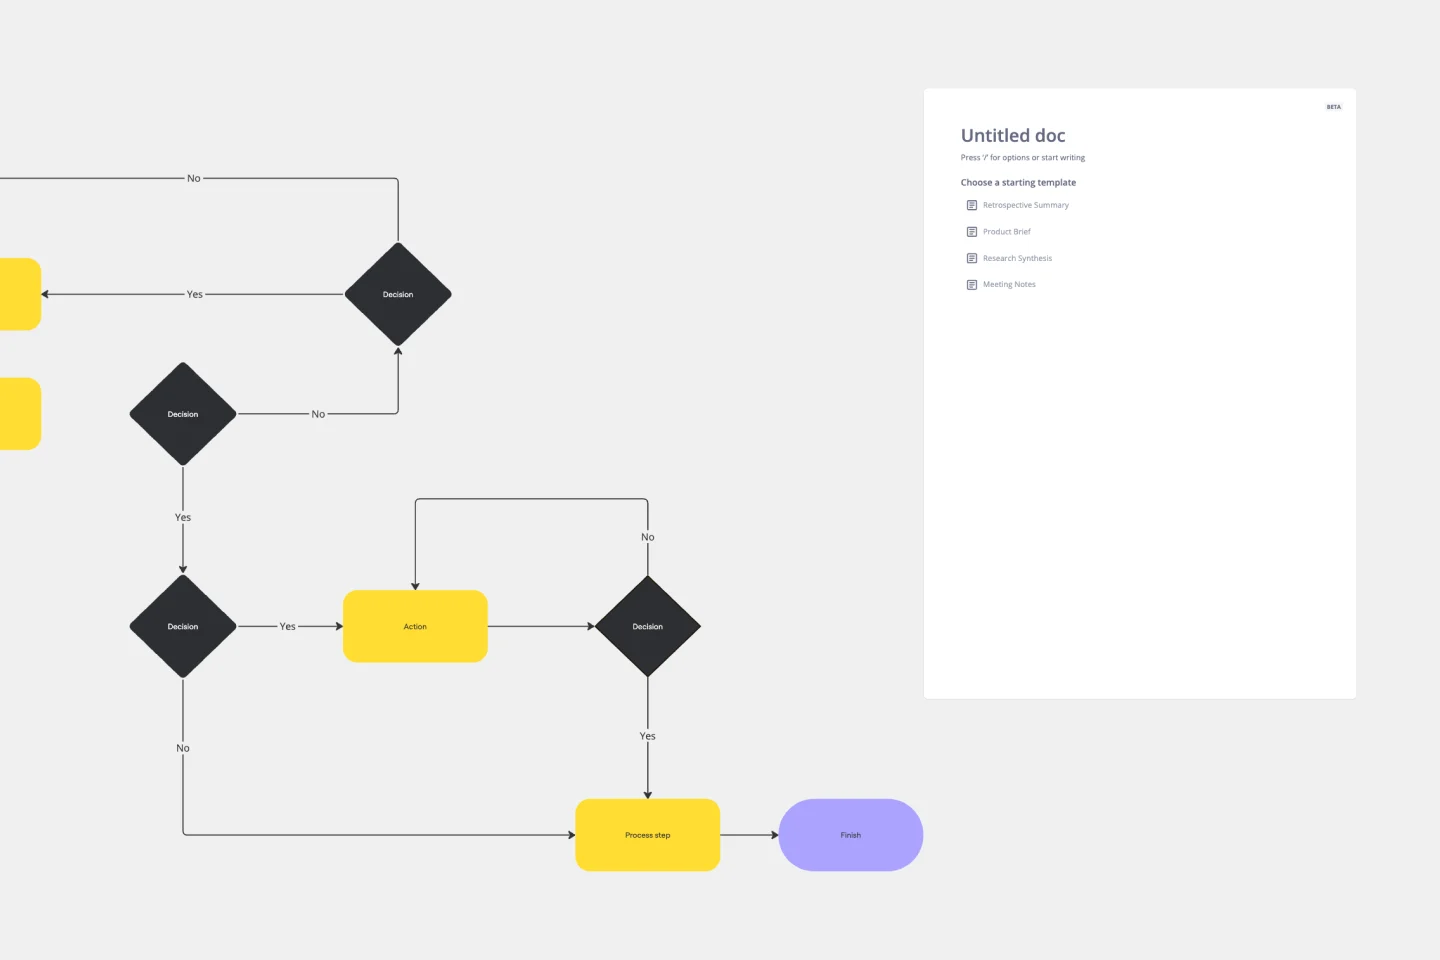
The Production Flowchart Template is a well-crafted tool that clearly represents a production process from start to finish. It breaks down complex procedures into easy-to-understand segments, making it easier for stakeholders to grasp the entire process. One of the key benefits of using this template is that it helps to clarify complex production pathways. By mapping out operations visually, teams can identify potential bottlenecks or inefficiencies, facilitating timely and well-informed decision-making.
Production Workflow Template
Works best for:
Agile Workflows, Agile Methodology, Project Management
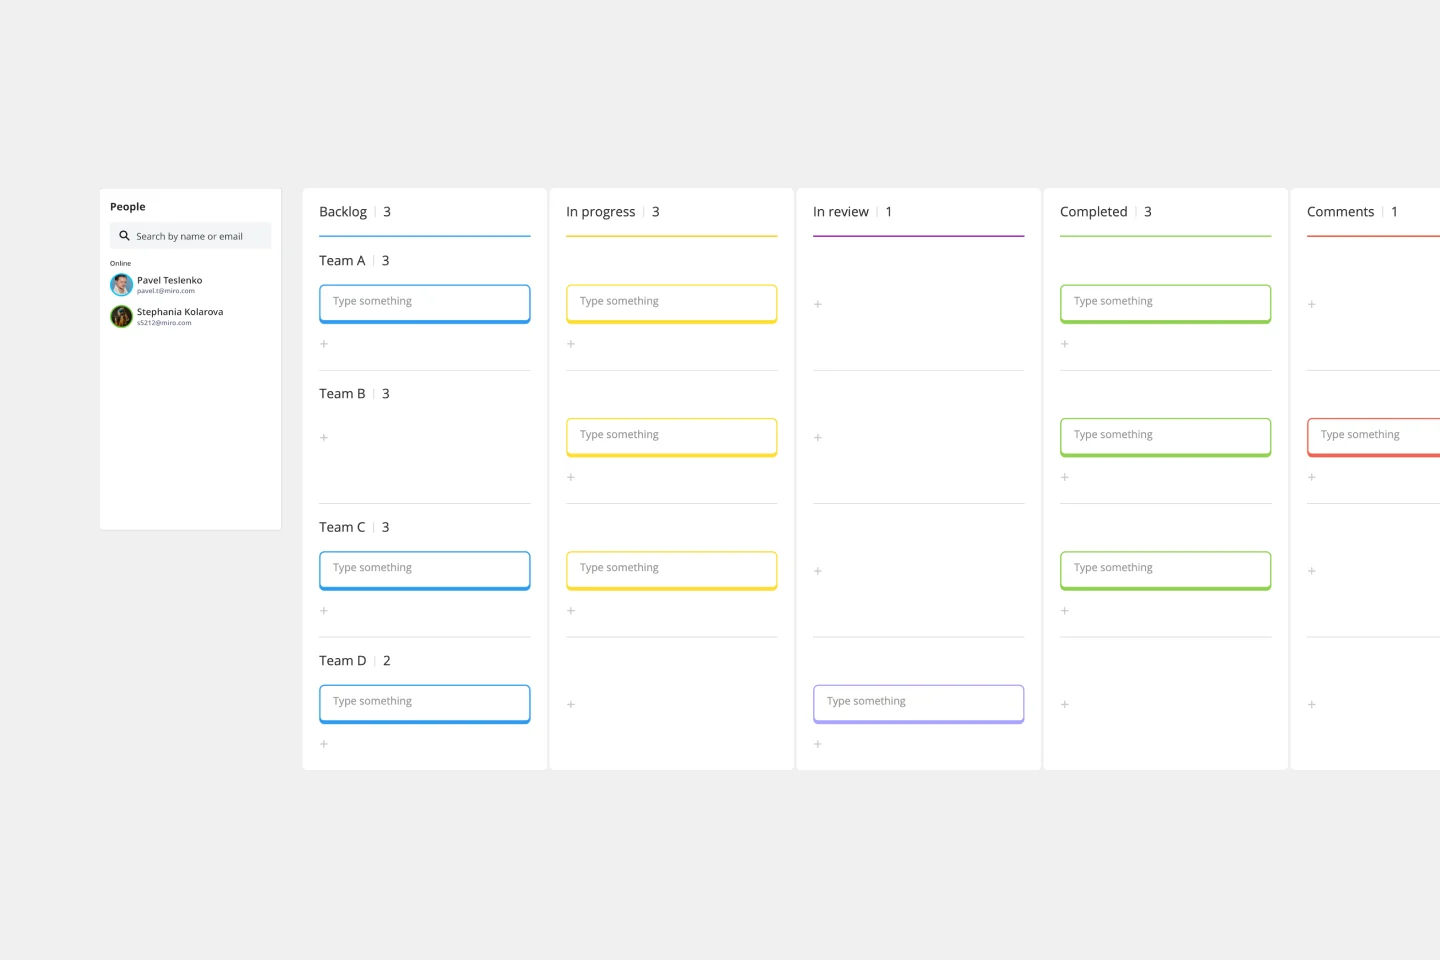
Whether you’re producing a podcast, a marketing campaign, a TV show, or a piece of content, establishing a production workflow is crucial. A production workflow creates a visual guide to the different steps in a process. It can be used to train new team members or give a high-level overview to stakeholders. Although production workflows vary by team and business, they generally contain information about who the stakeholders are, how you brainstorm ideas, what your timeline looks like, and what resources you need to succeed.
Mind Map Template
Works best for:
Planning, Mind Mapping, Education
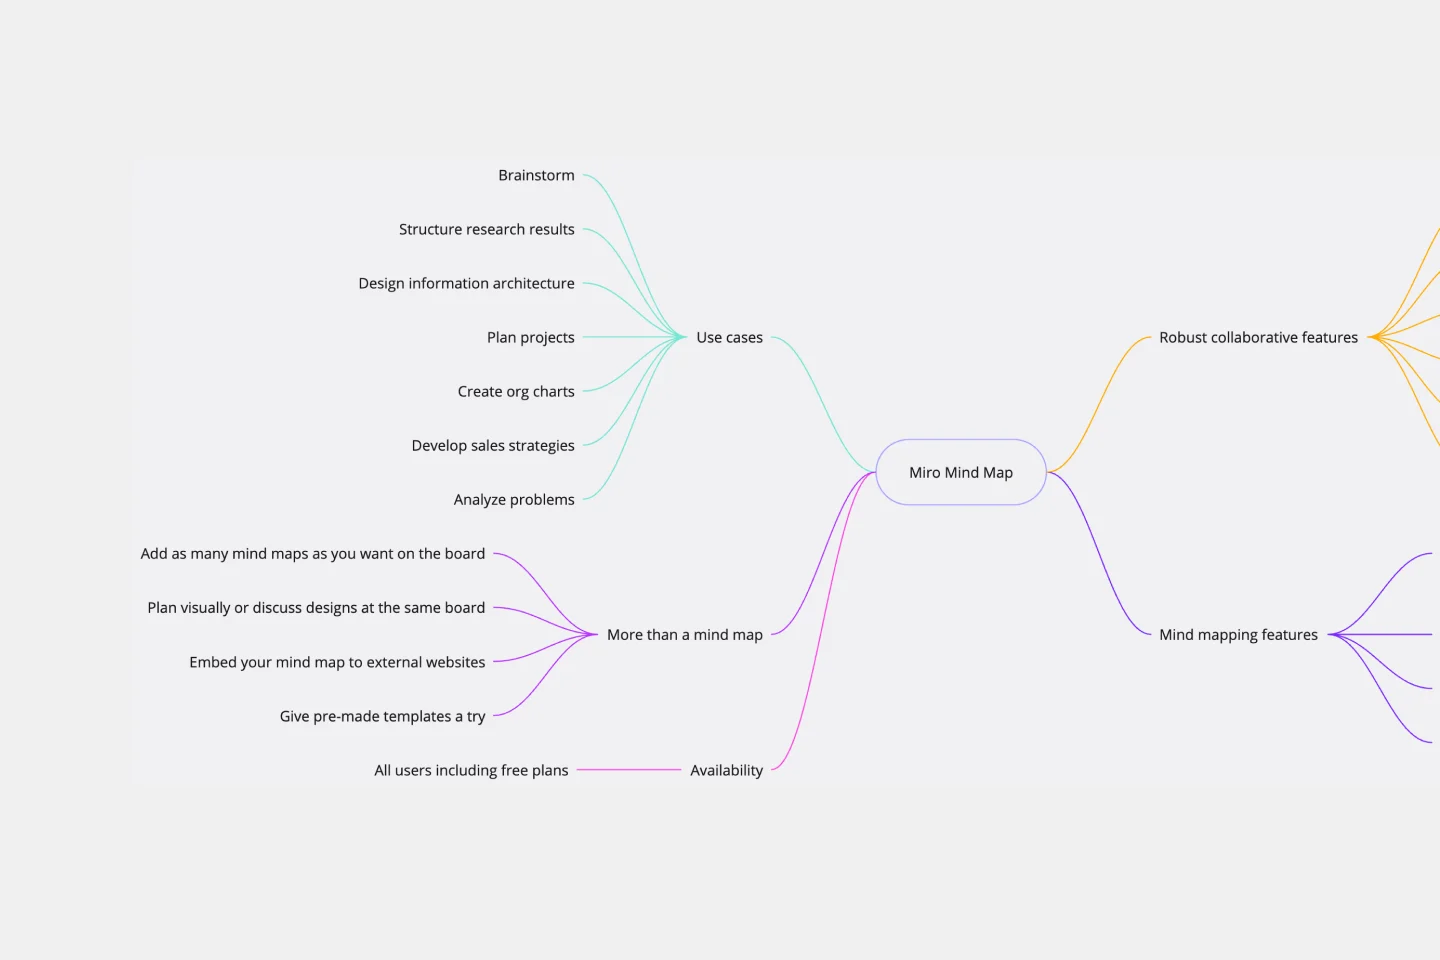
We see you, visual learners. You grasp concepts and understand data easier when they're presented in well-organized, memorable graphics. Mind mapping is perfect for you. This powerful brainstorming tool presents concepts or ideas as a tree — with the central subject as the trunk and your many ideas and subtopics as the branches. This template is a fast, effective way for you to start mind mapping, which can help you and your team become more creative, remember more, and solve problems more effectively.
Opportunity Solution Tree Template
Works best for:
Flowcharts, Product Management, Diagrams
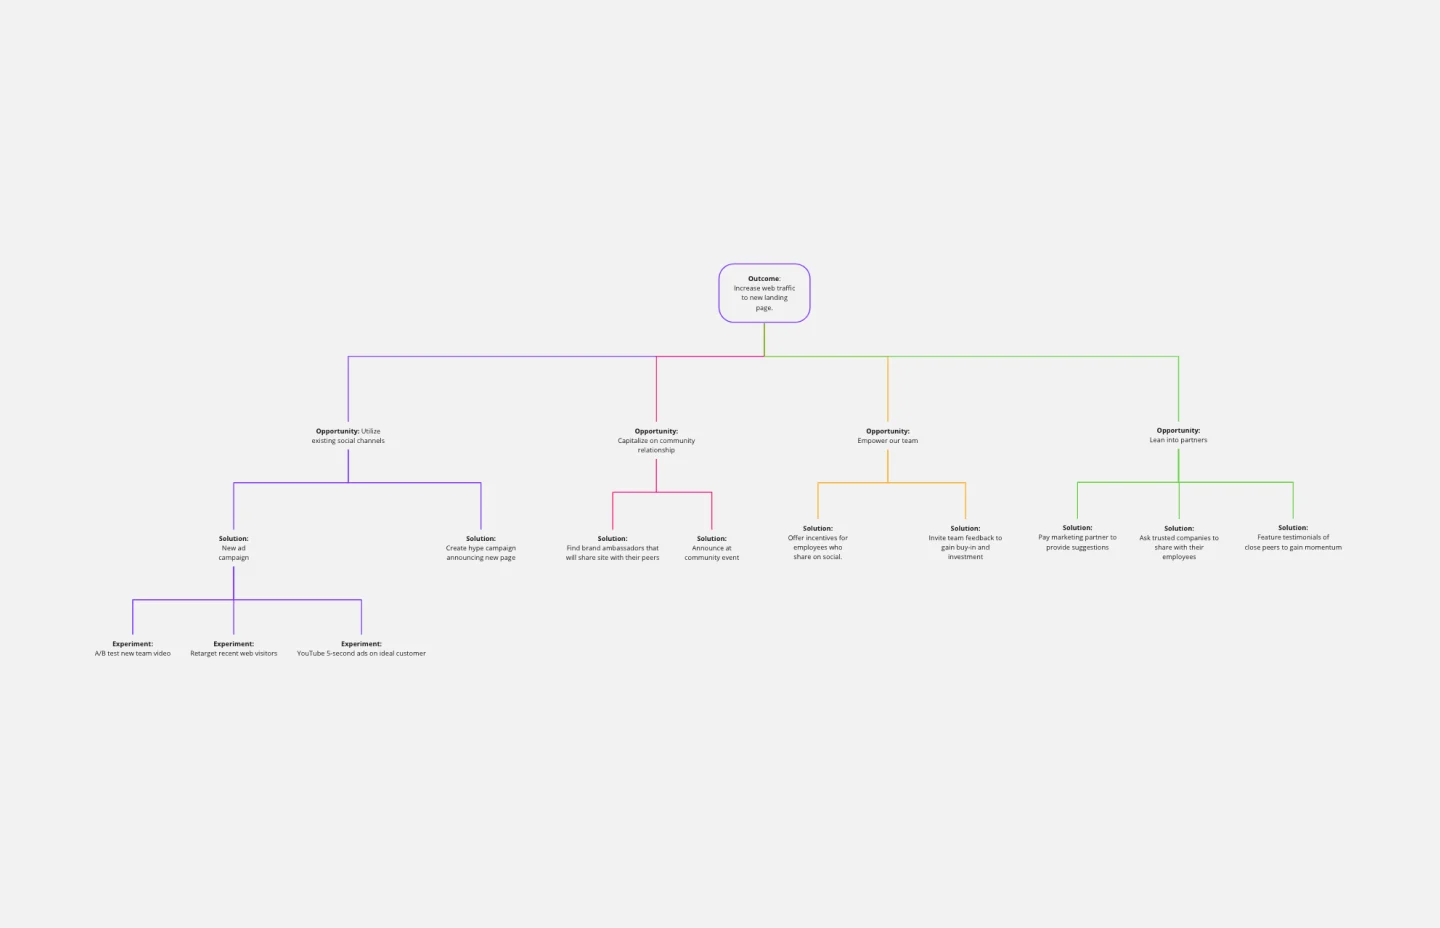
Solving problems — successful companies and productive teams just know how to do it. They’re able to identify many possible solutions, then settle on the one that leads to the desired outcome. That’s the power an Opportunity Solution Tree gives you. Designed by Teresa Torres, a product discovery coach, this mind map breaks down your desired outcome into opportunities for the product to meet user needs, then gives your team an effective way to brainstorm potential solutions.
Business Mindmap
Works best for:
Diagramming
The Business Mindmap template is a visual tool for brainstorming, organizing, and presenting business ideas and concepts. It provides a structured framework for capturing and connecting thoughts, insights, and action items. This template enables teams to explore business strategies, analyze market trends, and develop innovative solutions. By promoting creativity and collaboration, the Business Mindmap empowers teams to generate and communicate actionable business plans effectively.