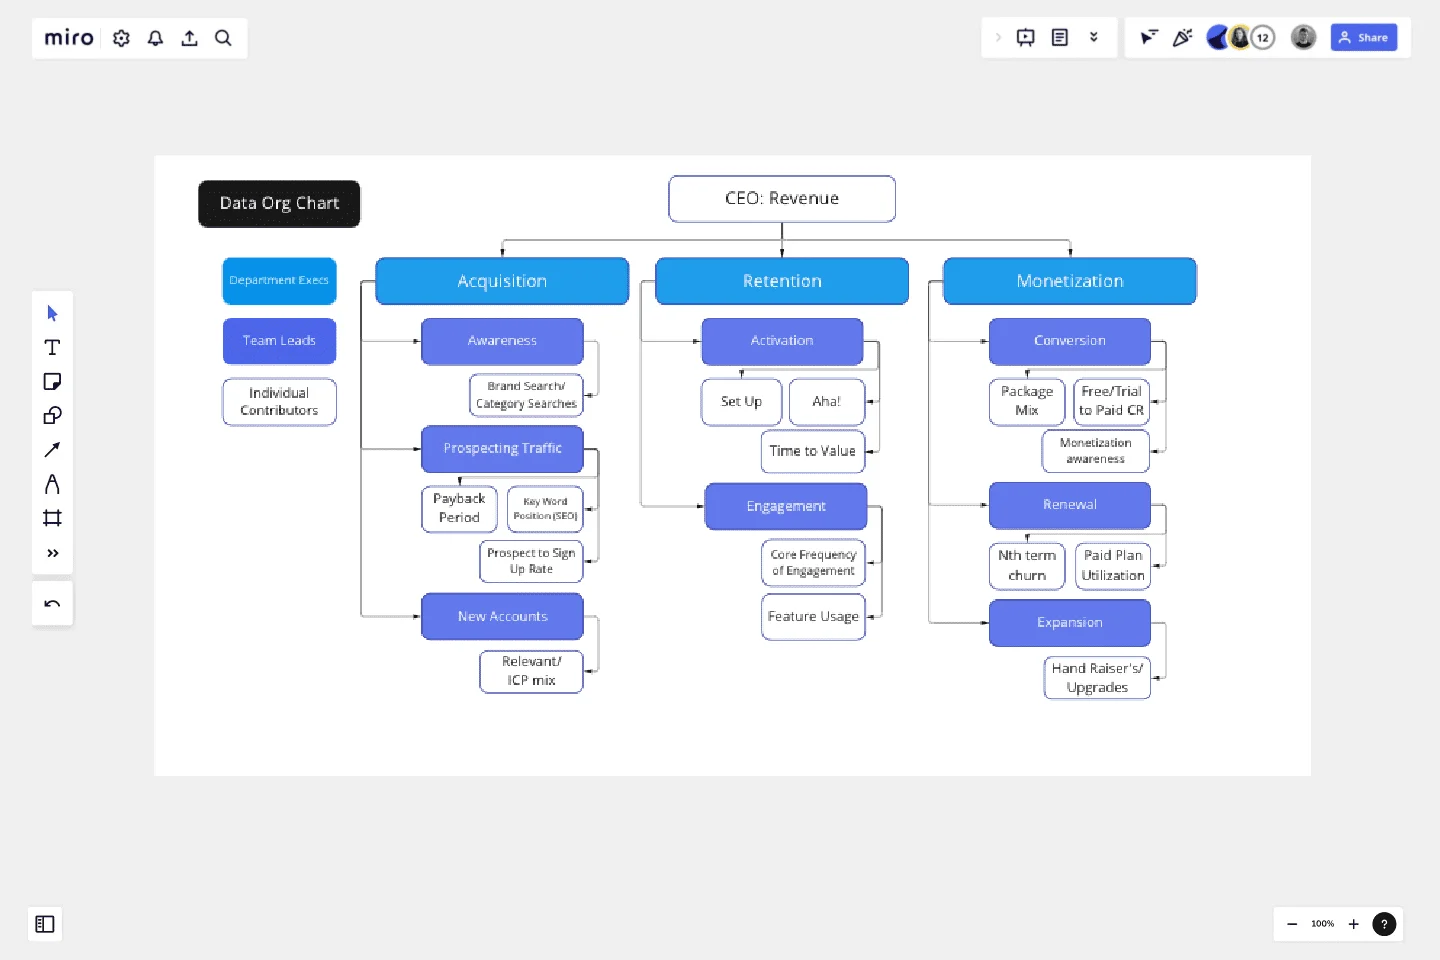
Data Org Chart
Map out your metrics across teams and departments!
Succeed with your data-driven culture by creating a data 'org chart'. This template will be most useful for Analysts, PMs, Marketers and Department Leaders who want to achieve data accountability with tight connection between initiatives and business outcomes. Having clear roles and responsibilities is always the key!
How to read this chart:
Individual Contributors — where 90% of the work is happening and how all of the growth initiatives are measured. Individual Contributor KPIs are constantly iterated (~ on quarterly basis) in the search for the best causality and predictive power. These KPIs are used for setting initiative goals and are often reflected in the individual team member quarterly goals.
Team Leads — responsible for the evaluation and selection of ICs. Team Lead metrics are often set as 'company metrics' on the leadership level and have a clear source of truth for self-serve consumption. Owned by PMs or Marketers.
Common pitfalls: The biggest mistake is to not set ownership of the team metrics. It can result in vanity IC selection or floating definitions ultimately leading to distrust and data-culture failure.
Department execs — data levers, not KPIs, and are the closest predictors to revenue. Department exec metrics are owned by the head of growth, product, marketing, etc.
Common pitfalls: Unfortunately, often misassigned. For example, in a product-led monetization model, only sales own revenue.
CEO — fearless leader, but not a doer.
Common pitfalls: Looking at revenue as your metric is being at least 3 months late to the party of your ability to impact it.
Use this template to:
1. Map out all of the metrics your cross-functional team is tracking and visualize the relationships (or lack thereof) to ‘Team Leads’ and ‘Department Execs’ metrics.
2. Highlight lack of ownership of certain metrics.
3. Understand over/under focus on certain growth levers, if no individual contributors are being tracked under ‘Team Lead’ or ‘Department Execs’ metrics.
3. Understand correlation vs. causation by reviewing data org chart on a quarterly basis.
4. Become hyper focused on metrics that matter the most.
Get started with this template right now.
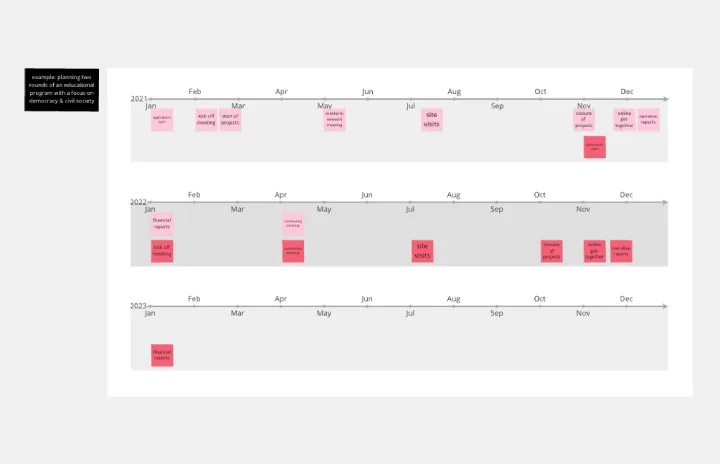
Year Timeline
Works best for:
Timeline, Planning
The Year Timeline template provides a comprehensive view of annual events and milestones. Perfect for planning yearly goals, tracking progress, and scheduling important dates, this template helps you stay organized and focused throughout the year.

Workday Calendar ▪ Timeline 2024
Works best for:
Planning, Timeline
The Workday Calendar Timeline 2024 template is ideal for planning your work year. It helps you organize work schedules, track important deadlines, and plan for holidays and events. This template ensures you stay productive and on top of your work commitments.
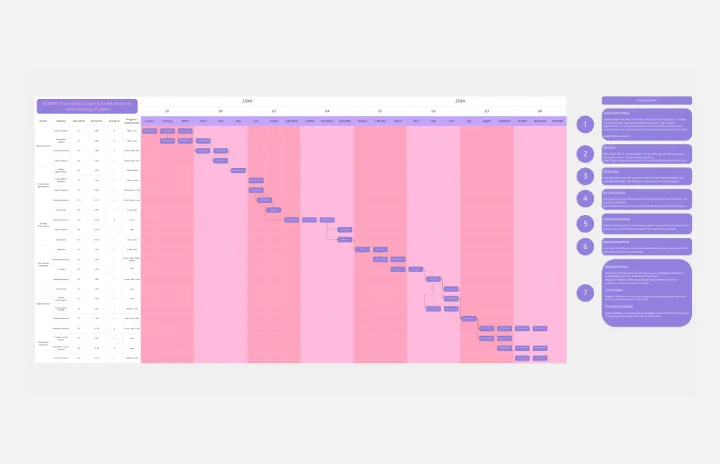
Sales Strategy Gantt Chart
Works best for:
Strategy, Planning
Creating and executing a sales strategy requires meticulous planning. The Sales Strategy Gantt Chart template helps you map out every step of your strategy, from goal setting to implementation and review. Visualize key activities, set timelines, and assign tasks to ensure your sales team stays focused and aligned. This template enables you to track progress, measure performance, and make data-driven adjustments for better sales outcomes.
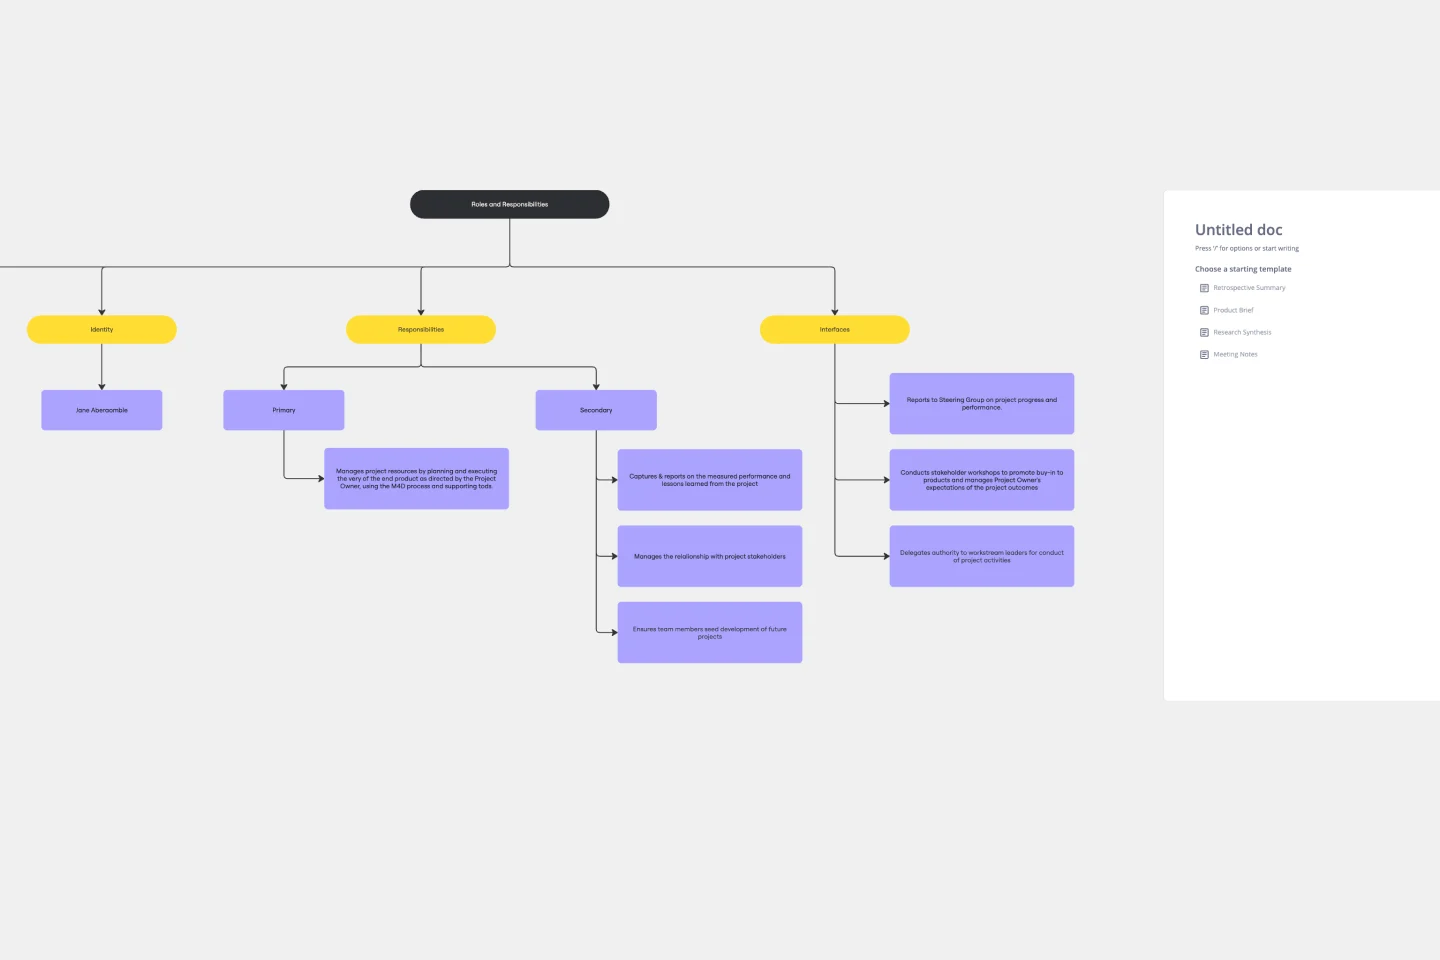
Roles and Responsibilities Template
Works best for:
Organizational Chart, Organizational Design
The Roles and Responsibilities Template is a key tool, acting as a visual compass to guide teams in delineating and understanding every member's specific tasks within a project or organizational setting. Its standout benefit is its clarity, ensuring that each team member is aligned in their tasks, ultimately fostering enhanced collaboration. By eliminating potential ambiguities and misunderstandings about who does what, this template becomes an essential asset for teams aiming for efficiency, cohesiveness, and streamlined project execution. Whether for onboarding, day-to-day operations, or strategic planning, this template acts as a clear map to understand each team member’s responsibilities.
Org Topologies™ 2025
Works best for:
Org Charts, Operations, Mapping
The Org Topologies™ template provides a comprehensive overview of organizational structures. By visualizing different topology models, such as hierarchical, matrix, or network structures, this template helps teams understand organizational dynamics and design effective structures. With examples and explanations of each topology, this template supports informed decision-making in organizational design.
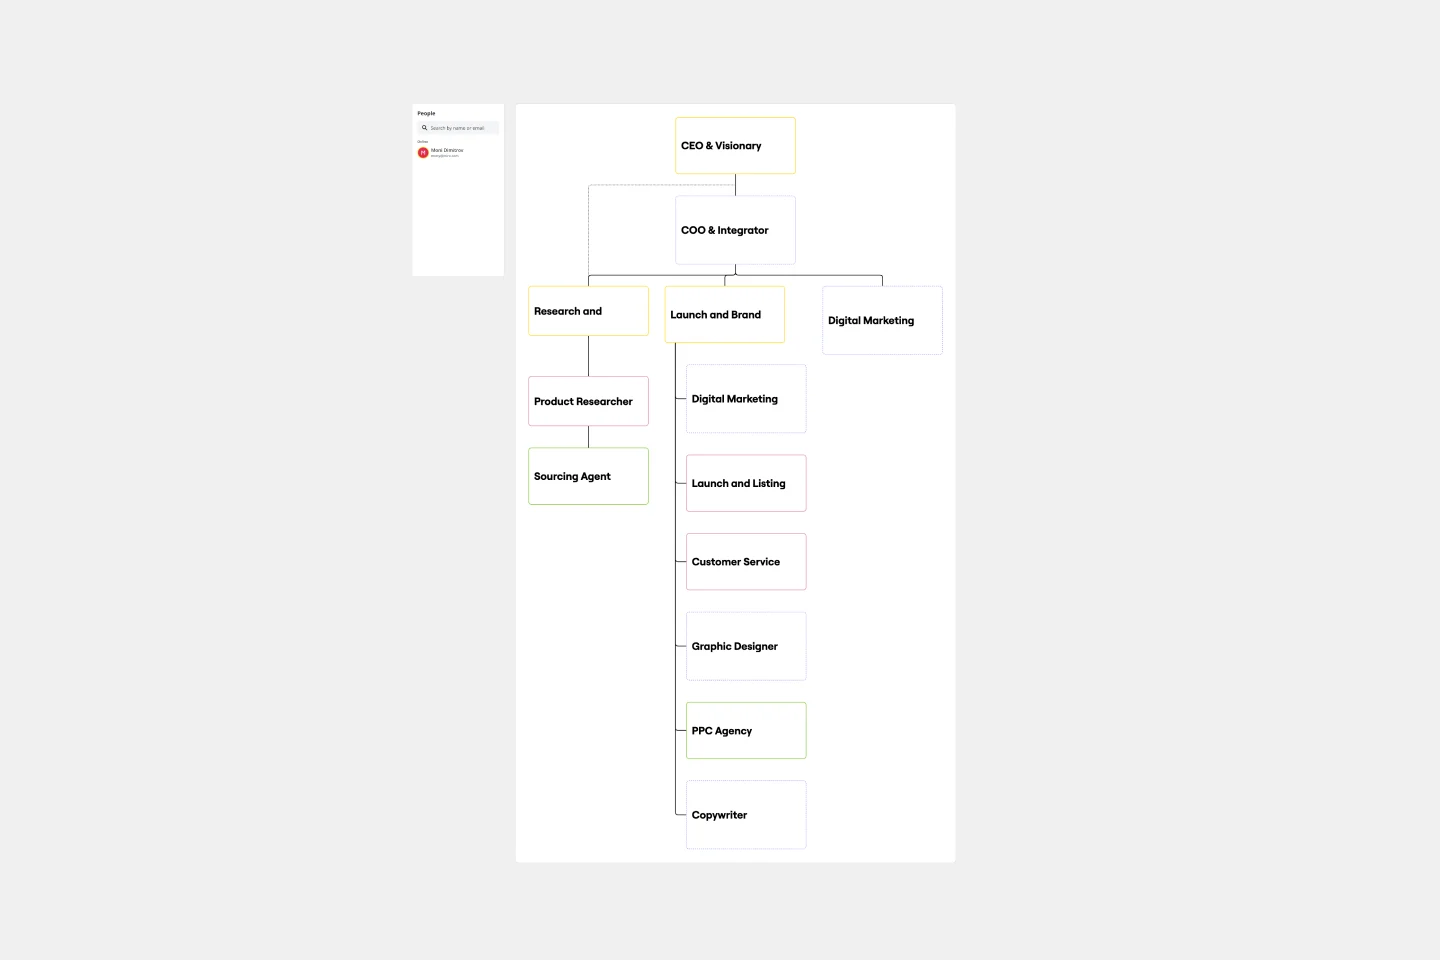
Accountability Chart Template
Works best for:
Organizational Chart, Org Design
The Accountability Chart Template is a visual map detailing the various roles within an organization and the responsibilities tied to each. This systematic layout ensures clarity in defining duties and fosters a culture of accountability. A standout benefit of using this template is its capacity to eliminate role ambiguity. The Accountability Chart template ensures that every team member understands tasks by clearly depicting who is responsible for what. This leads to enhanced productivity and reduced task overlaps or missed assignments.