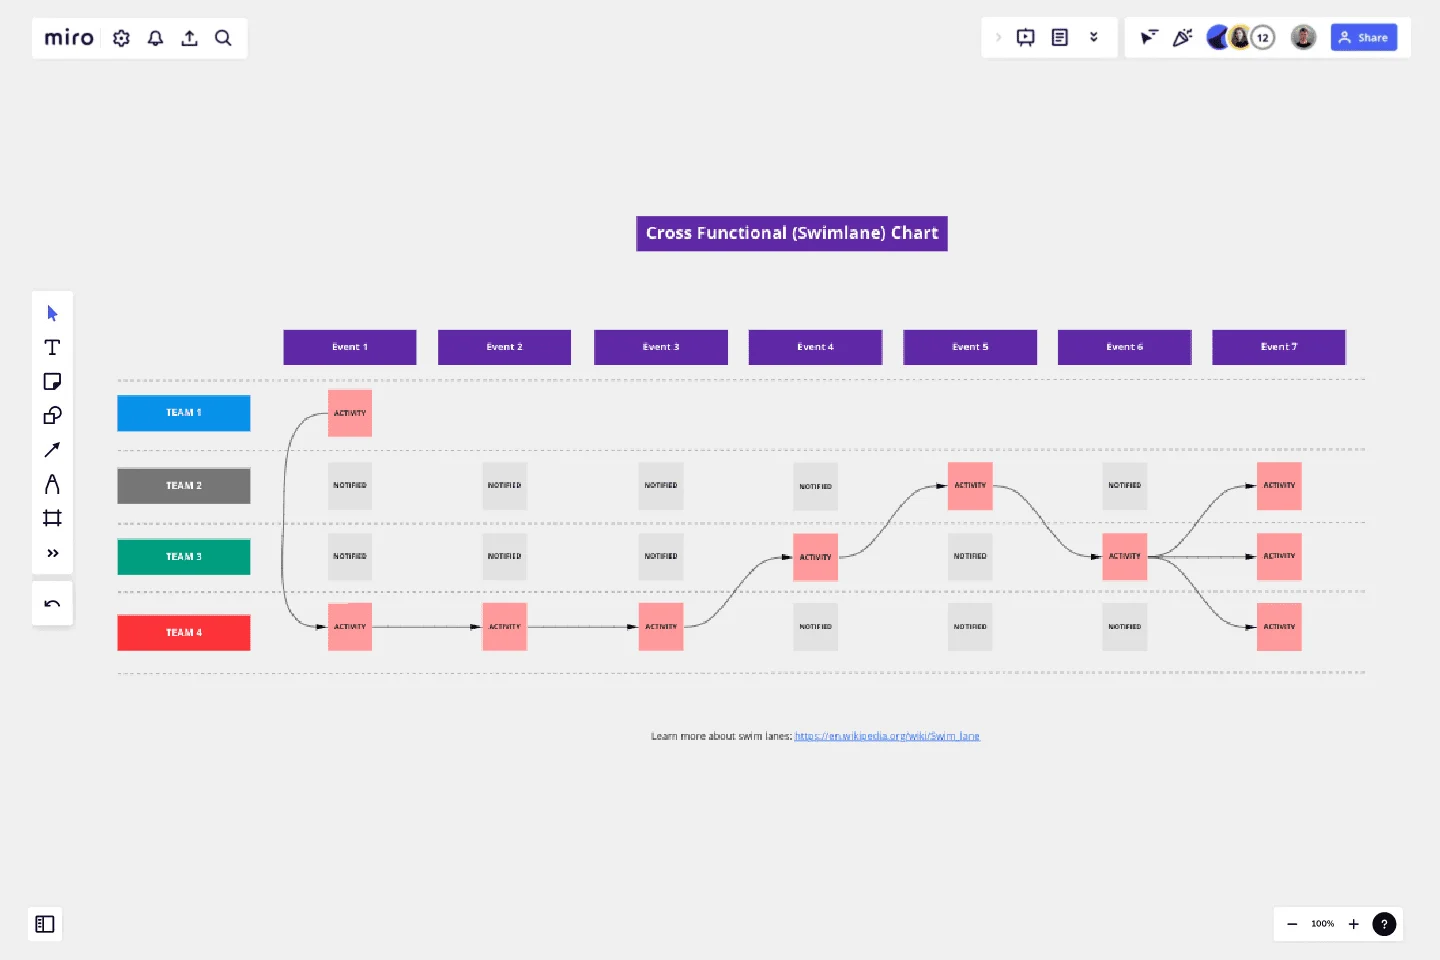
Cross Functional (Swimlane) Chart
Visualize team activity for future planning.
I use this template to visualize how a process moves through various teams, departments or stakeholders, demonstrating steps within a process, the owner of those steps and the inputs as well as output segments noted within the flow.
If you have non-linear processes, what to review INPUT/OUTPUT, or are simply looking to provide an overview of team activities to management or users, then this Cross Functional (Swimlane) Chart is an excellent way to visualize this.
Get started with this template right now.
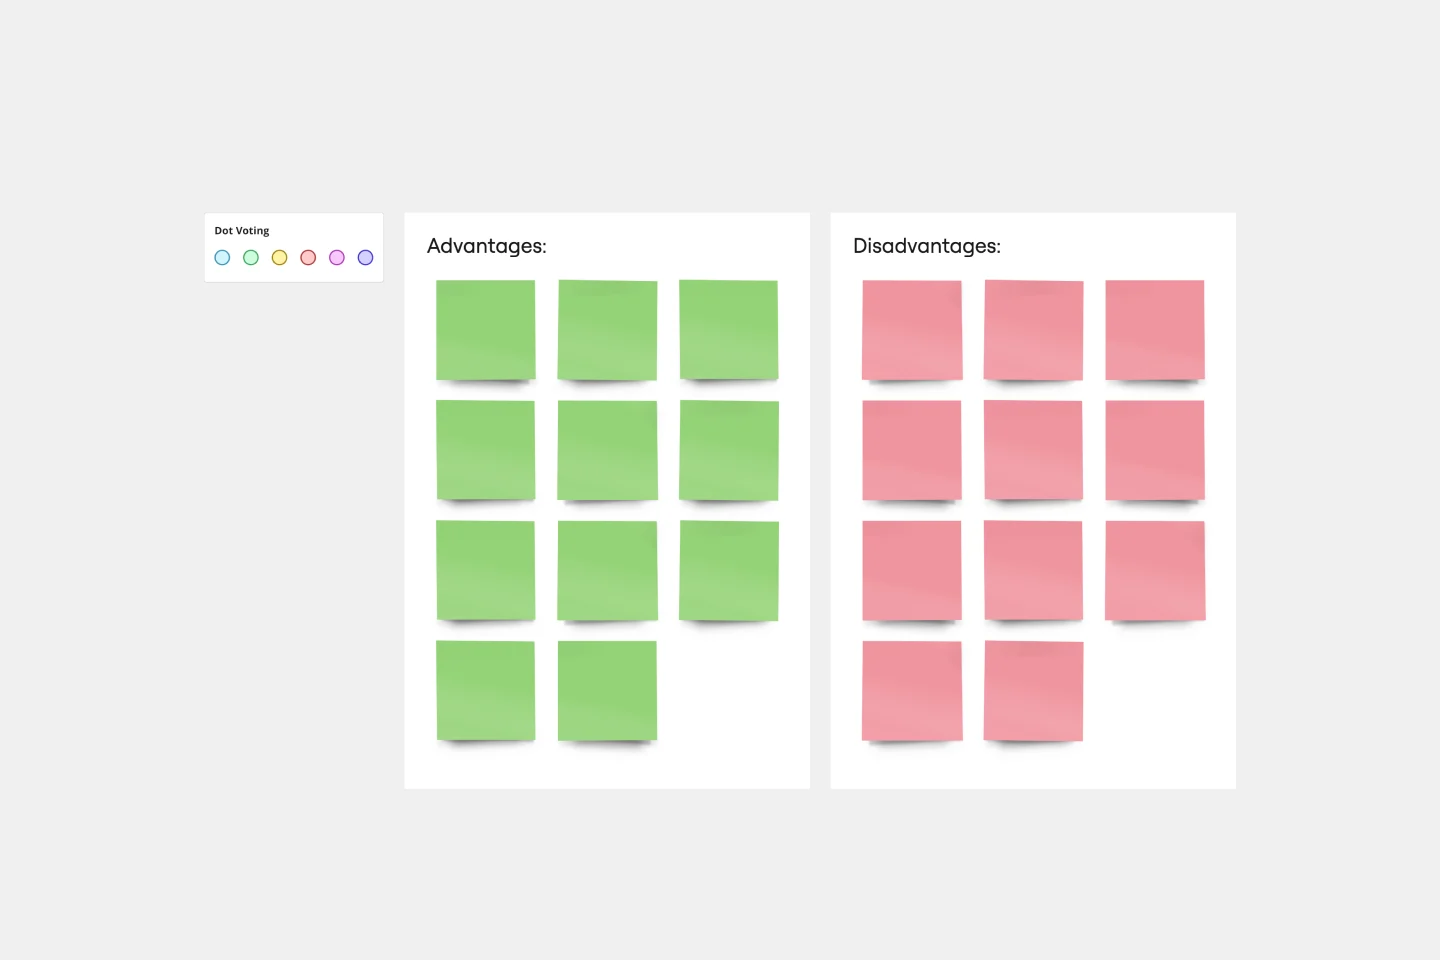
T-Chart Template
Works best for:
Ideation, Operations, Strategic Planning
T-Charts can help you compare and contrast two different ideas, group information into different categories, and prove a change through “before” and “after” analysis. T-Charts are visual organizational tools that enable you to compare ideas, so you can evaluate pros and cons, facts and opinions, strengths and weaknesses, or big-picture views versus specific details. Designers and content creators can use T-Charts to turn possibilities into actionable ideas. T-Charts are useful for discussing differences and similarities with your team or clients and can help you to reach a decision together.
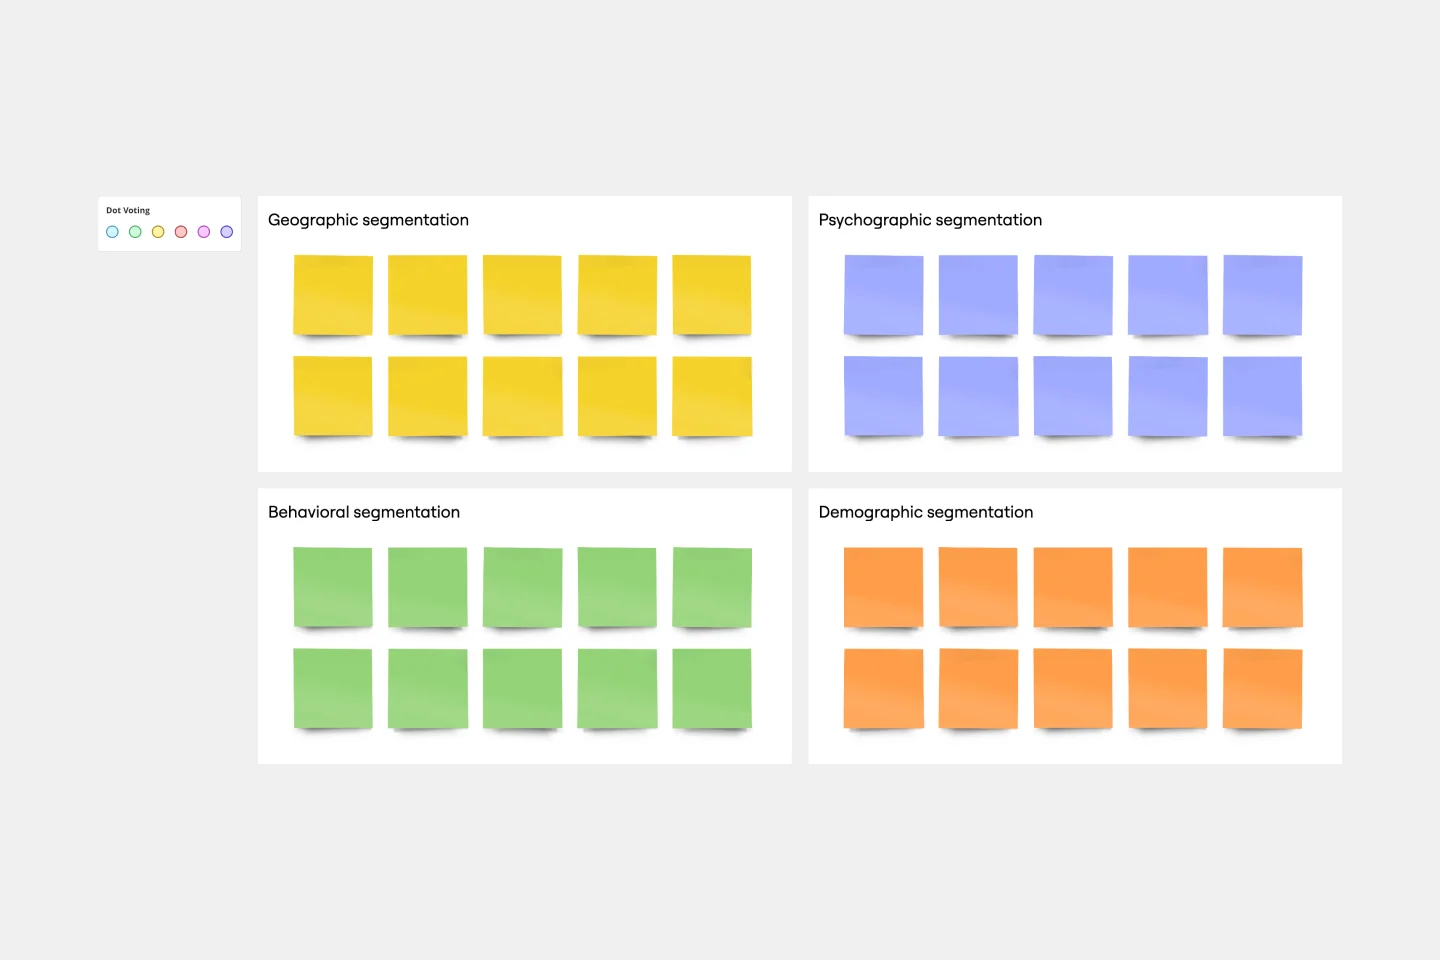
Market Segmentation Matrix Template
Works best for:
Marketing, Strategic Planning, Product Management
Successful, compelling marketing begins and ends with knowing your audience — who they are, where they are, and what they want and expect. A market segmentation matrix will help you understand them on a deeper level. This business tool divides your target market into subsets based on demographics, geography, needs, interests, psychographics, or behavioral characteristics. You can then use these insights and data to hit it out of the park, by building better product, sales, and marketing strategies. Our template lets you set up and populate a Market Segmentation Matrix with ease.
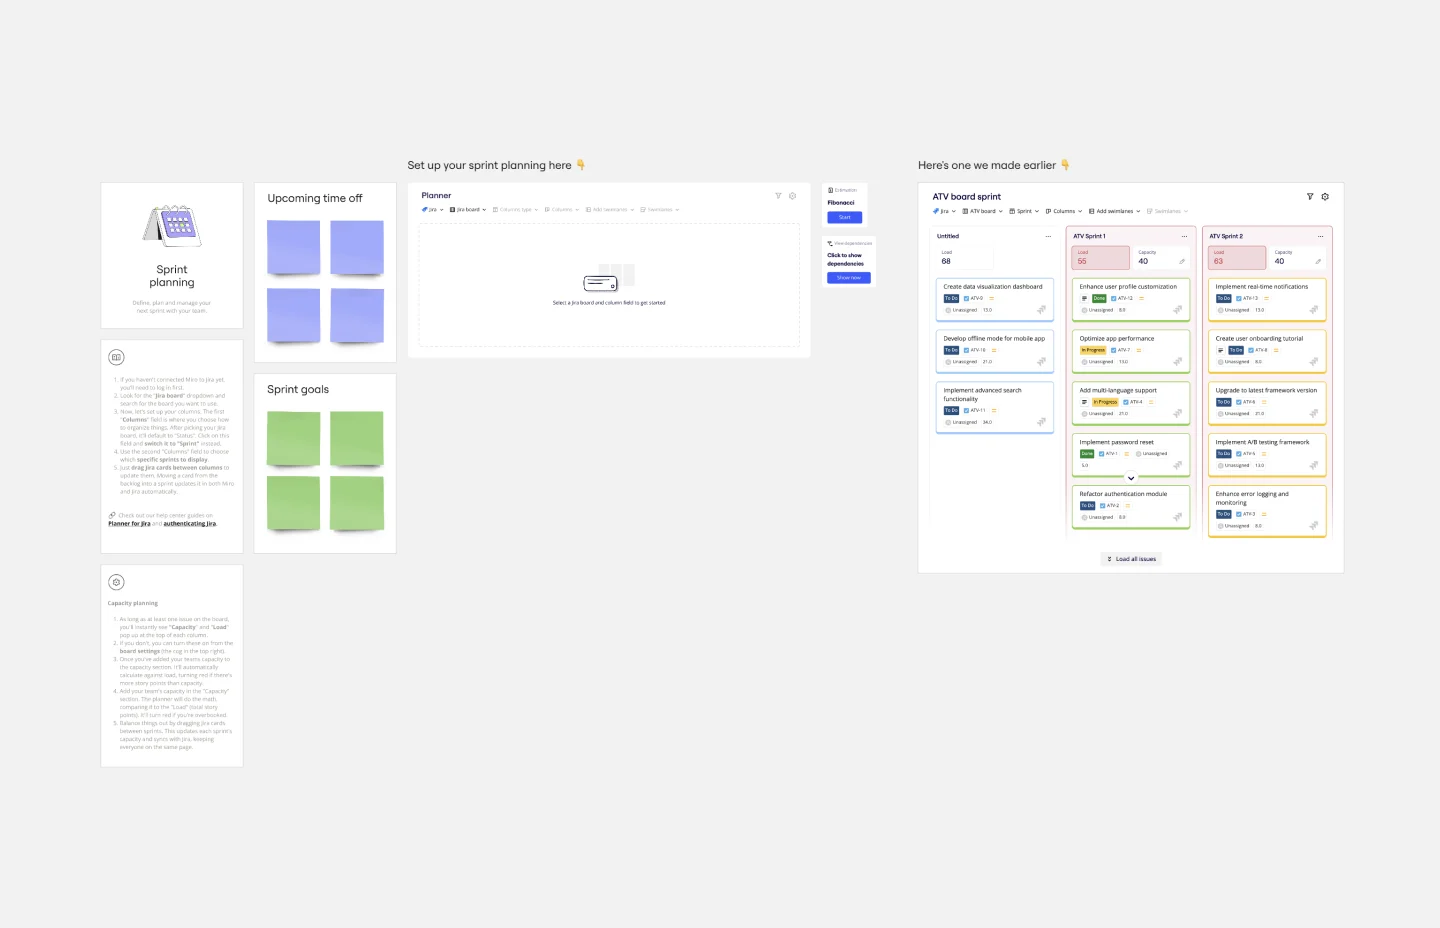
Sprint Planning with Jira Template
Works best for:
Sprint Planning, Agile
The Sprint Planning with Jira template in Miro is a powerful tool designed to streamline and enhance your sprint planning sessions. One of the key benefits of this template is its Jira integration, which saves time and effort when planning and aligning teams. By integrating directly with Jira, the template allows for seamless import and management of tasks, ensuring that all your Jira tickets are up-to-date and easily accessible within Miro. This reduces the need for manual updates and minimizes errors, making the planning process more efficient and effective.
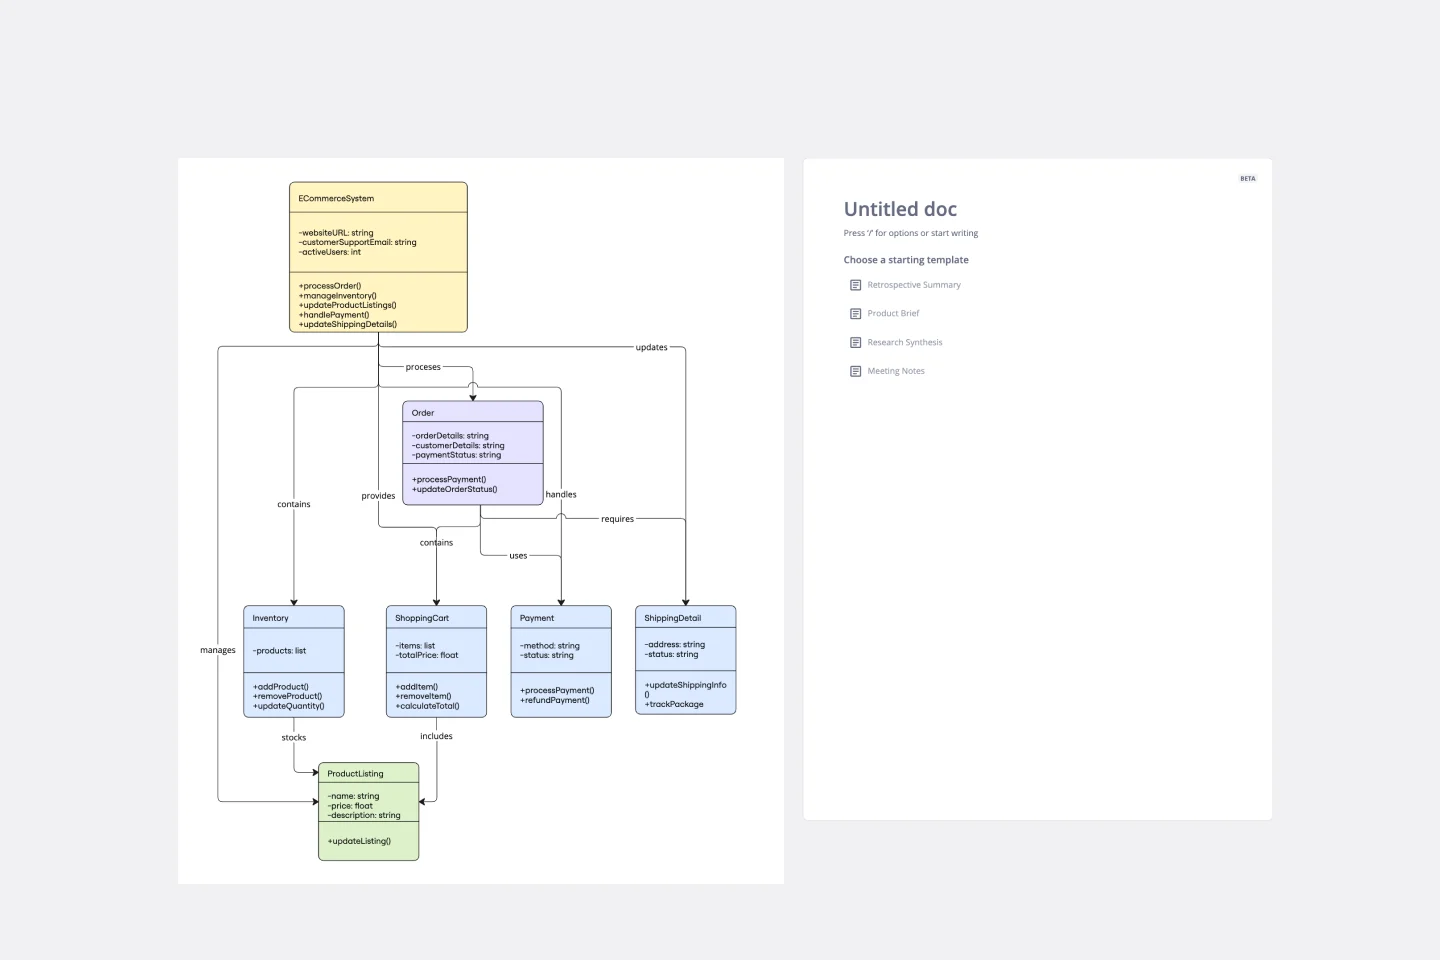
UML Class E-Commerce System Template
Works best for:
UML
The UML Class E-Commerce System Template streamlines the process of creating and visualizing the class structure of an e-commerce system. It provides a comprehensive framework that includes typical online shop features such as product listings, inventory management, shopping carts, orders, payments, and shipping details. This template facilitates a clear understanding of how these elements interact during an online sales transaction, making it an invaluable tool for teams working on e-commerce projects. By using this template, teams can save time, enhance collaboration, and ensure that their system architecture is robust and efficient, ready to adapt to their business's evolving needs.

Product Management Onboarding Map
Works best for:
Product Management, Planning
Product Management Onboarding Map template facilitates the onboarding of new product management team members. By outlining key responsibilities, processes, and stakeholder interactions, this template helps new hires quickly acclimate to their roles. With sections for setting learning objectives and resources, it supports structured onboarding experiences, ensuring that new team members are equipped with the knowledge and tools needed to contribute effectively to product initiatives.

Fishbone Diagram for Service Improvement
Works best for:
Fishbone diagram
The Basic Fishbone Diagram, also known as the Ishikawa or cause-and-effect diagram, is a powerful tool for identifying the root causes of problems. Use this template to systematically explore and document potential causes of an issue, categorizing them into key areas such as people, processes, equipment, and materials. This visual approach helps teams collaborate on problem-solving, ensuring all factors are considered and addressed effectively.