Context Diagram Template
See how external entities impact your system from a broad perspective.
About the Context Diagram Template
A context diagram lays out an entire software system as a single process and displays how external entities interact with the system.
The system can be a website, application, platform, or product. The external entity could be a customer, manager, teams within the same organization, other companies, and more.
The diagram is used in the discovery phase of a new project. It helps business analysts and stakeholders get an overview of the scope of the system. Management can then voice their concerns and give feedback before the project begins.
A context diagram is often referred to as a system context diagram or level 0 data flow diagram.
A data flow diagram (DFD) at subsequent levels shows the data flow through a system and contains additional information that a context diagram does not. As a level 0 DFD, a context diagram shows the highest-level overview of a system without going into detail.
The benefits of a context diagram
Here are the key benefits of a context diagram:
1. Gives a visual overview of a plan or project scope
A context diagram helps project stakeholders understand an entire software system at a single glance. It visualizes a project plan or project scope at a high level.
2. Helps you notice errors or omissions
Because the entire system is laid out in a simple, dynamic diagram, it helps teams and management identify errors in a business plan or project requirement. A context diagram can also be used to identify issues within an existing system.
3. Easy to make amendments
Context diagrams are easy to modify as new information is provided. You can edit, add, and remove every element of the diagram when there is a change in the system or an external factor.
4. Very customizable
Teams can customize an online context diagram using whichever shapes, colors, or fonts they want. They can add elements, reorganize existing ones, or simply change the visual aspects to best reflect a project's system.
5. Helps you identify your target user
Since a context diagram outlines an application's user groups and how they interact with it, developers can identify their core user groups. This then helps investors decide which projects to invest in.
6. Does not require technical knowledge
You don't need technical knowledge or coding experience to create a context diagram. Anyone can use an online tool like Miro to make one in a few minutes.
How to use your context diagram template
You can use our visual workspace to create and share context diagrams for all your projects. First, get our context diagram template and follow these steps:
Step 1:
Place your system in the center circle. Your system is the main process — it’s the focal point of the context diagram. All the other elements interact with this circle.
Step 2:
Use squares or rectangles to list external entities that interact with the system. Place them around the circle.
Step 3:
Use arrows to and from the center circle to show how the external entities communicate with the system.
Step 4:
Share your diagram with others for their feedback. Miro makes it simple to collaborate, edit, and present your Context Diagram through its interactive diagram maker.
Common use case of an effective context diagram template
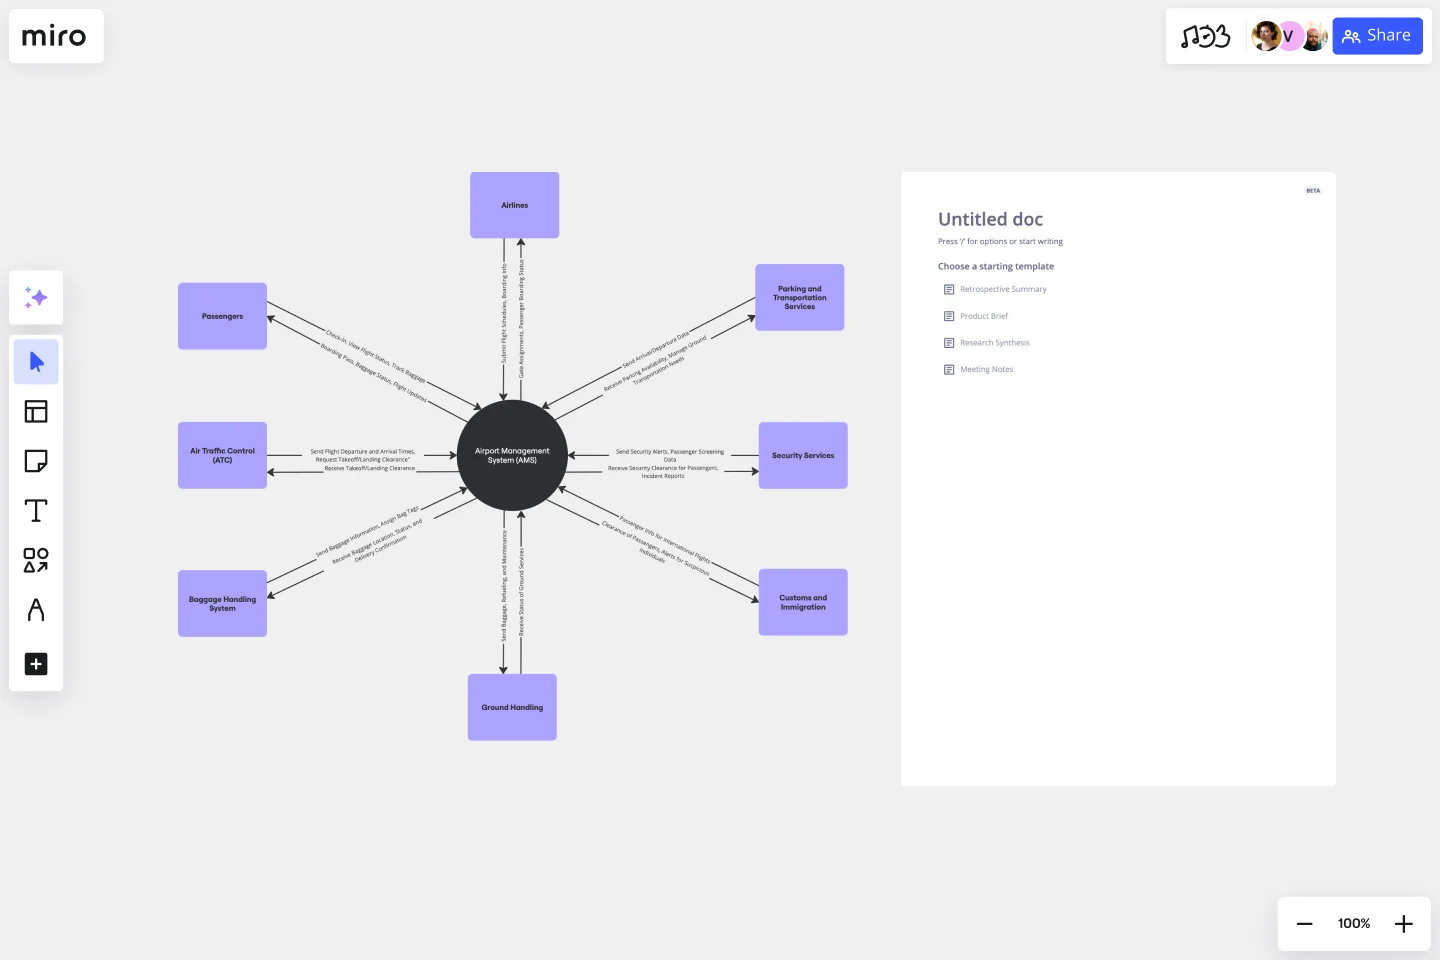
To help you better understand how our context diagram template works, let's consider a system built for a sales order. In this scenario, managers, employees, and customers interact to produce a sales order.
In a detailed and factually correct sales order, a customer buys the product and receives a sales order in return. Employees send updates and products into the system, while managers add new workers and receive data about existing employees and vendors.
A context diagram for this system will have "Sales Order System" in the center circle. The external entities are "Customers," "Employees," and "Managers."
You can draw arrows to represent an interaction. For example, you can add an arrow from Sales Order to Customer, saying "Order Invoice" to indicate that the system will send the invoice to the customer.
What should be included in a context diagram?
A context diagram must include a system or process at the center that is surrounded by external entities. Arrows are used to represent the data flow between the system and each external element.
What is the difference between a DFD and context diagram?
A data flow diagram (DFD) is a flowchart that shows data flow throughout a system. A context diagram is focused on the external entities. It shows the entire system as one element and highlights its relationship with external factors.
How do you create a context diagram?
Creating a context diagram is easy with Miro. All you have to do is select the context diagram template and edit the existing elements to represent your system. You can change the arrows to depict interactions and customize the visuals as required.
Get started with this template right now.
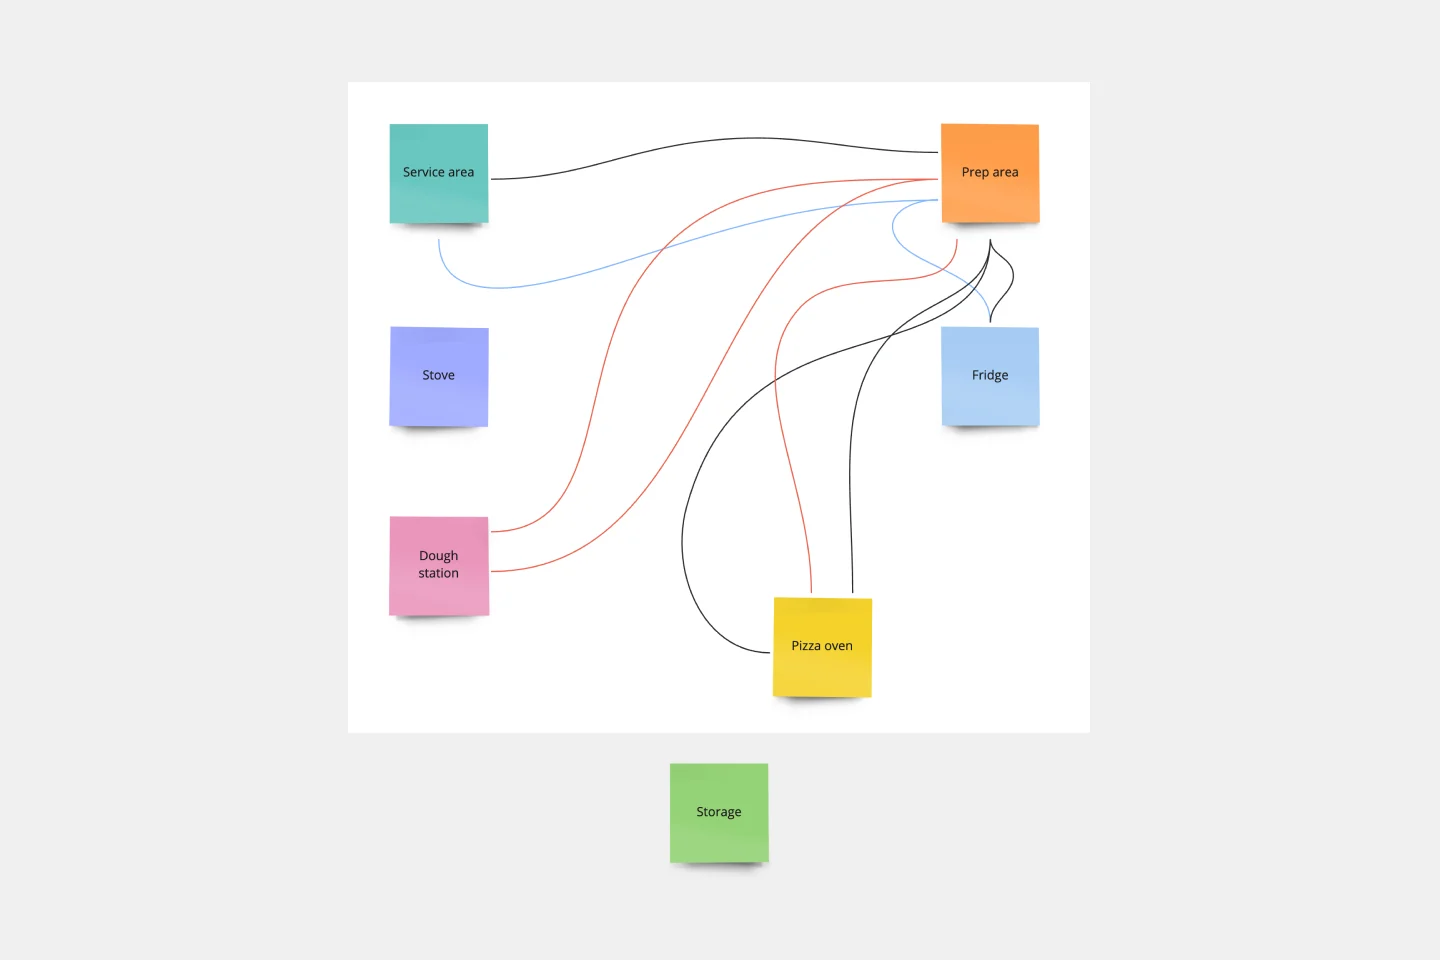
Spaghetti Diagram Template
Works best for:
Operations, Mapping, Diagrams
Spaghetti diagrams are valuable for finding connections between assets, services, and products, as well as identifying dependencies in a visual way. Use this template to get an overview of a process and quickly find areas of improvement.
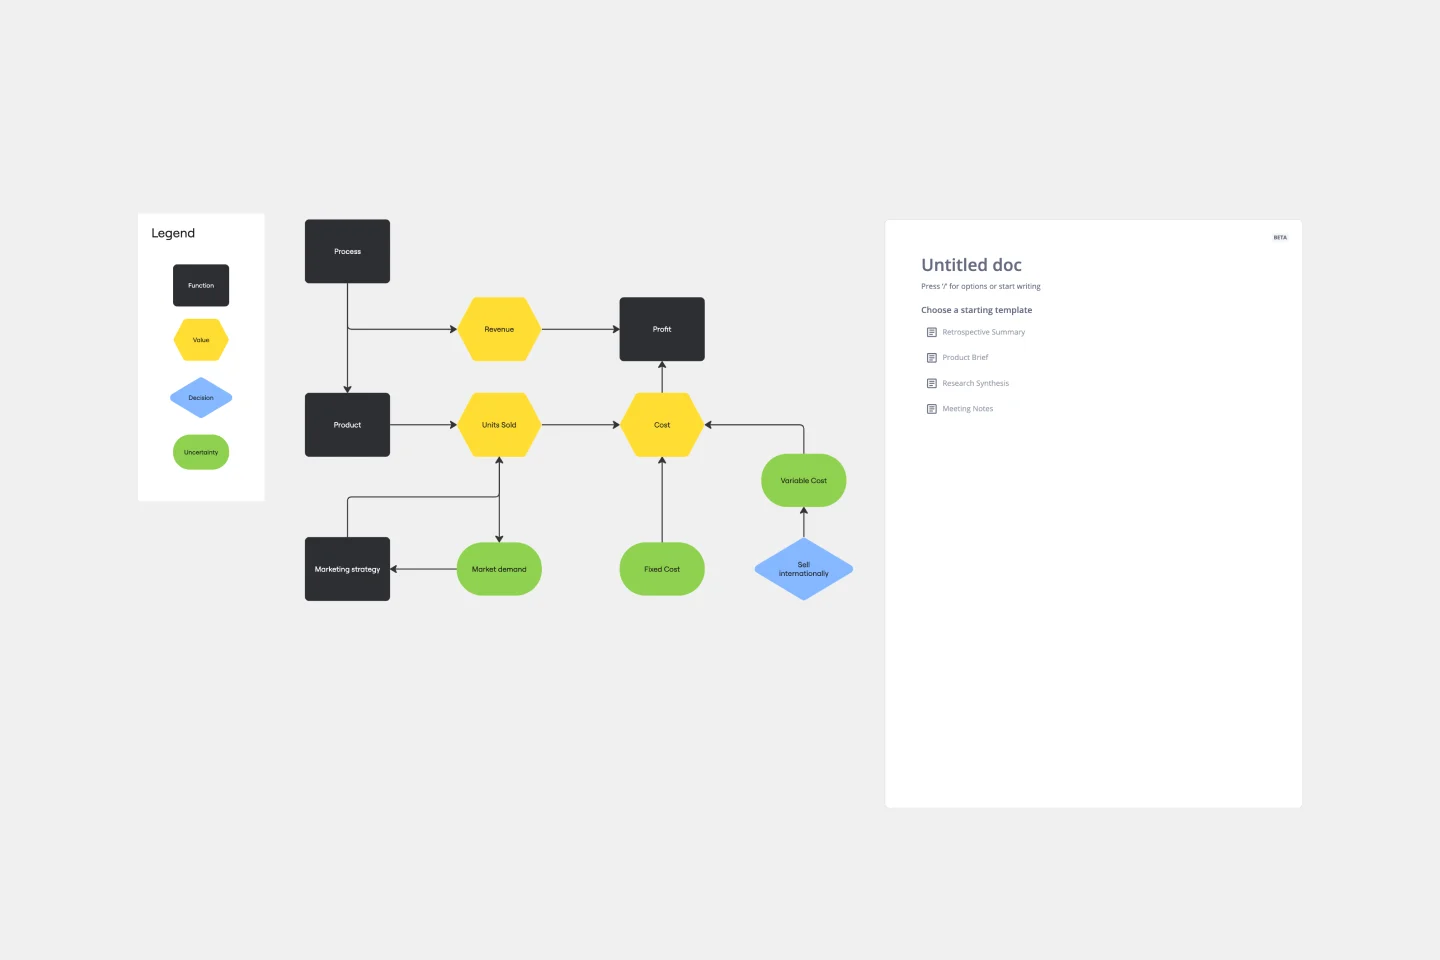
Influence Diagram Template
Works best for:
Business Management, Decision Making, Diagrams
See the big picture of any business decision with this Influence Diagram Template. You’ll define the decision you have to make and brainstorm everything that could impact it. When you build connections between these factors, you’ll be able to put the right amount of weight into each one as you make your decision.
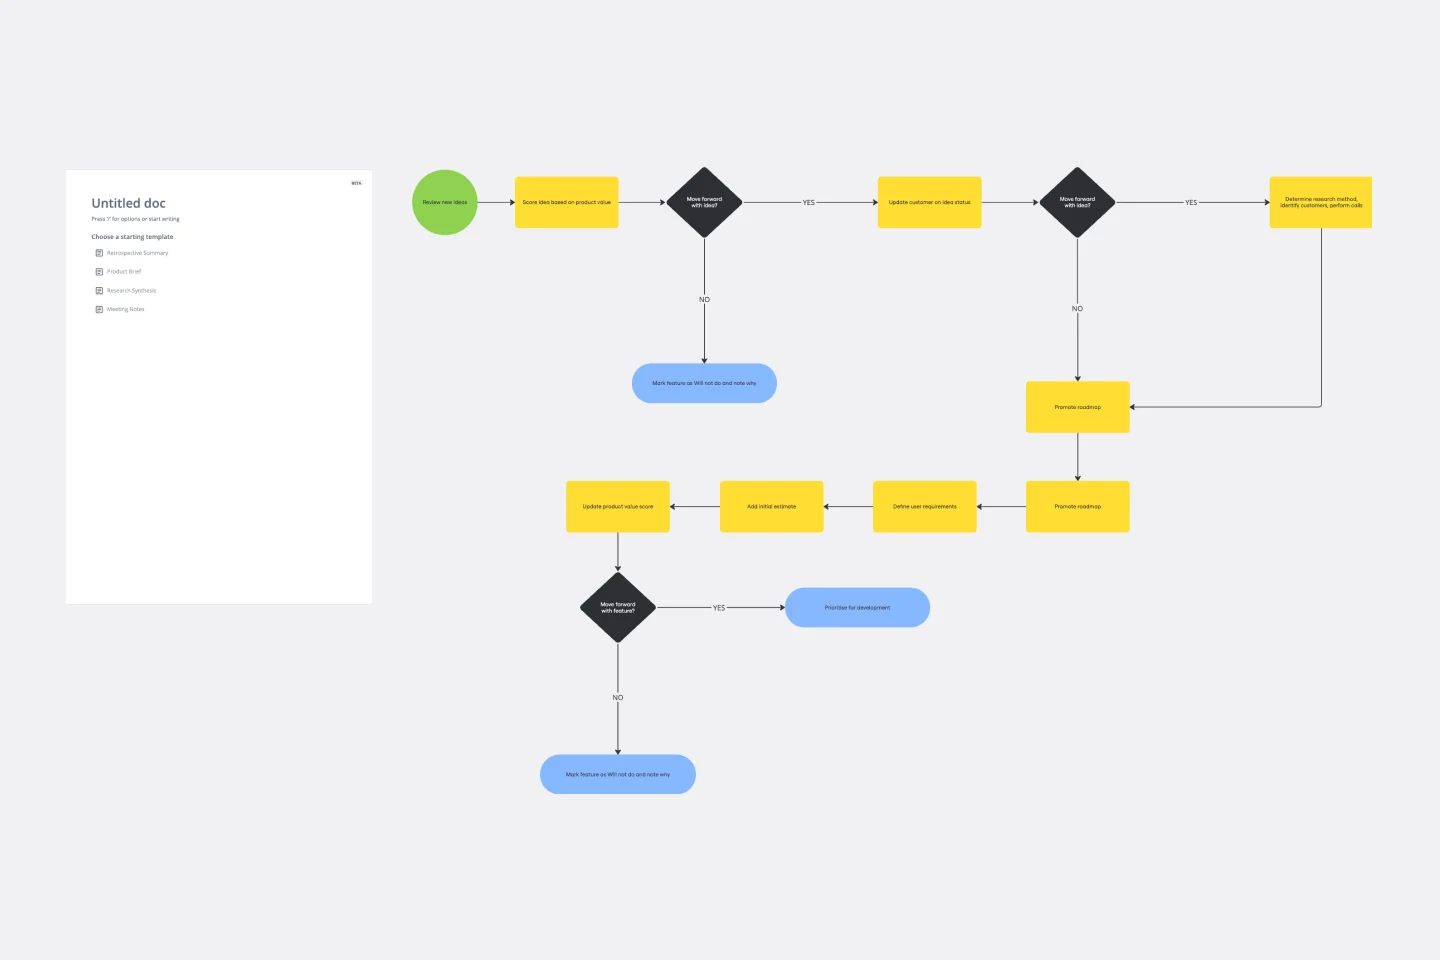
Workflow Diagram Template
Works best for:
Diagramming, Mapping, Process mapping
The Workflow Diagram Template maps out and represents processes or systems using standardized symbols and shapes. By delineating the various steps or stages in a process, it ensures that tasks flow seamlessly from initiation to completion. One of the standout benefits of using this template is its clarity. By translating processes into a visual format, all participants can gain a comprehensive understanding at a glance, eliminating confusion and ensuring everyone is on the same page. This clarity not only promotes efficient task execution but also fosters collaboration among team members.