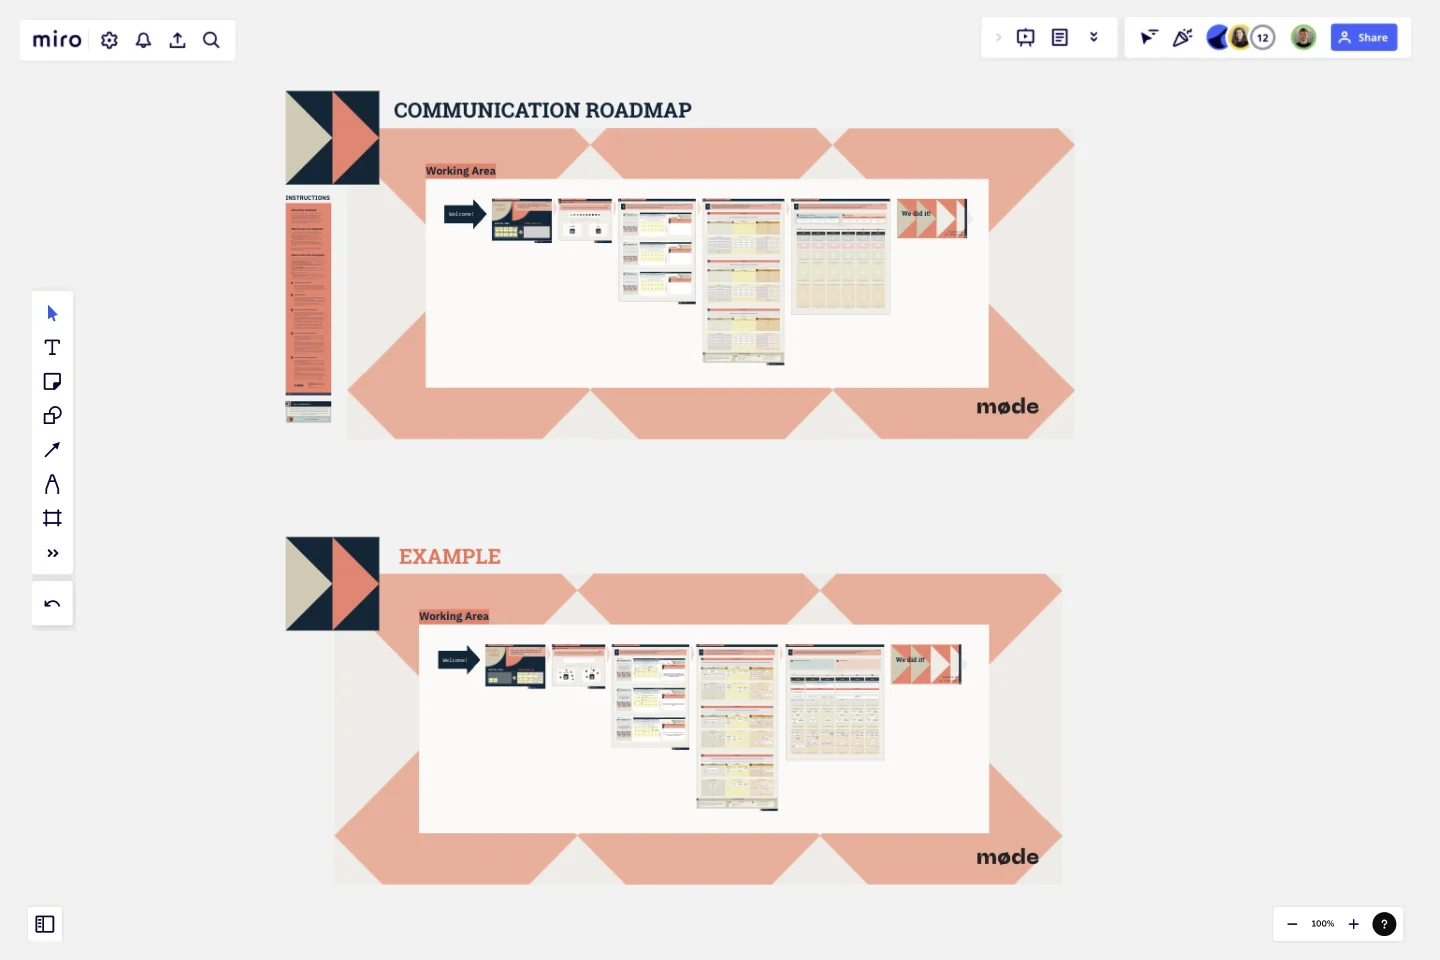
Communication Roadmap
This template is a part of our full two-day workshop dedicated to developing a brand communication strategy. It can help your team move from the existing brandbook / brand information to relevant communication messages that align with the current development and communication objectives.
About the template
In our daily practice of working with clients, we at Møde often come across a situation where the brand concept has already been developed and approved by decision makers, but their teams have difficulty translating it into reality at the level of communication messages — general messages that in an understandable form characterize the idea of the brand and its role for the end consumer.
This template is a part of our full two-day workshop dedicated to developing a brand communication strategy. It can help your team move from the existing brandbook / brand information to relevant communication messages that align with the current development and comminucation objectives.
Why to use our template
Our template allows you to stay focused on the current communication goals of the brand team as well as on the main assets of the brand itself (its key idea, functional benefits, attributes etc). In these related exercises, you will first formulate your brand's most important messages, and then:
identify the key audiences to whom the messages may be relevant
select brand attributes that can be demonstrated in communications to support and detail your messages
create a unique ecosystem of channels and touchpoints for broadcasting them.
At the end of this mini-workshop, you will be able to develop a detailed communication roadmap, which will illustrate and interrelate all the entities listed above. You can subsequently pass this roadmap on to the creative team to develop specific creatives that convey the messages highlighted on the plan to the appropriate audience groups.
Due to the well-built UX-design of each frame, you will not experience any difficulties with transferring board elements from one exercise to another, with their editing, prioritization and final visualization.
Get started with this template right now.
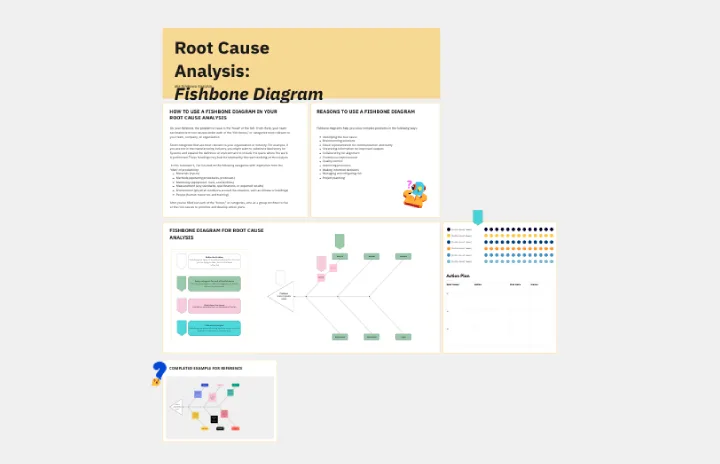
Fishbone RCA
Works best for:
Problem solving, Strategy
Use the Fishbone RCA template to conduct a thorough root cause analysis (RCA) for any problem. This template helps you break down complex issues into manageable categories, enabling you to identify the underlying causes. It's an effective tool for improving processes, solving problems, and preventing future issues.
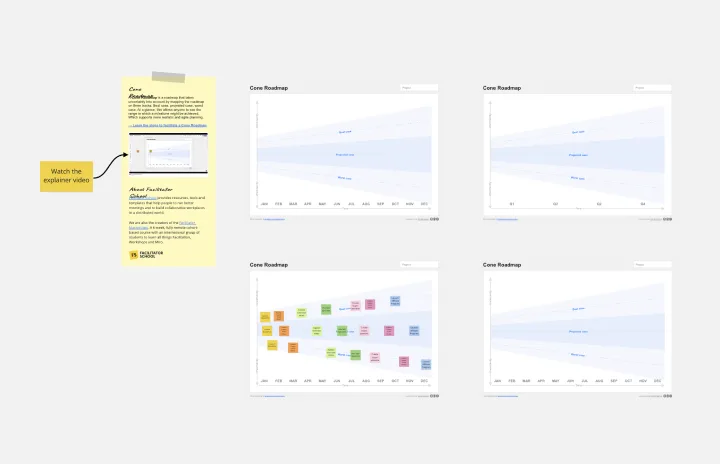
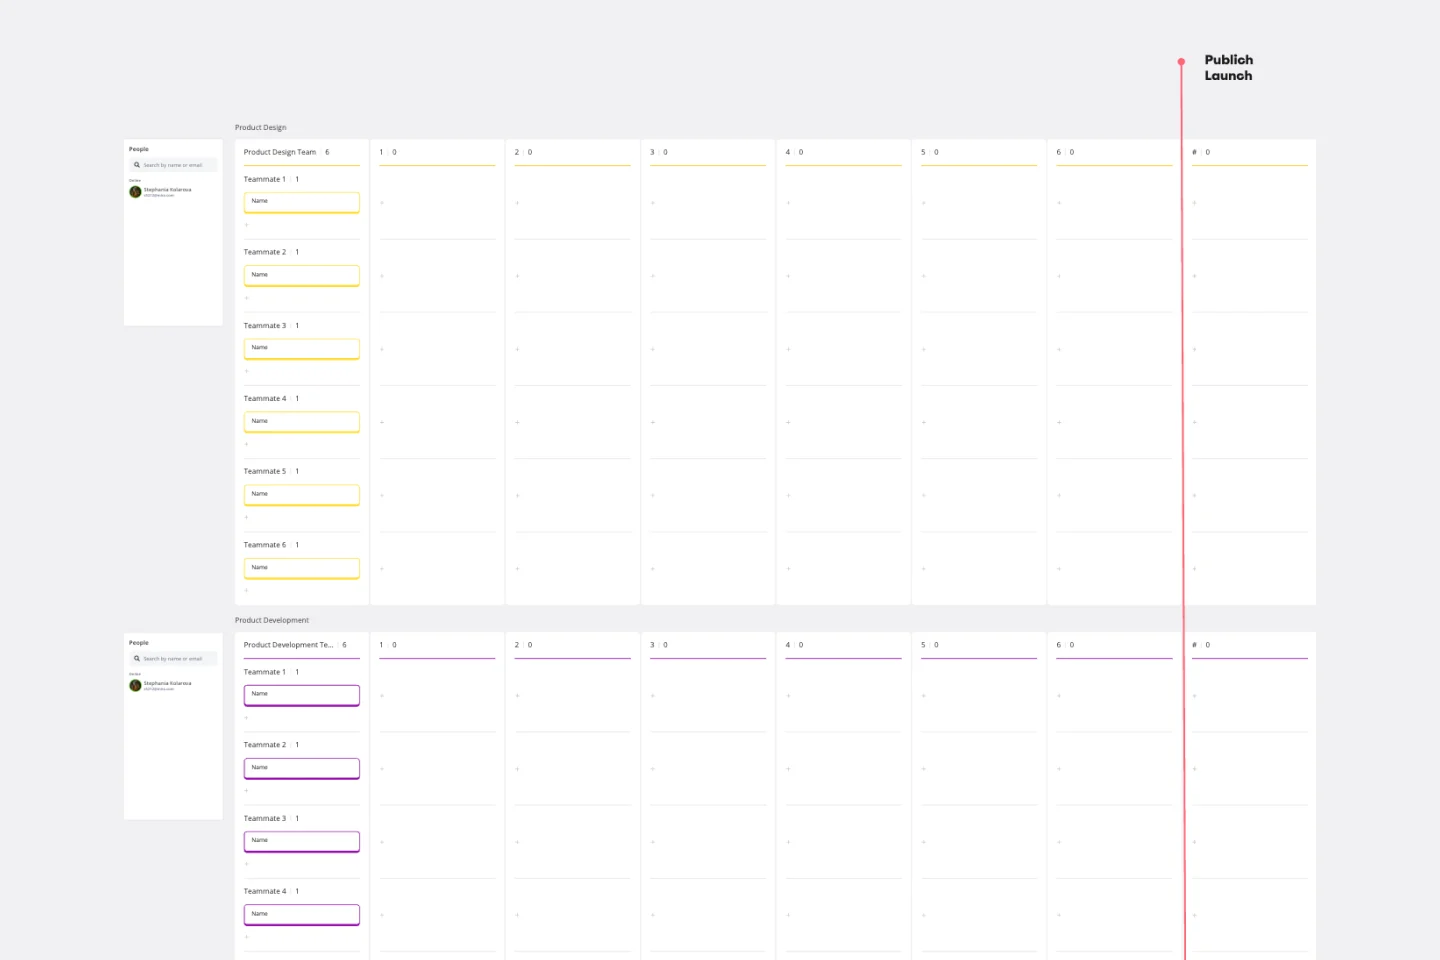
Cone Roadmap
Works best for:
Roadmap, Planning, Mapping
The Cone Roadmap template offers a visual representation of project timelines and dependencies, with a focus on narrowing scope over time. By starting with broad initiatives and gradually refining them into actionable tasks, teams can manage complexity and ensure alignment with strategic goals. This template promotes transparency and adaptability, empowering teams to respond effectively to changing priorities and market dynamics.
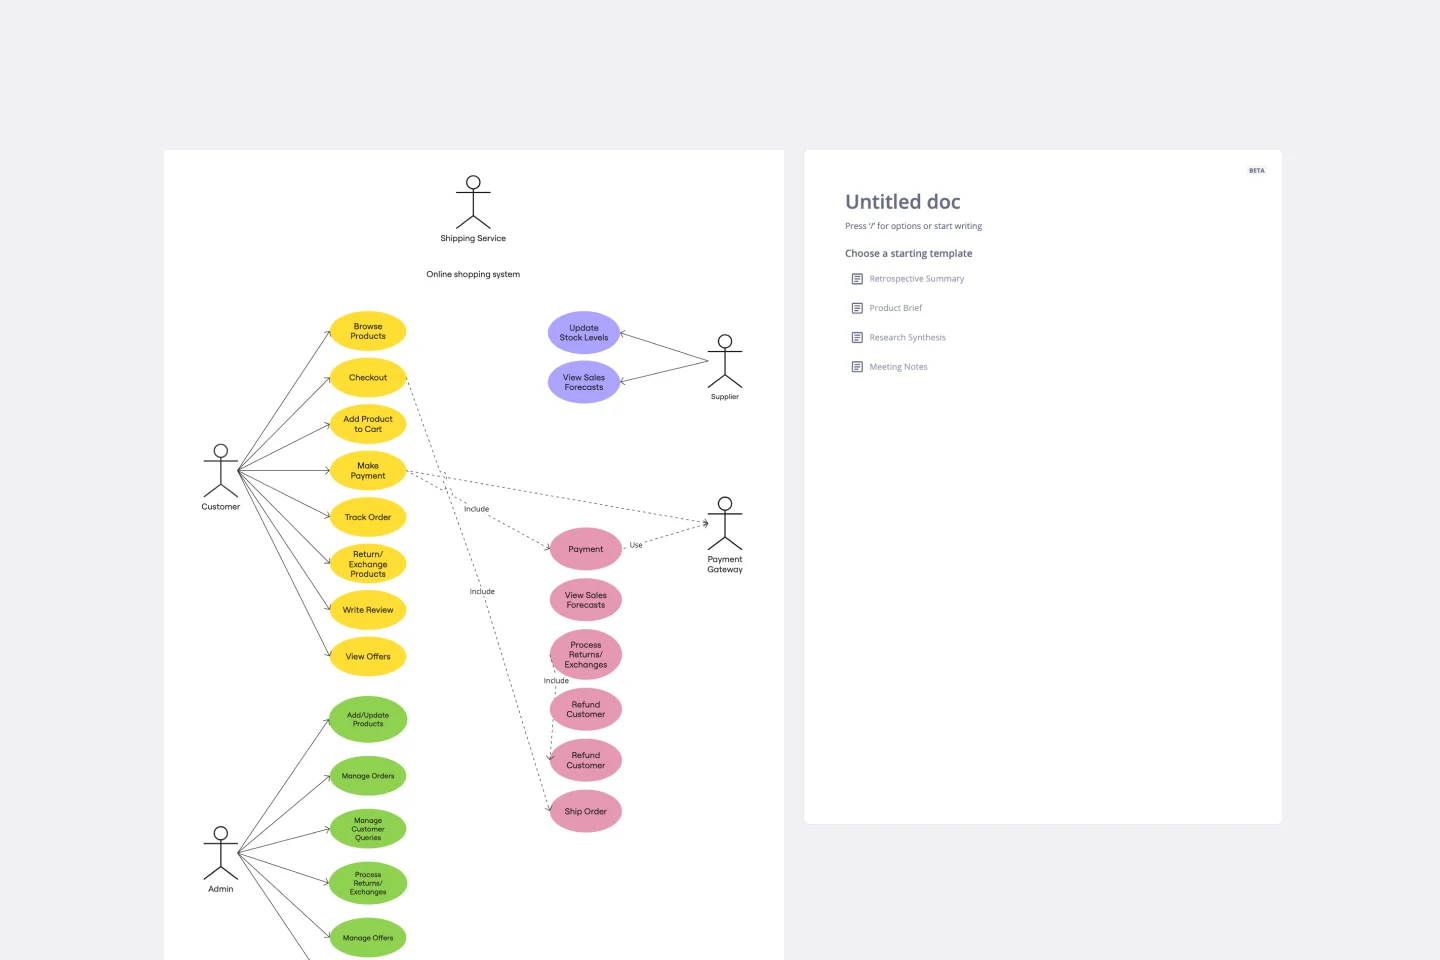
UML Use Case Online Shopping System Template
Works best for:
UML
The Online Shopping System Template simplifies the process of documenting and visualizing how users interact with an online shopping system. It provides a standard way to map out user interactions, such as product listings, inventory management, shopping carts, order processing, payments, and shipping details. By using this template, teams can collaborate effectively in real-time or at different times, adjusting the diagram to meet their project's specific needs. This not only improves clarity and efficiency but also fosters better communication among team members and stakeholders, ensuring a thorough understanding of the system's design and requirements.
Product Roadmap Template
Works best for:
Product Management, Roadmaps
Product roadmaps help communicate the vision and progress of what’s coming next for your product. It’s an important asset for aligning teams and valuable stakeholders – including executives, engineering, marketing, customer success, and sales – around your strategy and priorities. Product roadmapping can inform future project management, describe new features and product goals, and spell out the lifecycle of a new product. While product roadmaps are customizable, most contain information about the products you’re building, when you’re building them, and the people involved at each stage.
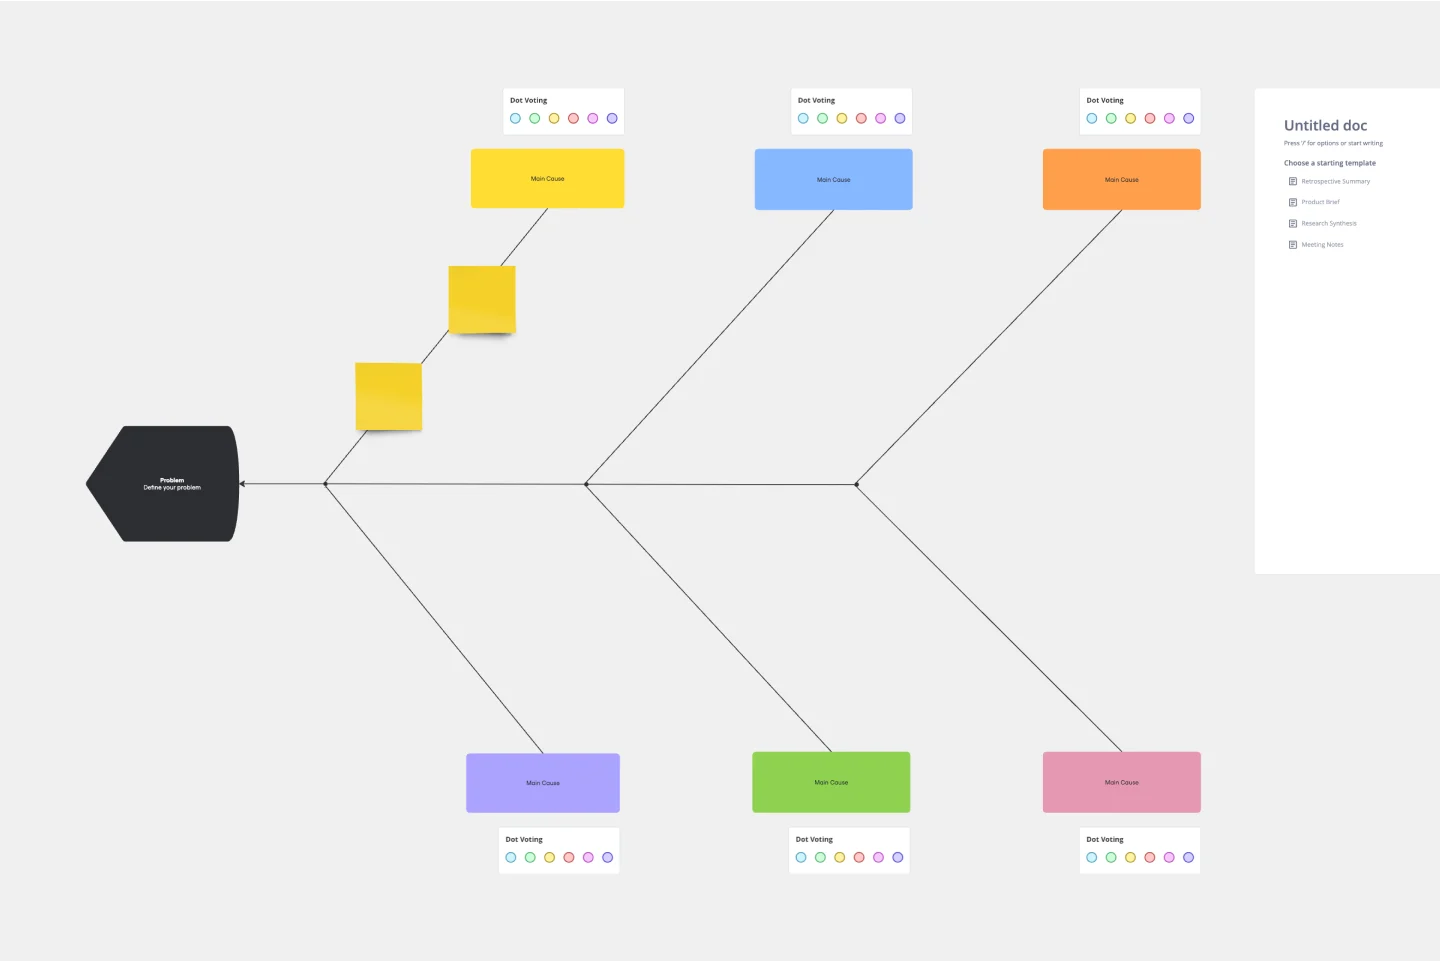
Fishbone Diagram Template
Works best for:
Operations, Diagrams, Workflows
What is the best way to solve any problem your team faces? Go straight to the root. That means identifying the root causes of the problem, and fishbone diagrams are designed to help you do it best. Also known as the Ishikawa Diagram (named after Japanese quality control expert Kaoru Ishikawa), fishbone diagrams allow teams to visualize all possible causes of a problem, to explore and understand how they fit together holistically. Teams can also use fishbone diagrams as a starting point for thinking about what the root cause of a future problem might be.
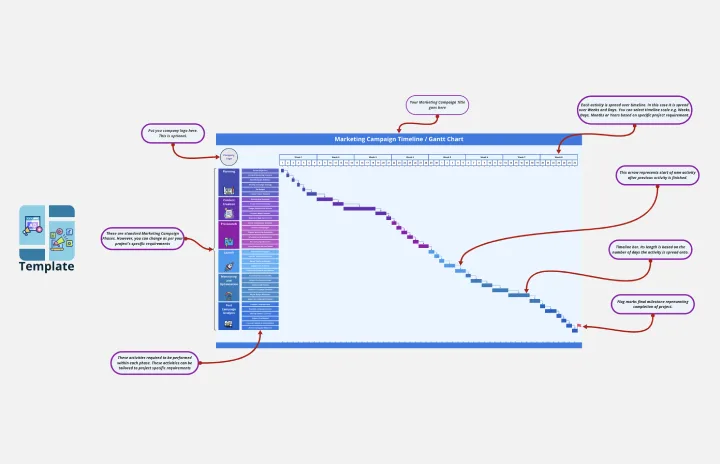
Marketing Campaign Timeline
Works best for:
Timeline, Planning
Plan and execute your marketing strategies seamlessly with the Marketing Campaign Timeline template. This tool allows you to map out every stage of your campaign, from planning to launch and analysis. Visualize key milestones, set deadlines, and track progress to ensure your marketing efforts are well-coordinated and effective. Ideal for marketing teams looking to optimize their campaign management.