On-Premise to Cloud Migration Process Flowchart Template
Break down the cloud migration process into manageable steps.
Available on Enterprise, Business, Education plans.
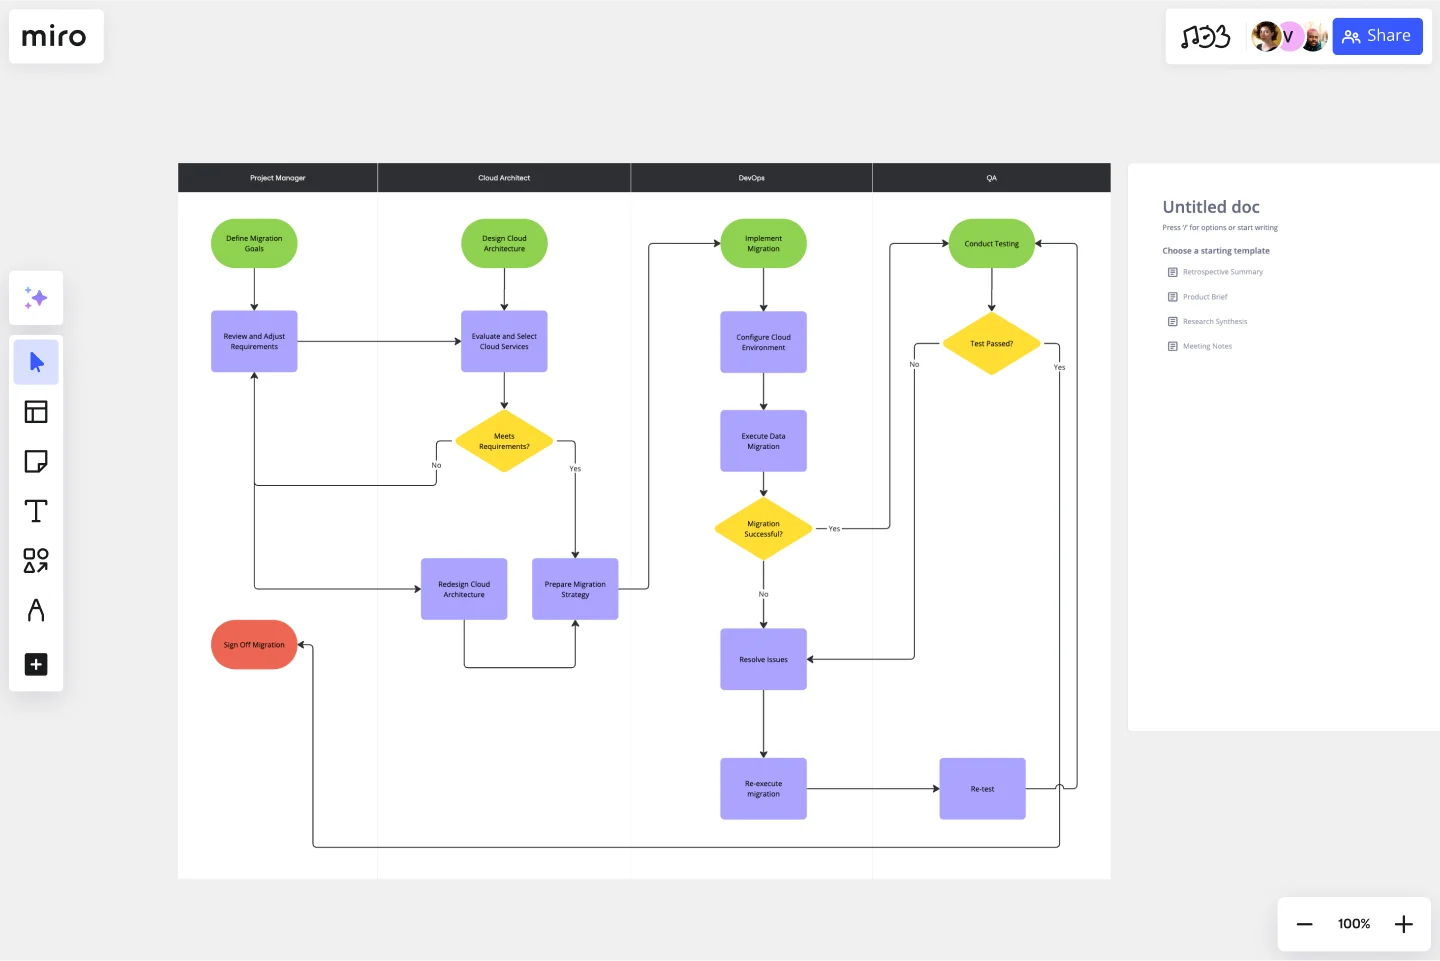
About the On-Premise to Cloud Migration Process Flowchart Template
The On-Premise to Cloud Migration Process Flowchart Template simplifies the complex journey of migrating on-premise systems to a cloud-based infrastructure. This template serves as a visual guide, outlining each critical step in the migration process, from initial assessment to the final transition. By leveraging this template, organizations can ensure a structured and efficient migration, minimizing risks and aligning with best practices in cloud adoption.
How to use the On-Premise to Cloud Migration Process Flowchart Template
Customize the flowchart: Once the template is on your board, you can customize it to fit your specific migration project. This includes adding, removing, or modifying steps to align with your organization's processes.
Collaborate with your team: Invite team members to collaborate on the board. Miro's collaborative features allow multiple users to edit, comment, and provide feedback in real time, ensuring a cohesive migration strategy.
Assign tasks: Use Miro's task management features to assign responsibilities for each step of the migration process. This ensures accountability and helps track progress throughout the migration journey.
Review and iterate: As the migration progresses, use the flowchart to review completed steps and plan upcoming activities. The flowchart's visual nature makes it easy to identify bottlenecks or areas requiring additional focus.
Why use the On-Premise to Cloud Migration Process Flowchart Template
Clarity and visibility: The template clearly shows the migration process, making it easier for stakeholders to understand the project's scope and progress.
Efficiency: The template streamlines activities, reduces redundancies, and ensures that nothing is overlooked by outlining each step in the migration process.
Collaboration: Miro's collaborative environment enhances team coordination, allowing for real-time updates, feedback, and task management.
Flexibility: The template is customizable, enabling organizations to tailor the flowchart to their specific needs and migration strategies.
Risk Mitigation: By providing a structured approach to migration, the template helps identify potential risks early in the process, allowing for proactive mitigation strategies.
Discover work breakdown structure examples for your IT projects and create the next big thing.
Get started with this template right now. Available on Enterprise, Business, Education plans.
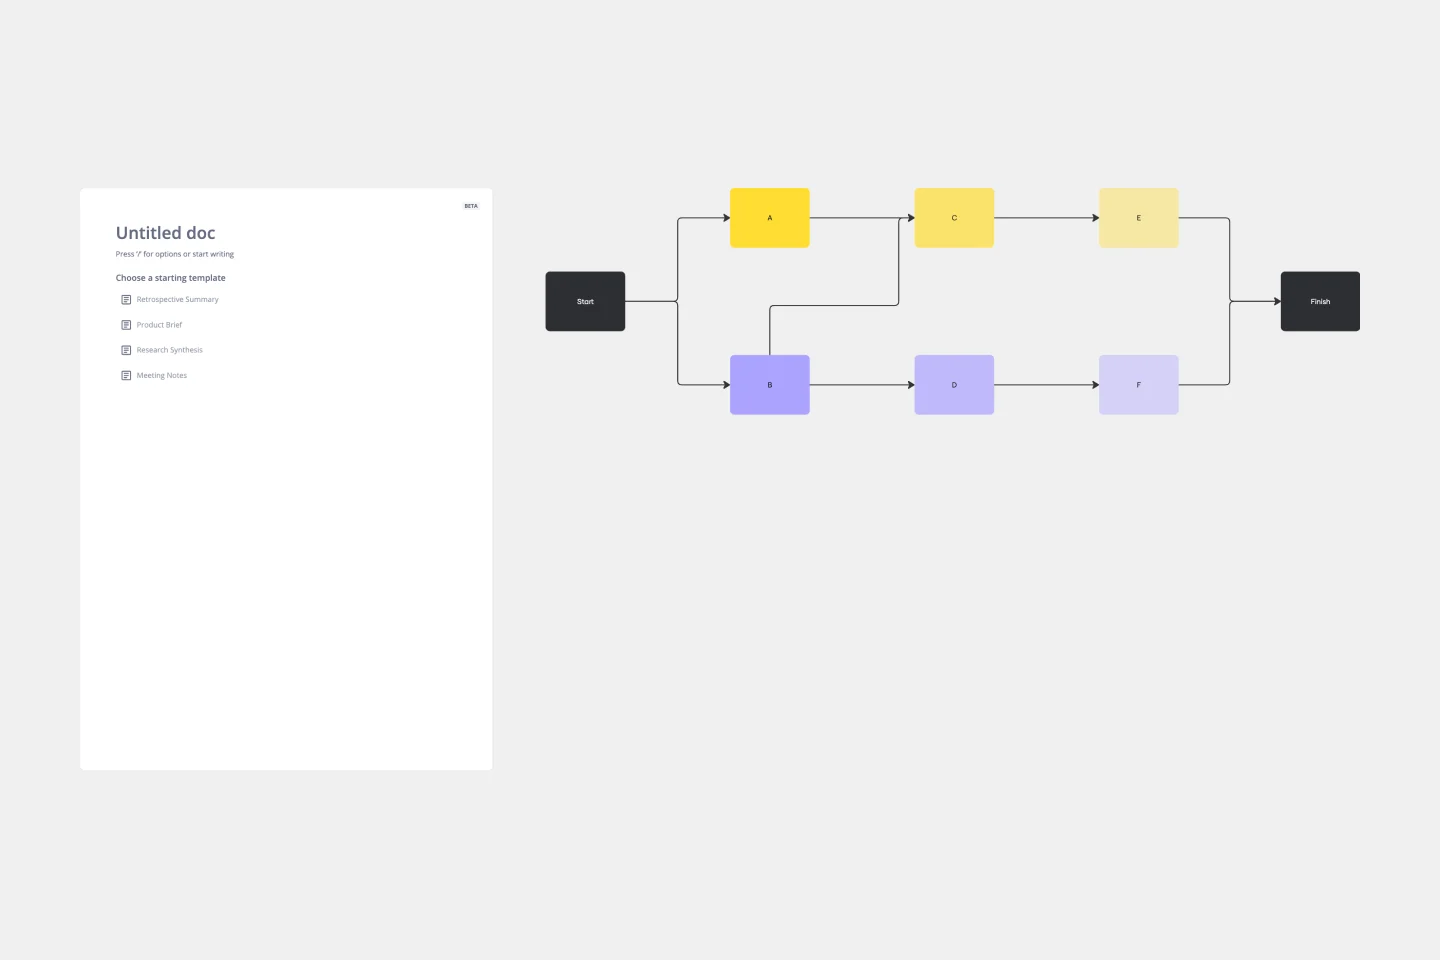
Precedence Diagram
Works best for:
Diagramming, Mapping
The Precedence Diagram Template offers a visual tool that maps out project activities and their interrelated sequences. This diagram empowers teams to recognize and anticipate workflow structures by illustrating the connections and dependencies among tasks.
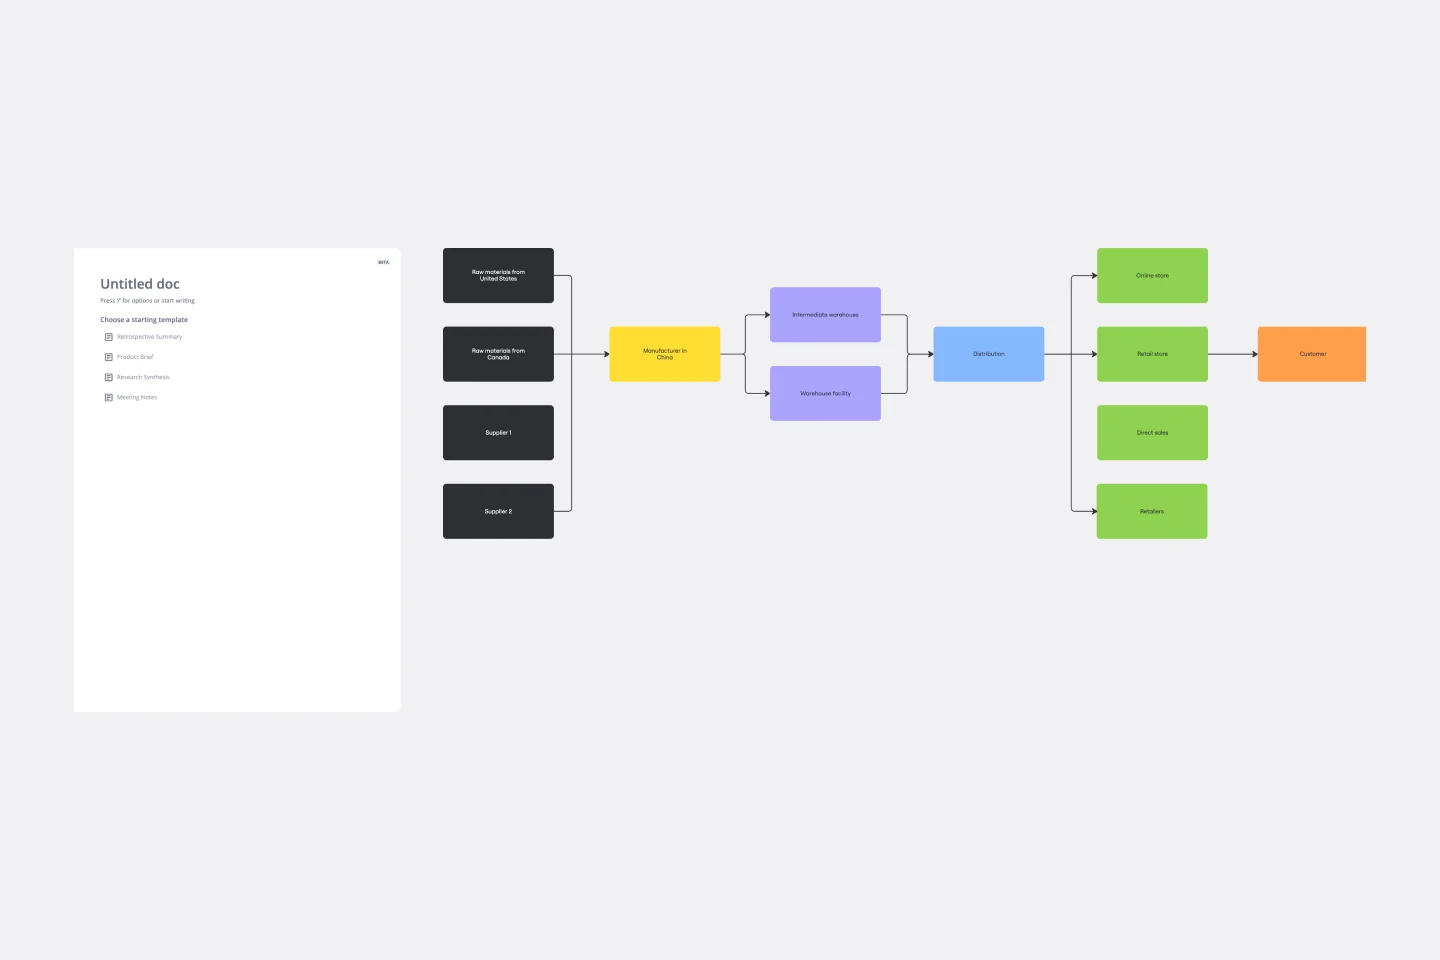
Supply Chain Diagram Template
Works best for:
Diagramming
The Supply Chain Diagram Template is great for businesses to streamline and enhance their supply chain processes. This template lets you visualize the entire supply chain, from sourcing raw materials to delivering finished products. Its intuitive layout simplifies complex networks, making identifying key areas and potential bottlenecks easier. One of the standout benefits of using this template is its clarity. It bridges the gap between complex processes and strategic decision-making by presenting a clear, visual supply chain representation. This clarity enables teams to pinpoint inefficiencies and implement more effective management strategies, which optimizes operations and facilitates better communication and understanding across different departments within an organization.
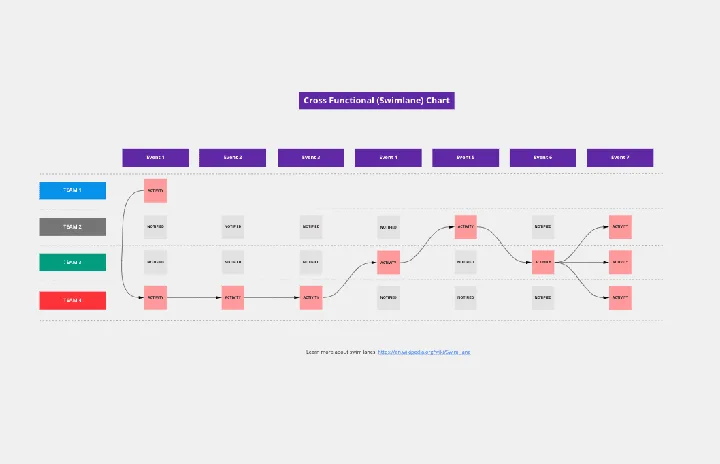
Cross Functional (Swimlane) Chart
Works best for:
Flowcharts, Mapping, Diagrams
The Cross Functional (Swimlane) Chart template offers a visual tool for mapping out processes or workflows with multiple stakeholders or functional areas. It provides swimlanes for organizing tasks and responsibilities by department or role. This template enables teams to visualize process flows, identify handoffs, and improve coordination and collaboration across functions. By promoting transparency and accountability, the Cross Functional (Swimlane) Chart empowers organizations to streamline workflows and drive cross-functional alignment effectively.
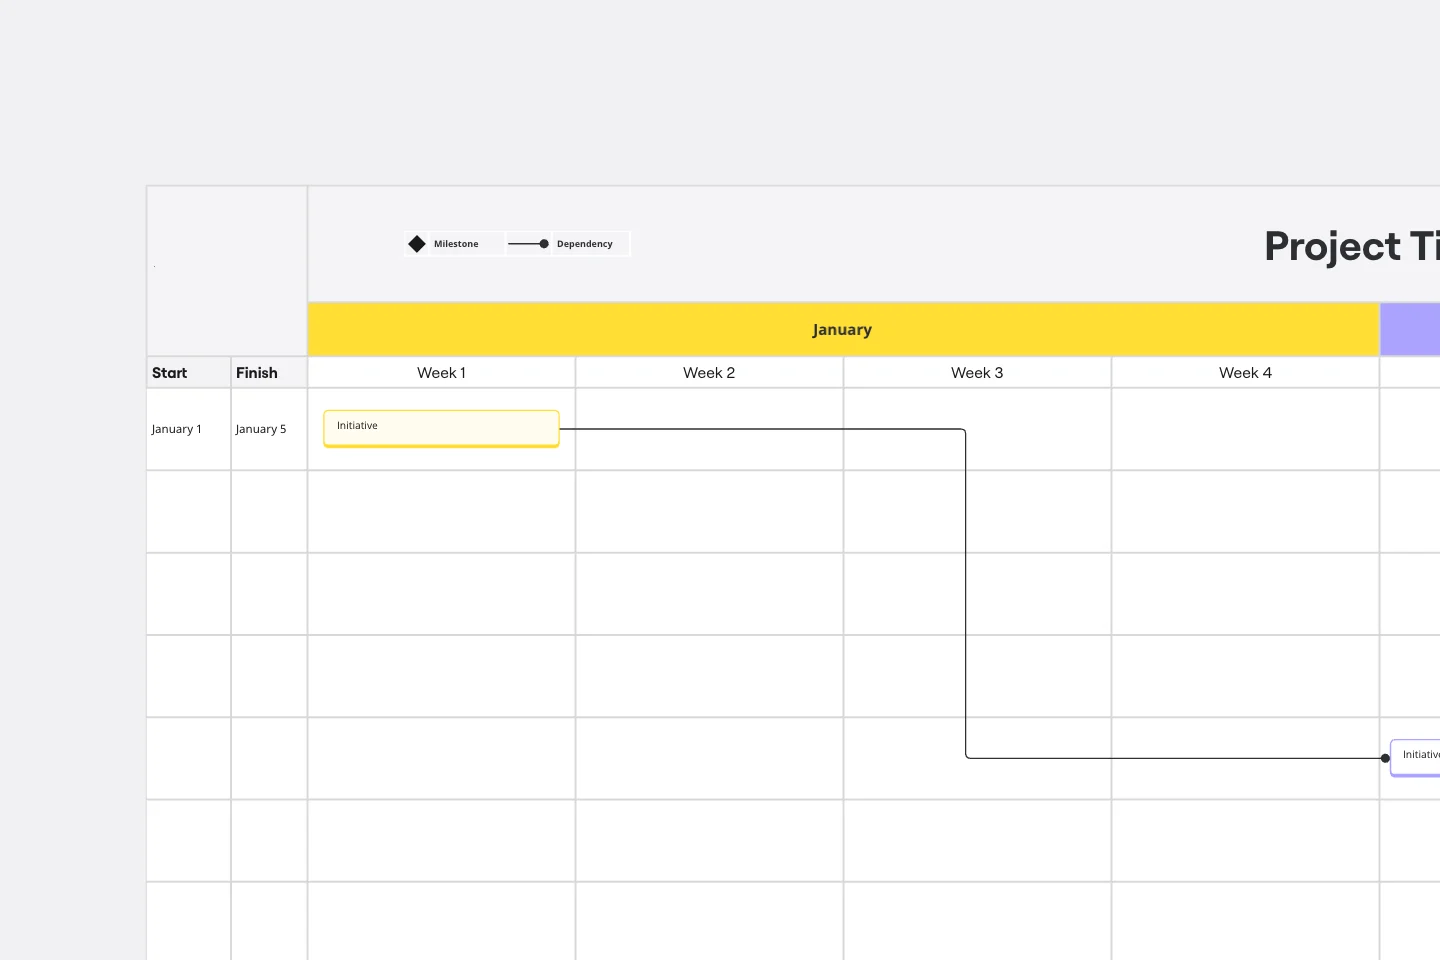
Gantt Chart Template
Works best for:
Project Management, Mapping, Roadmaps
Simplicity, clarity, and power — that’s what make Gantt charts such a popular choice for organizing and displaying a project plan. Built upon a horizontal bar that represents the project progress over time, these charts break down projects by task, allowing the whole team to see the task status, who it’s assigned to, and how long it will take to complete. Gantt charts are also easily shareable among team members and stakeholders, making them great tools for collaboration.
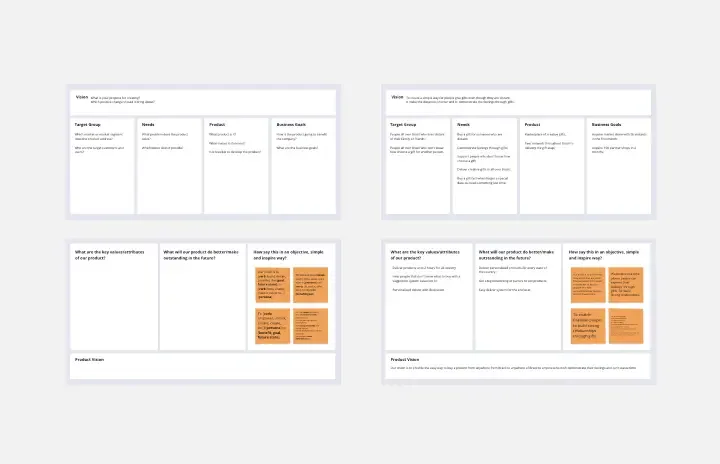
Product Vision
Works best for:
Product Management, Planning
The Product Vision template helps articulate a clear and compelling vision for product development. By defining goals, target markets, and success metrics, this template aligns teams around a shared vision. With sections for outlining product features, benefits, and competitive advantages, it communicates the value proposition effectively. This template serves as a guiding light for product teams, inspiring creativity and focus as they work towards bringing the product vision to life and achieving business objectives.
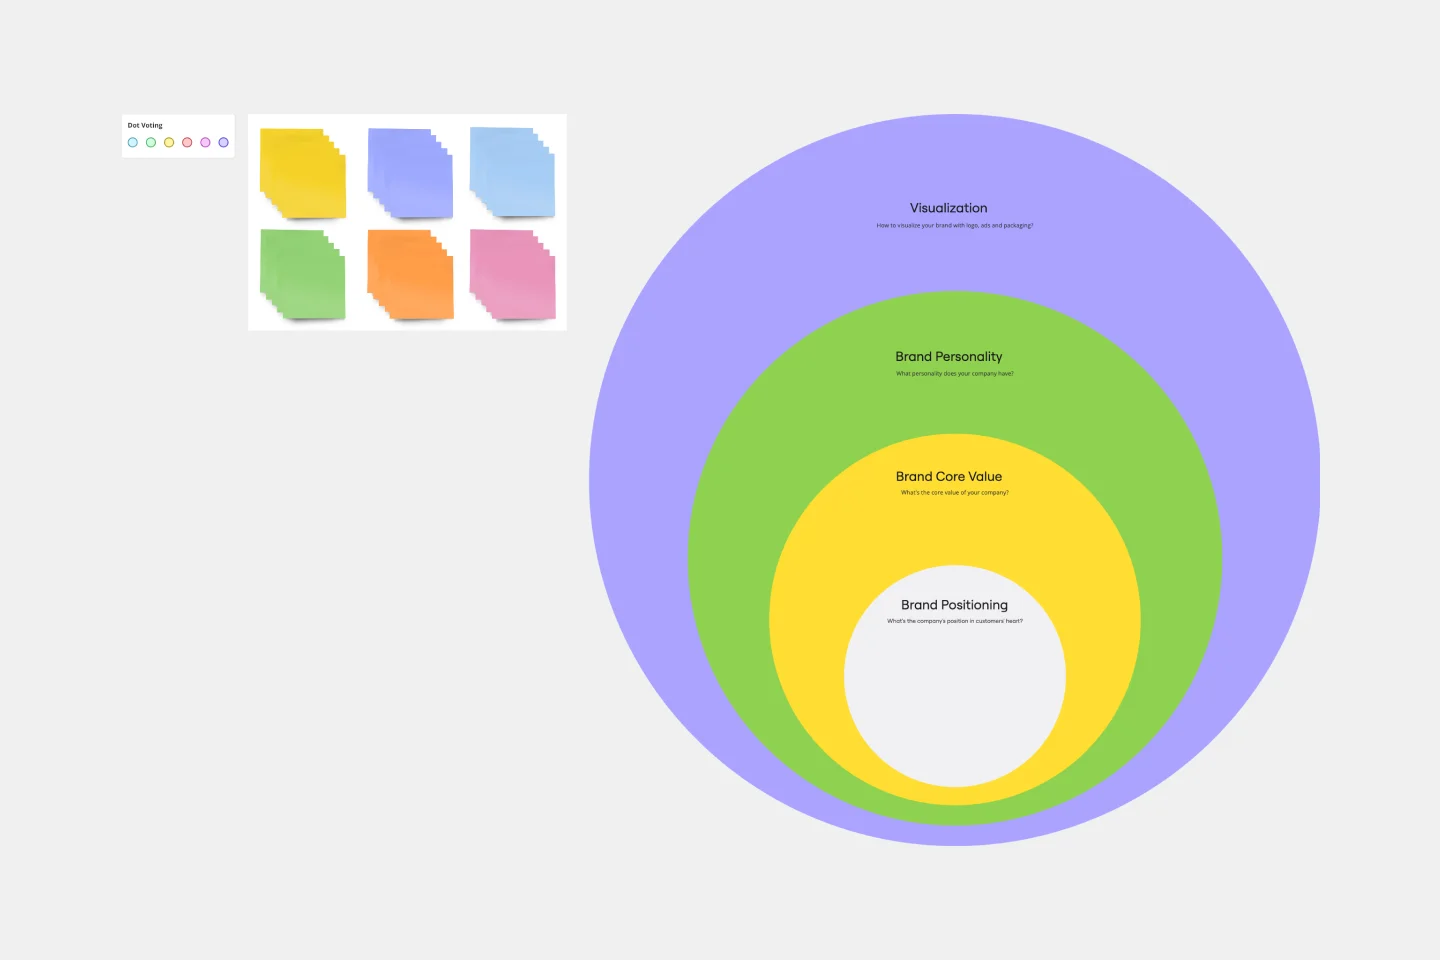
Onion Diagram Template
Works best for:
Diagramming, Mapping and Diagramming
The Onion Diagram Template is a distinct tool designed to visually represent layers of a specific concept, system, or process, akin to the layers of an onion. Each concentric layer of the diagram provides insights into a different aspect or phase of the topic at hand, moving from the core foundational element outwards to more peripheral components. One of the prime benefits of this template is its ability to offer hierarchical clarity. Users can immediately discern the importance, sequence, or interrelation of different elements within a system, facilitating enhanced comprehension and efficient decision-making.