Cloud Blueprint
Make the journey to cloud more than just a copy and paste, and instead take the opportunity for a transformation.
Build a blueprint
How to make your cloud migration a transformation
Make the journey to cloud more than just a copy and paste, and instead take the opportunity for a transformation.
Why create a blueprint?
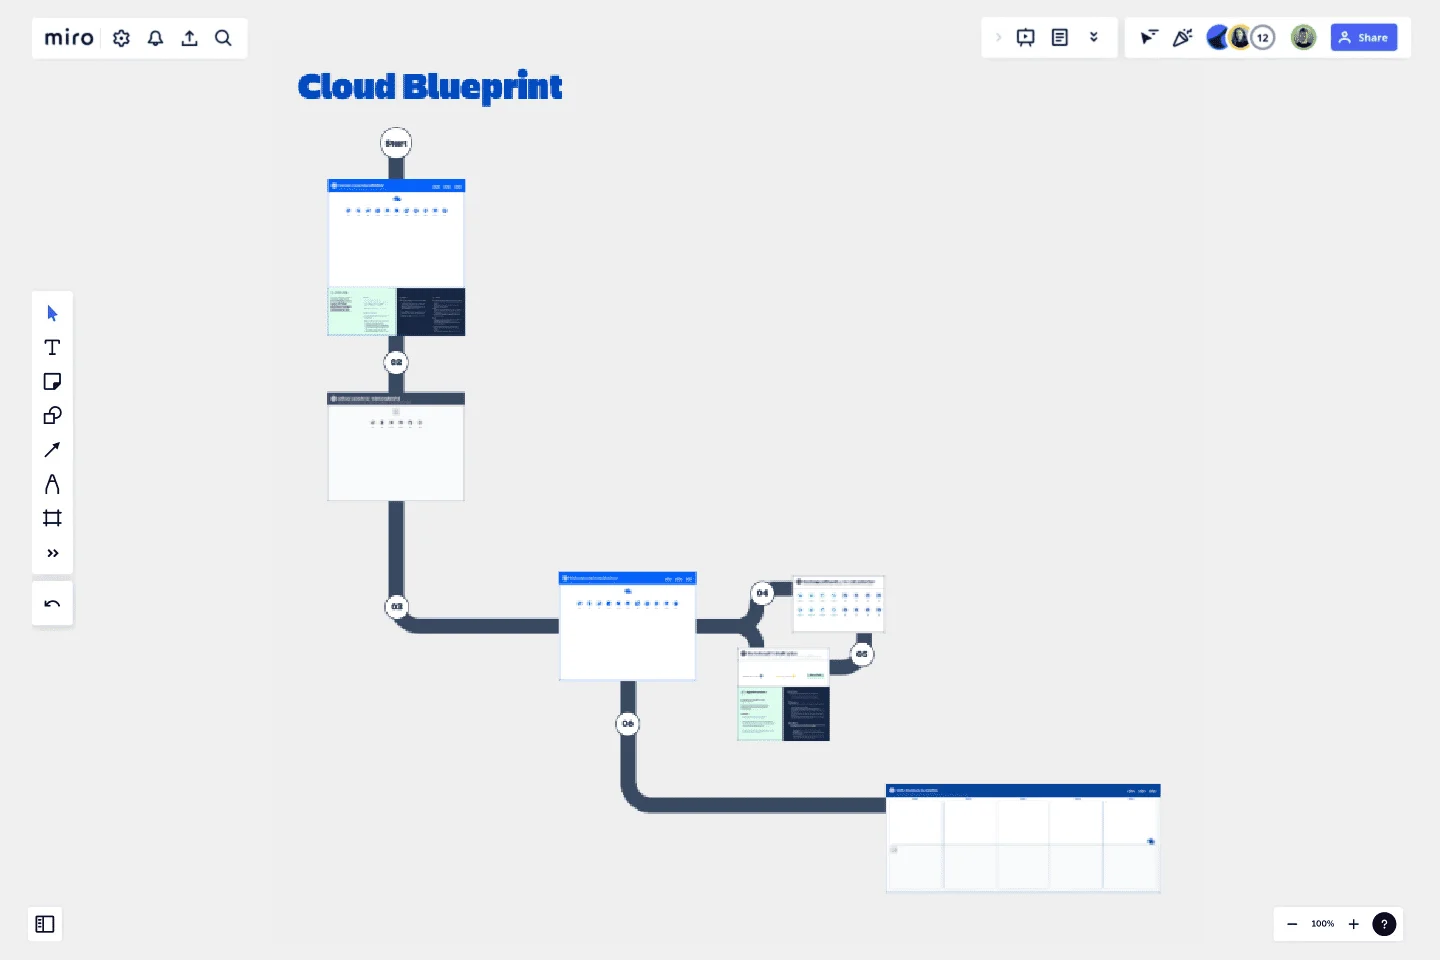
A blueprint helps you explain where you've come from and where you are going into the future with Atlassian Cloud. Most importantly, it helps you find your narrative on why and how to make the move. Done early in your Cloud migration planning, this can help you confidently decide exactly what will migrate, from where to where, who and when.
It is especially useful if you feel that your current setup is not optimised and need to investigate the value unlocked by transformation.
Who to invite to run the workshop?
It's import to run this with a well rounded crew of stakeholders, such as system administrators, project leads, end users and business strategy and operations experts who can contribute to designing your future state in cloud. You want to assemble a team that will embrace the pros and cons of different cloud architectures, so that you arrive at the right design.
At the end of this workshop you’ll produce what is known in the industry as a tenant map, which visualises your migration paths.
How to use the blueprint?
Key steps:
Determine your dream state in Cloud - How will you organise your teams in Cloud that best supports your future way of working?
Audit what you have on Server - How are your teams organised today on Server?
Bring your present and future state ideas onto the one map
Don’t forget apps and integrations attached to your core data and how they will move
Map where you data will more from and to, and at what rate of change (all at once, by cohort or by start fresh).
Convert your tenant map into a Project timeline
Detailed instructions are provided on the Mire board itself when you use this template. Also, check out the demo video below!
Presto - you’ve got a strategic plan for your move to Cloud!
Designing the right tenant map may take multiple rounds and is best done iteratively, in consultation with the wider business. Plan for a series of 1-2hr workshops.
Get started with this template right now.
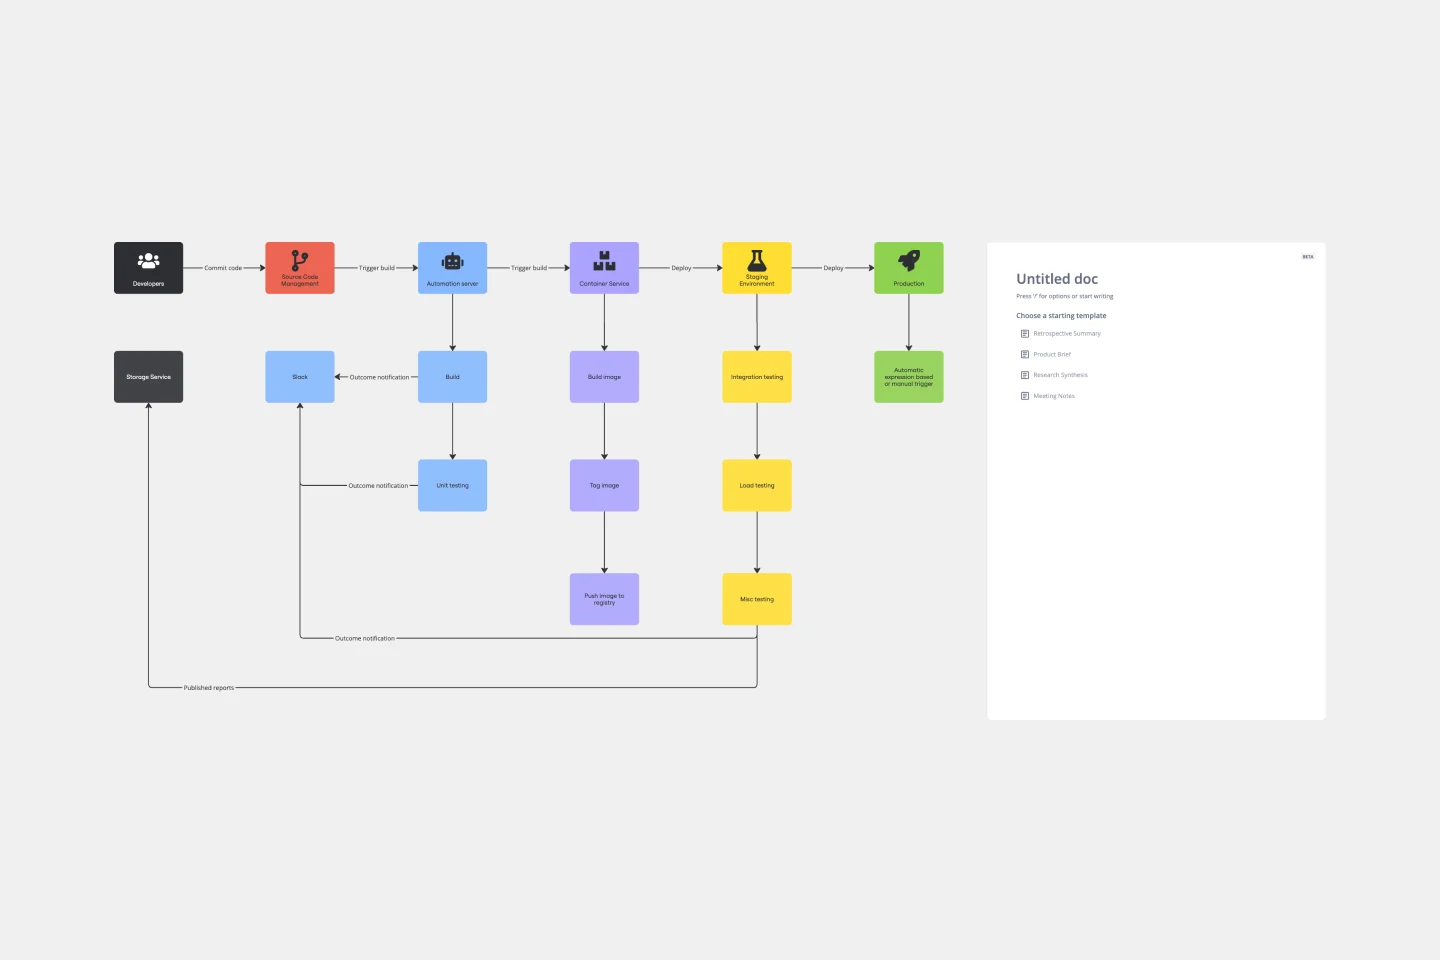
CI/CD Pipeline Diagram Template
Works best for:
Diagramming, Development
The CI/CD template is a well-designed roadmap for software deployment that enables a smooth and automated flow from development to production. This strategic layout includes critical elements such as source code management, automation servers, container orchestration, staging environments, and the final deployment to production. One of the key benefits of using such a template is that it builds a robust deployment pipeline, which significantly reduces manual intervention and human error. By visualizing each step and integrating automation throughout, teams can achieve faster deployment cycles, ensuring that new features, updates, and fixes are delivered to users promptly and reliably. This enhanced pace does not compromise quality, as the template inherently supports continuous testing and quality assurance, ensuring that each update is quick but also secure and stable before it is delivered to the end user.
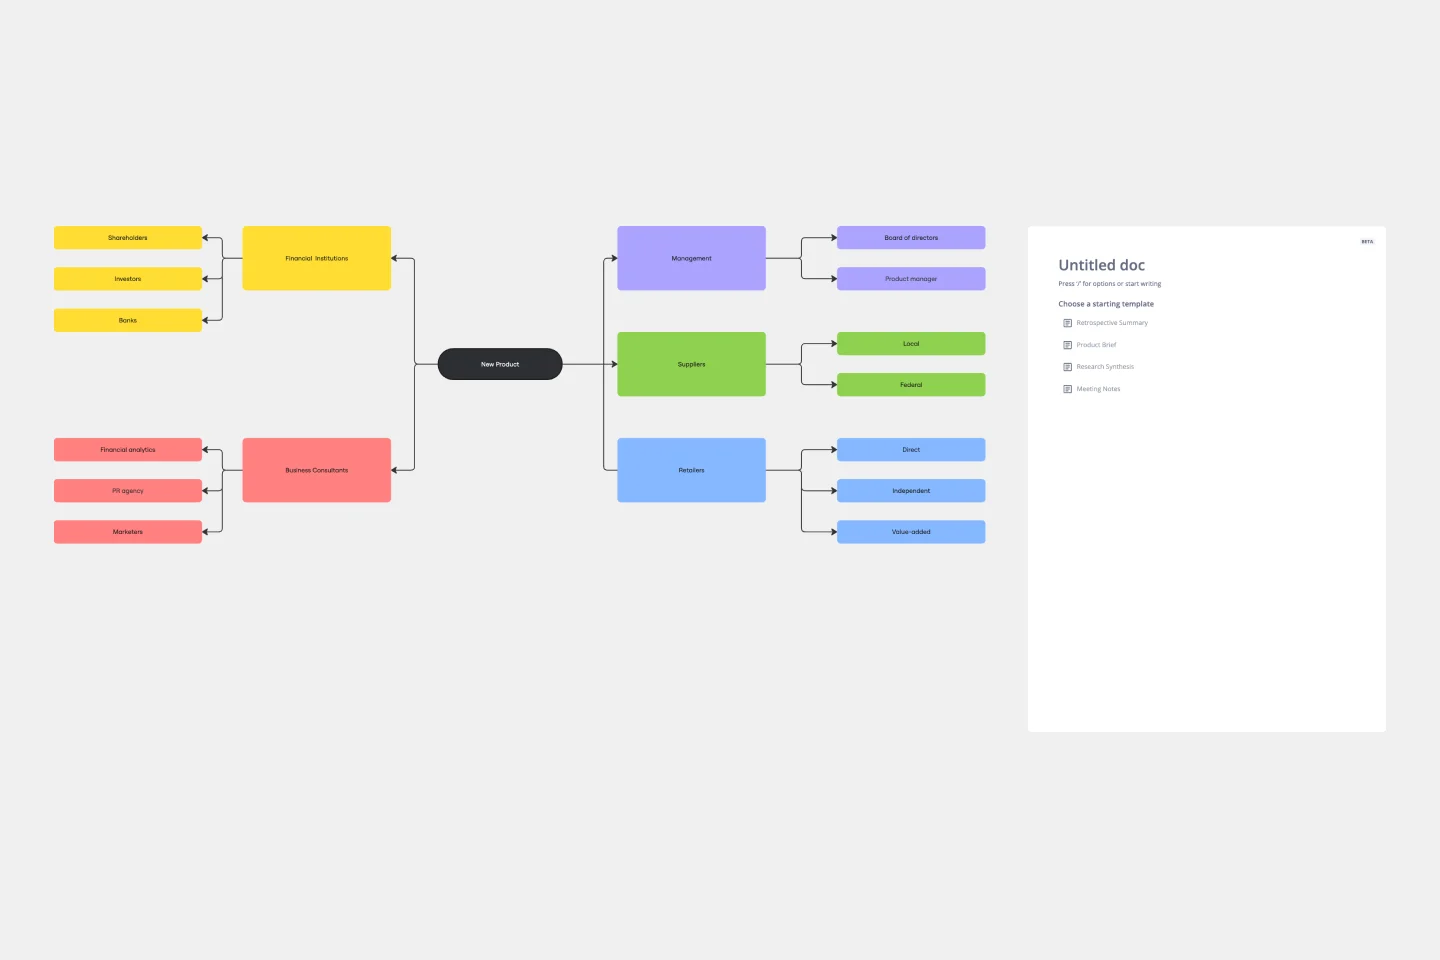
Stakeholder Mapping Template
Works best for:
Business Management, Mapping, Workflows
A stakeholder map is a type of analysis that allows you to group people by their power and interest. Use this template to organize all of the people who have an interest in your product, project, or idea in a single visual space. This allows you to easily see who can influence your project, and how each person is related to the other. Widely used in project management, stakeholder mapping is typically performed at the beginning of a project. Doing stakeholder mapping early on will help prevent miscommunication, ensure all groups are aligned on the objectives and set expectations about outcomes and results.
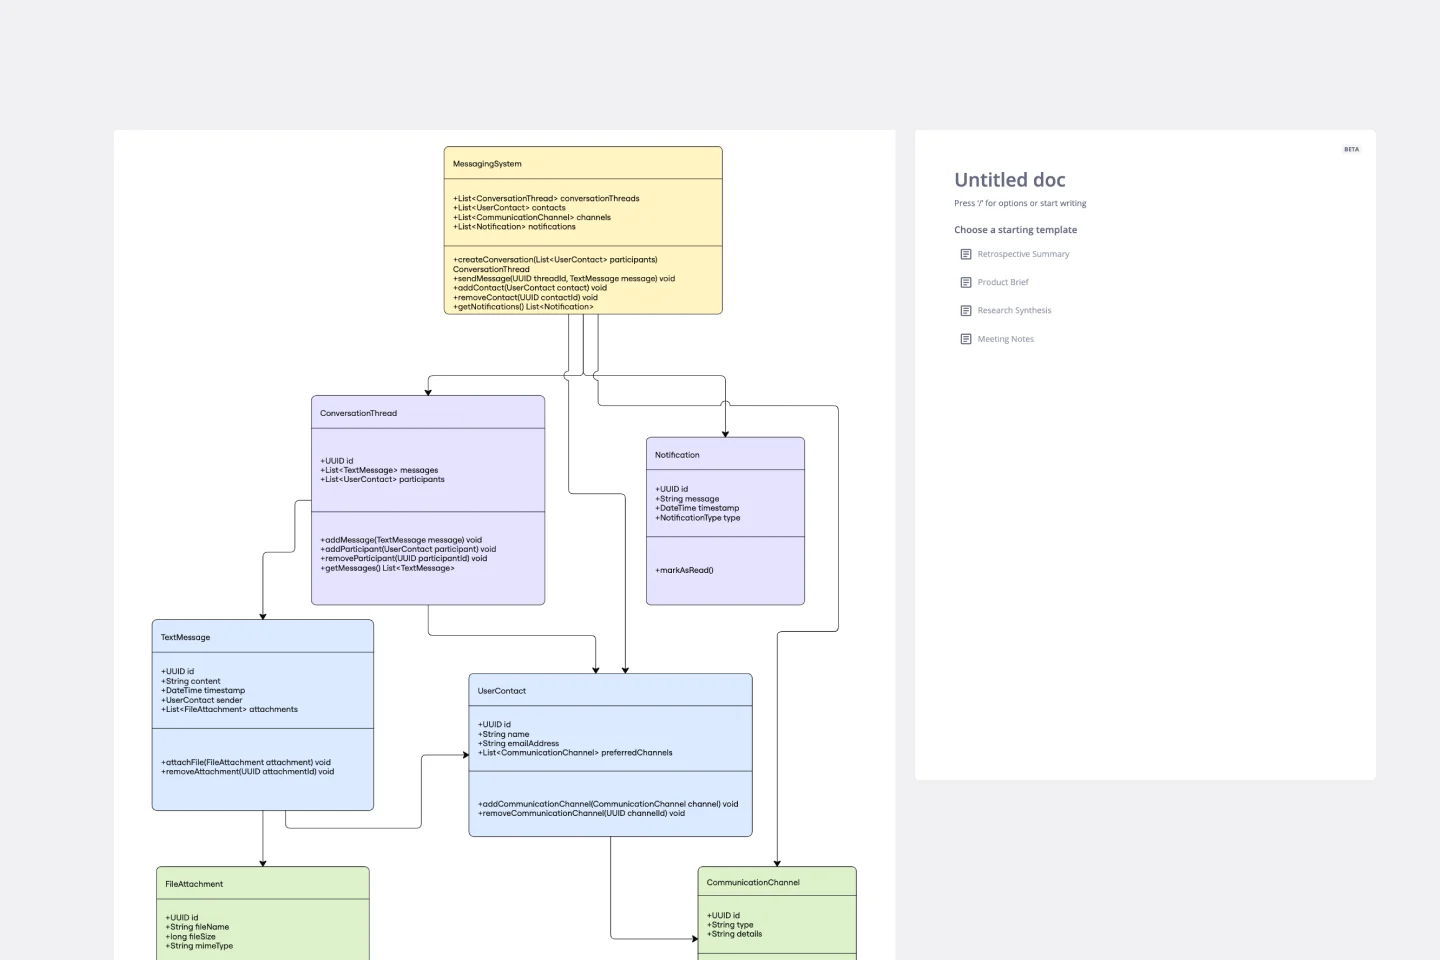
UML Class Messaging System Template
Works best for:
UML
The UML Class Messaging System Template streamlines the process of designing and analyzing messaging systems. It allows users to visually map out the structure of a system by detailing classes, their attributes, operations, and the relationships among objects. This template is particularly useful for illustrating the functionality of a messaging system, including the management of text messages, conversation threads, user contacts, notifications, and channels. It offers a clear visual representation of how all these elements interact within the system, making it an invaluable resource for developers, designers, and stakeholders aiming to enhance communication and reduce errors in the development phase.
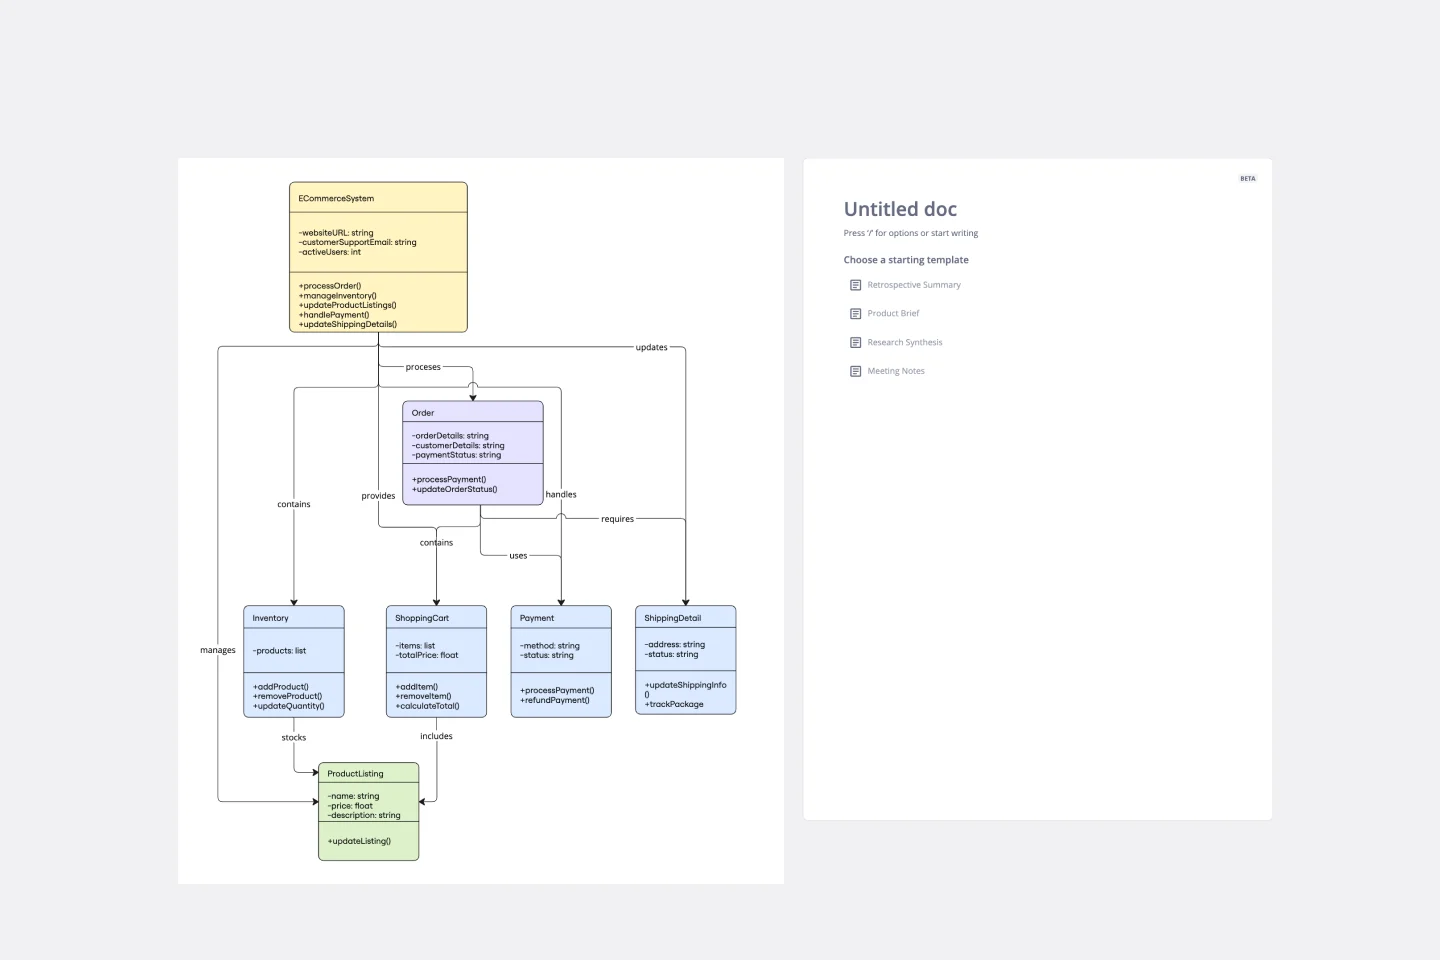
UML Class E-Commerce System Template
Works best for:
UML
The UML Class E-Commerce System Template streamlines the process of creating and visualizing the class structure of an e-commerce system. It provides a comprehensive framework that includes typical online shop features such as product listings, inventory management, shopping carts, orders, payments, and shipping details. This template facilitates a clear understanding of how these elements interact during an online sales transaction, making it an invaluable tool for teams working on e-commerce projects. By using this template, teams can save time, enhance collaboration, and ensure that their system architecture is robust and efficient, ready to adapt to their business's evolving needs.
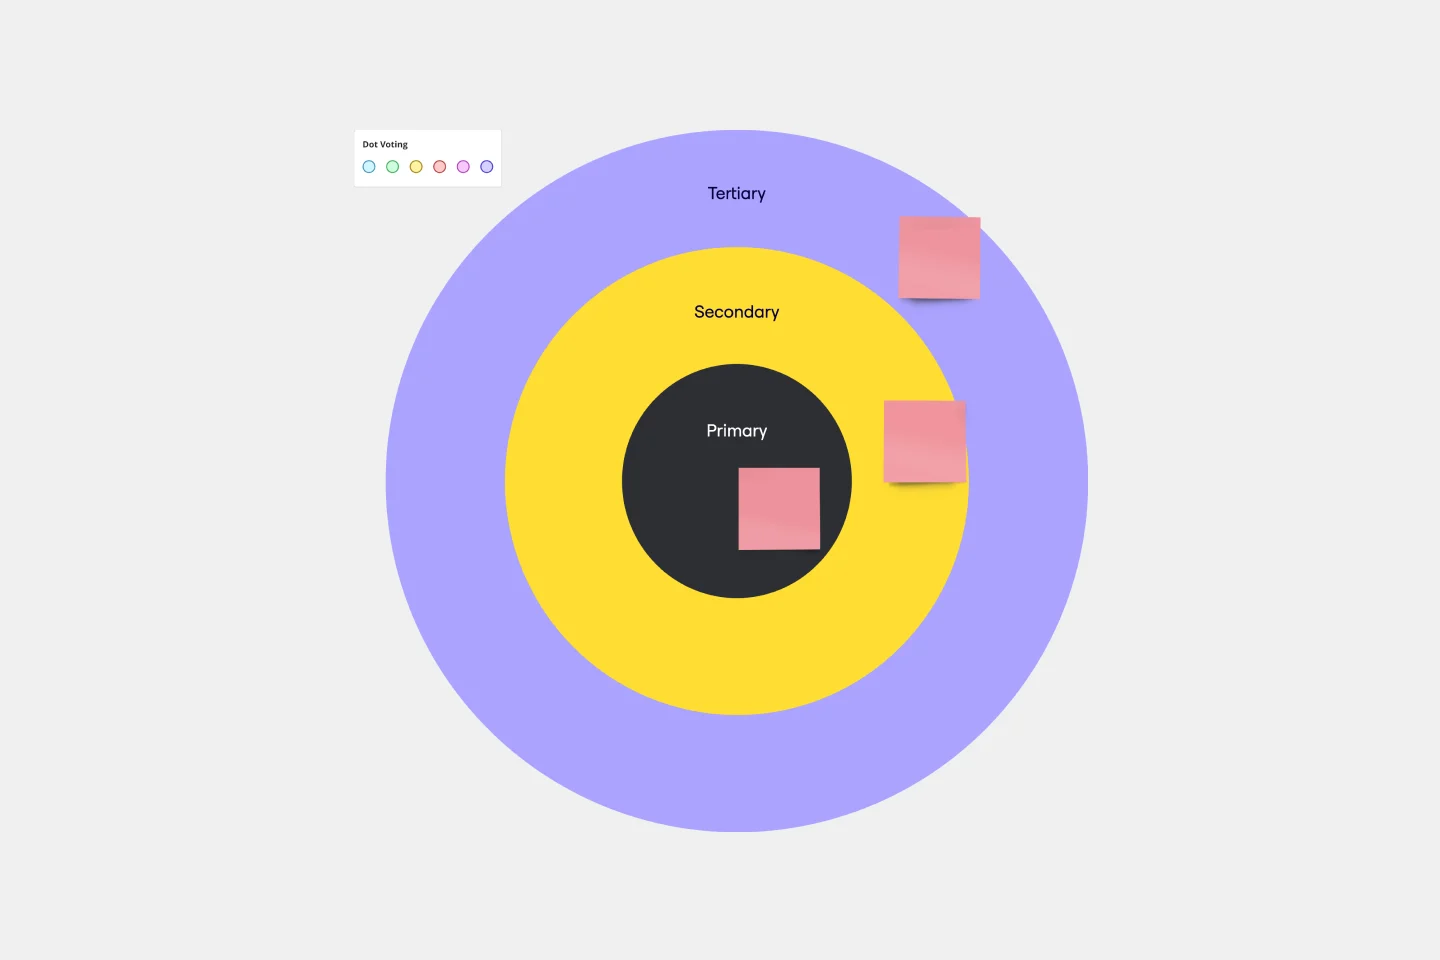
Bull's Eye Diagram Template
Works best for:
Diagrams, Project Management, Prioritization
When you’re a growing organization, every decision can feel like it has make-or-break consequences—which can lead to decision paralysis, an inability to prioritize, inefficient meetings, and even low morale. If that sounds like you, put a Bull’s Eye Diagram to work. True to its name, a Bull’s Eye Diagram uses a model of concentric circles to help companies establish priorities, make critical decisions, or discuss how to remove or overcome obstacles.
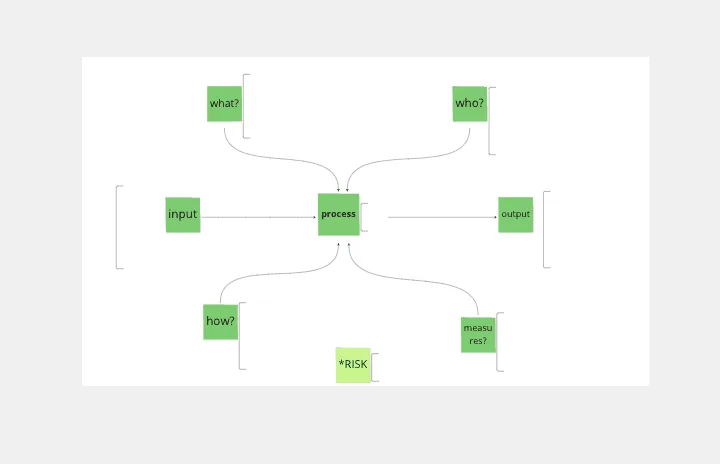
Turtle Diagram for BA
Works best for:
Diagramming
The Turtle Diagram for BA template offers a visual framework for defining and auditing business processes according to ISO 9001 standards. It provides elements for documenting process inputs, outputs, activities, and controls. This template enables organizations to ensure compliance, identify process improvements, and enhance quality management practices. By promoting systematic process documentation and auditability, the Turtle Diagram for BA empowers organizations to achieve and maintain ISO 9001 certification, demonstrating commitment to quality and continuous improvement.