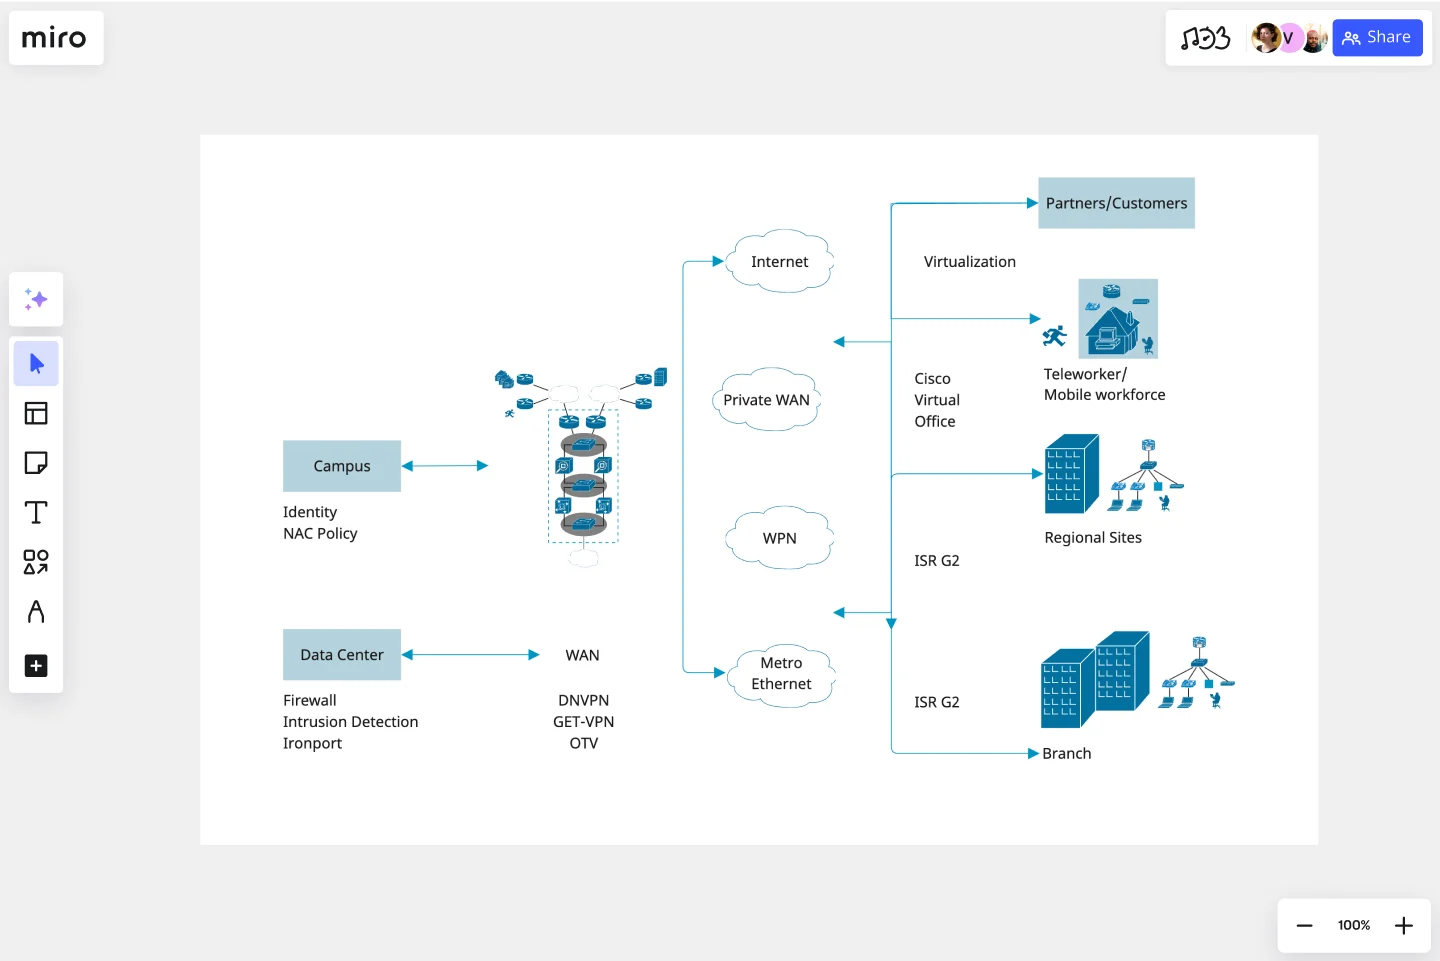
Cisco Recommended Security Architecture Template
Map out and present your organization’s network structure.
Available on Enterprise, Business, Education plans.
About the Cisco Data Network Diagram Template
Cisco offers data center and access networking solutions built for scale with industry-leading automation, programmability, and real-time visibility. The Cisco Data Network Diagram template can help you design and showcase the organization’s network infrastructure.
Keep reading to learn more about the Cisco Data Network Diagram Template.
What is the Cisco Data Network Diagram Template
The Cisco Data Network Diagram Template, like any other diagram, visually shows the design of the network infrastructure. The Cisco Data Network Diagram has unique icons and symbols.
When to use Cisco Data Network Diagram Template
You can use the Cisco Data Network Diagram Template to visualize the telecommunication and computer network topology and layout.
Here are the the semantics of Cisco Data Network Diagrams:
Shapes: Icons represent a Cisco service or product.
Connectors: Use arrows to indicate flows (e.g. data, information, communication). Use a single-headed arrow to indicate a single initiator. Use a double-headed arrow to indicate that the icon shown at either end of the arrow can initiate a flow.
Layout and Grouping: Groups show the connection between multiple services/products and can represent layers of the architecture
Miro's diagramming tool also makes it easy to create your network diagram online — with many shape packs, over 2000 icons to diagram from scratch with, and the ability to create in Diagramming Mode for a more focused diagramming experience. This makes Miro the perfect Cisco network diagram tool to suit your needs.
How do I make a Cisco Data Network Diagram Template?
To make a Cisco Data Network Diagram in Miro is easy. You can use our Cisco Data Network Diagram Template and customize it as you see fit. Once you have the diagram structure, you can start adding the icons. You can find the icons under our Cisco Icon Set integration.
Get started with this template right now. Available on Enterprise, Business, Education plans.
Cisco Data Network Diagram Template
Works best for:
Software Development
Cisco offers data center and access networking solutions built for scale with industry-leading automation, programmability, and real-time visibility. The Cisco Data Network Diagram uses Cisco elements to show the network design of Cisco Data Networks visually.
Cisco Network Diagram Template
Works best for:
Software Development, Diagrams
Cisco offers data center and access networking solutions built for scale with industry-leading automation, programmability, and real-time visibility. The Cisco Data Network Diagram uses Cisco elements to show the network design of Cisco Data Networks visually.
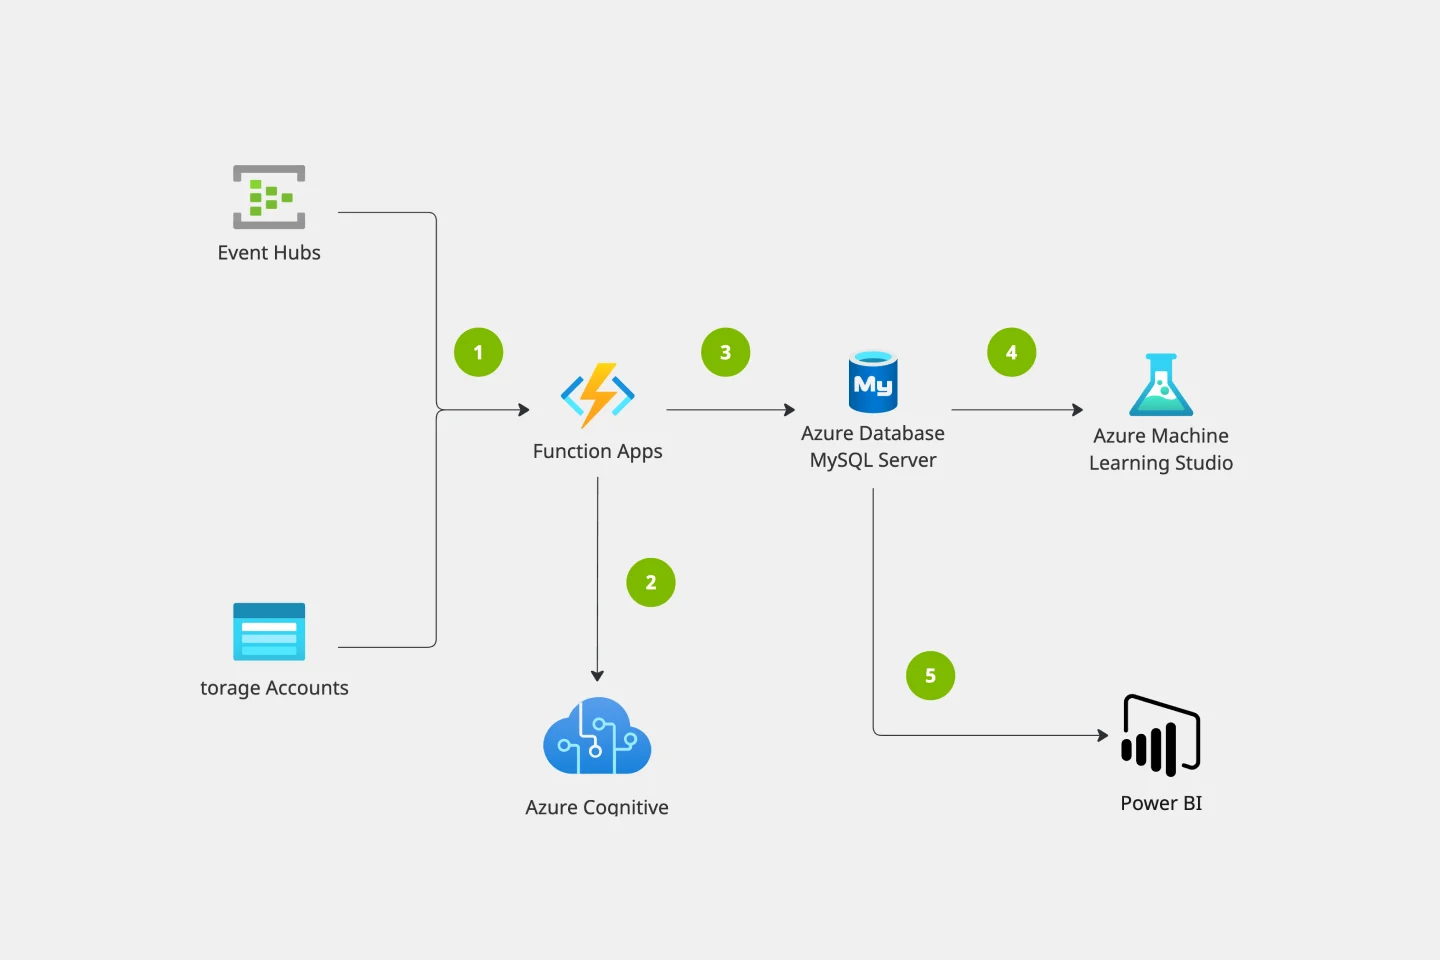
Azure Architecture Diagram Template
Works best for:
Software Development, Diagrams
The Azure Architecture Diagram Template is a diagram that will help you visualize the combination of any data and build and deploy custom machine learning models at scale. Azure is Microsoft’s cloud computing platform, designed to provide cloud-based services such as remote storage, database hosting, and centralized account management. Use Azure Architecture Diagram template to build sophisticated, transformational apps.