Challenge - UML Iphone
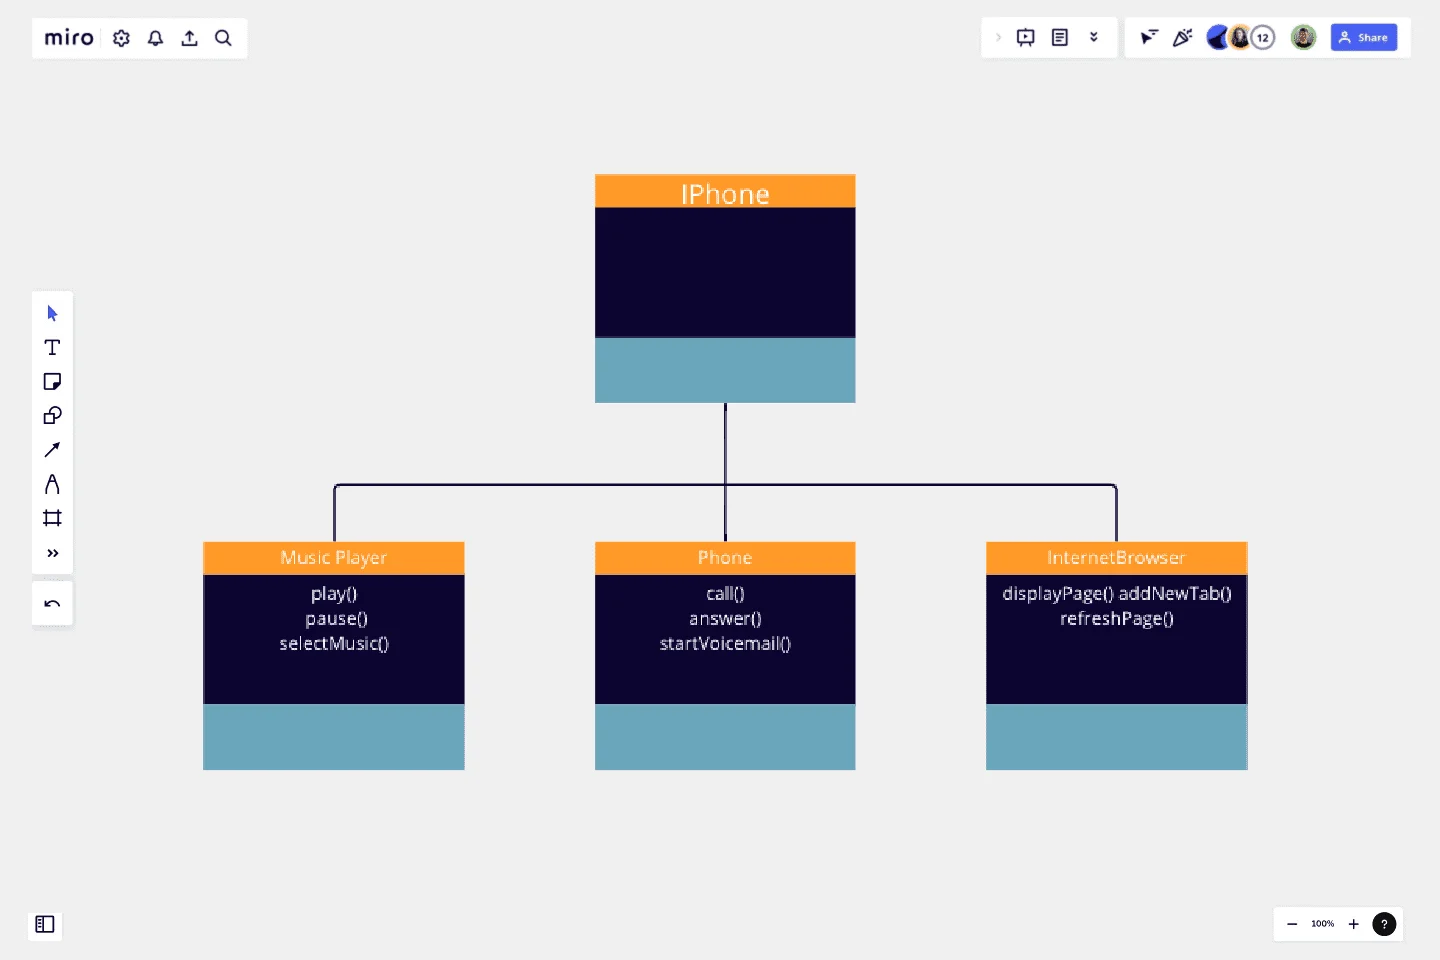
Ce diagramme UML et le code Java correspondant représentent un iPhone doté de trois fonctionnalités principales : un lecteur de musique, un téléphone et un navigateur Internet.
This UML diagram and corresponding Java code represent an iPhone with three main functionalities: a Music Player, a Phone, and an Internet Browser.
The UML diagram consists of three classes, each representing a distinct role of the iPhone. The MusicPlayer class has methods to play, pause, and select music. The Phone class has methods to make a call, answer a call, and start voicemail. The InternetBrowser class has methods to display a webpage, add a new tab, and refresh the page.
The Java code further elaborates on these roles by defining three interfaces: MusicPlayer, Phone, and InternetBrowser. Each interface declares the methods that correspond to the actions each role can perform.
The IPhone class implements all three interfaces, indicating that an iPhone can perform all the actions defined in these interfaces. The actual implementation of these methods is left blank, as it would depend on the specific behavior you want to achieve.
This representation is a simple yet effective way to model the diverse functionalities of an iPhone using object-oriented programming principles. It provides a clear and organized structure for understanding and implementing the various roles an iPhone can play.
Get started with this template right now.
Phylogenetic Tree Template
Works best for:
Diagramming
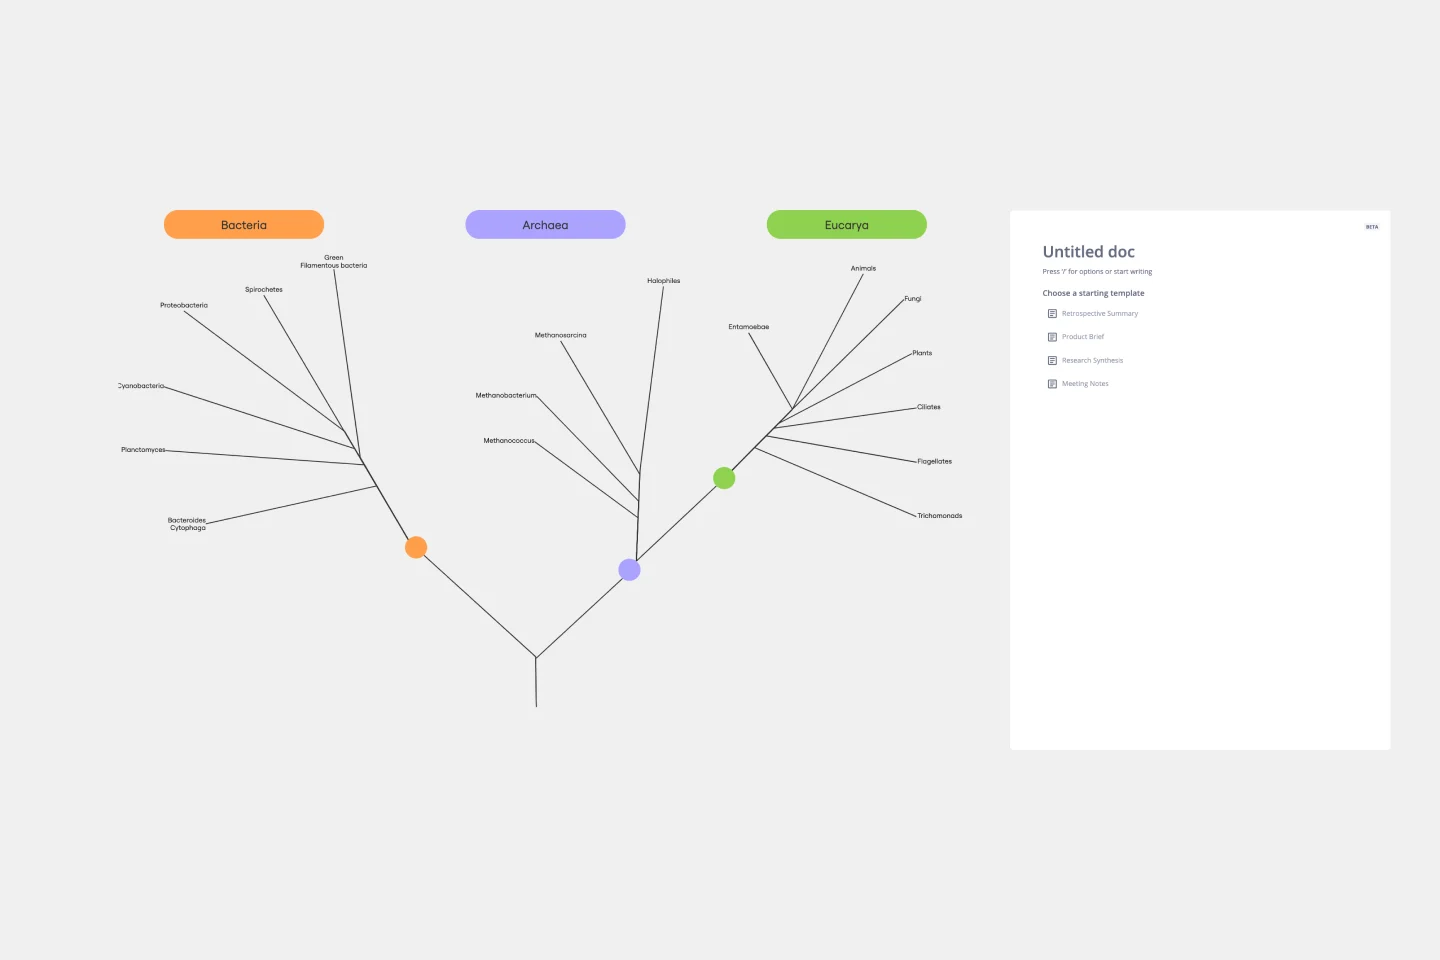
The Phylogenetic Tree Template is a powerful tool that allows scientists and researchers to visualize evolutionary relationships between species. It is a visual representation of the history of the evolution of life on Earth and helps users identify the relationships between other organisms and their ancestors. The key benefit of this template is that it organizes complex data and makes it more understandable to everyone. Additionally, it offers an efficient way to collect and analyze data, saving time and effort and enabling users to identify significant patterns and relationships in the data.
Cloudflare Content-based Asset Creation Template
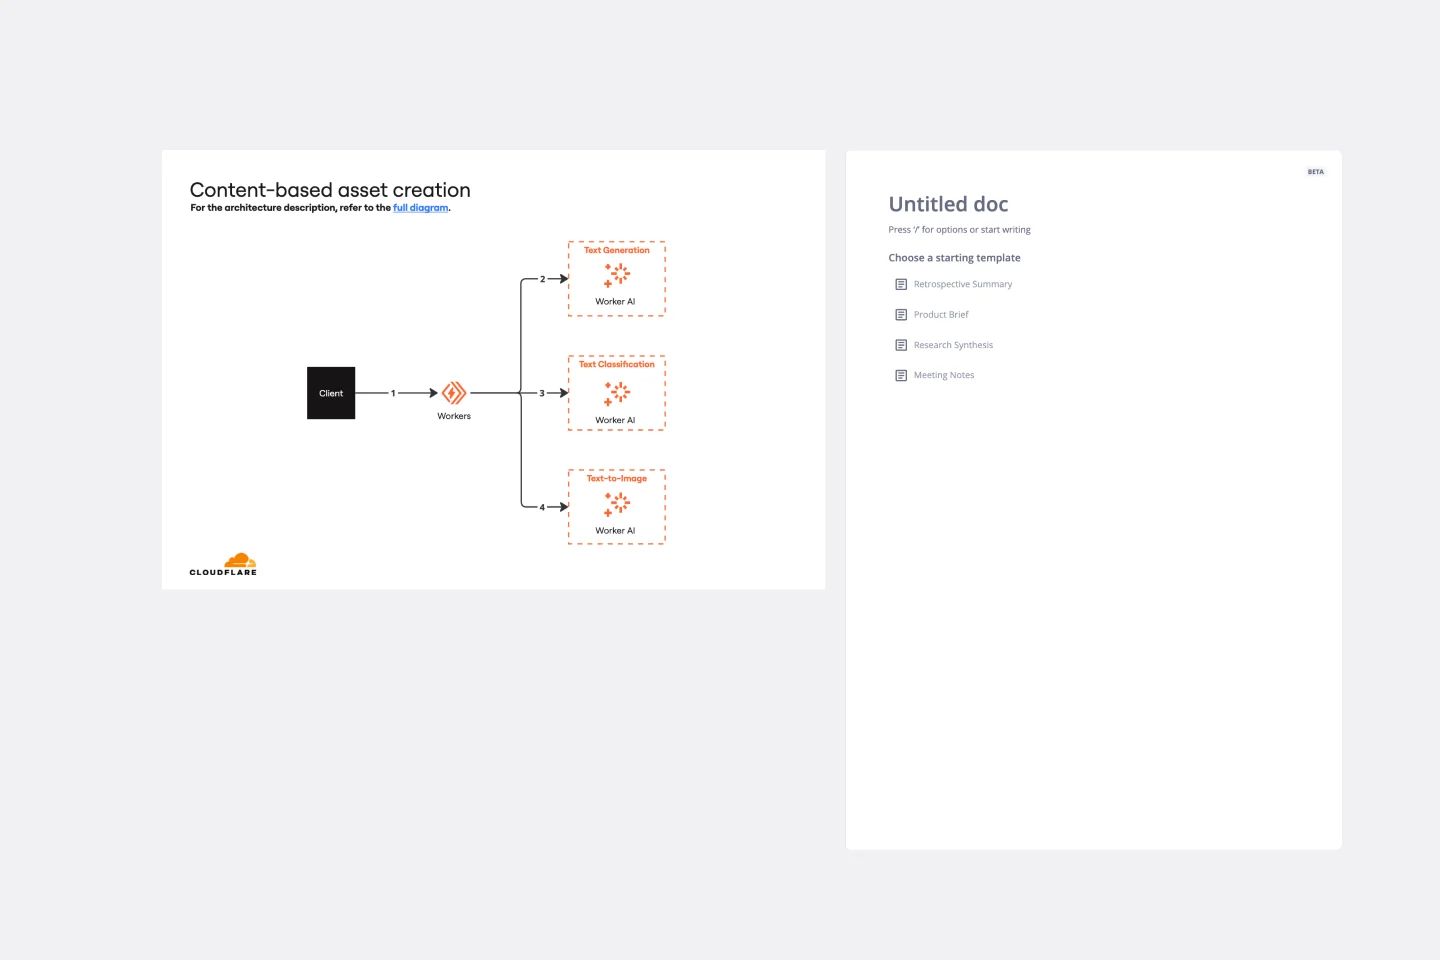
The Cloudflare Content-based Asset Creation Template enhances efficiency and collaboration within teams working on cloud infrastructure projects. This template provides a structured and intuitive framework for creating and managing digital assets, which streamlines the asset creation process.
4-Circle Venn Diagram Template
Works best for:
Diagramming, Mapping, Brainstorming
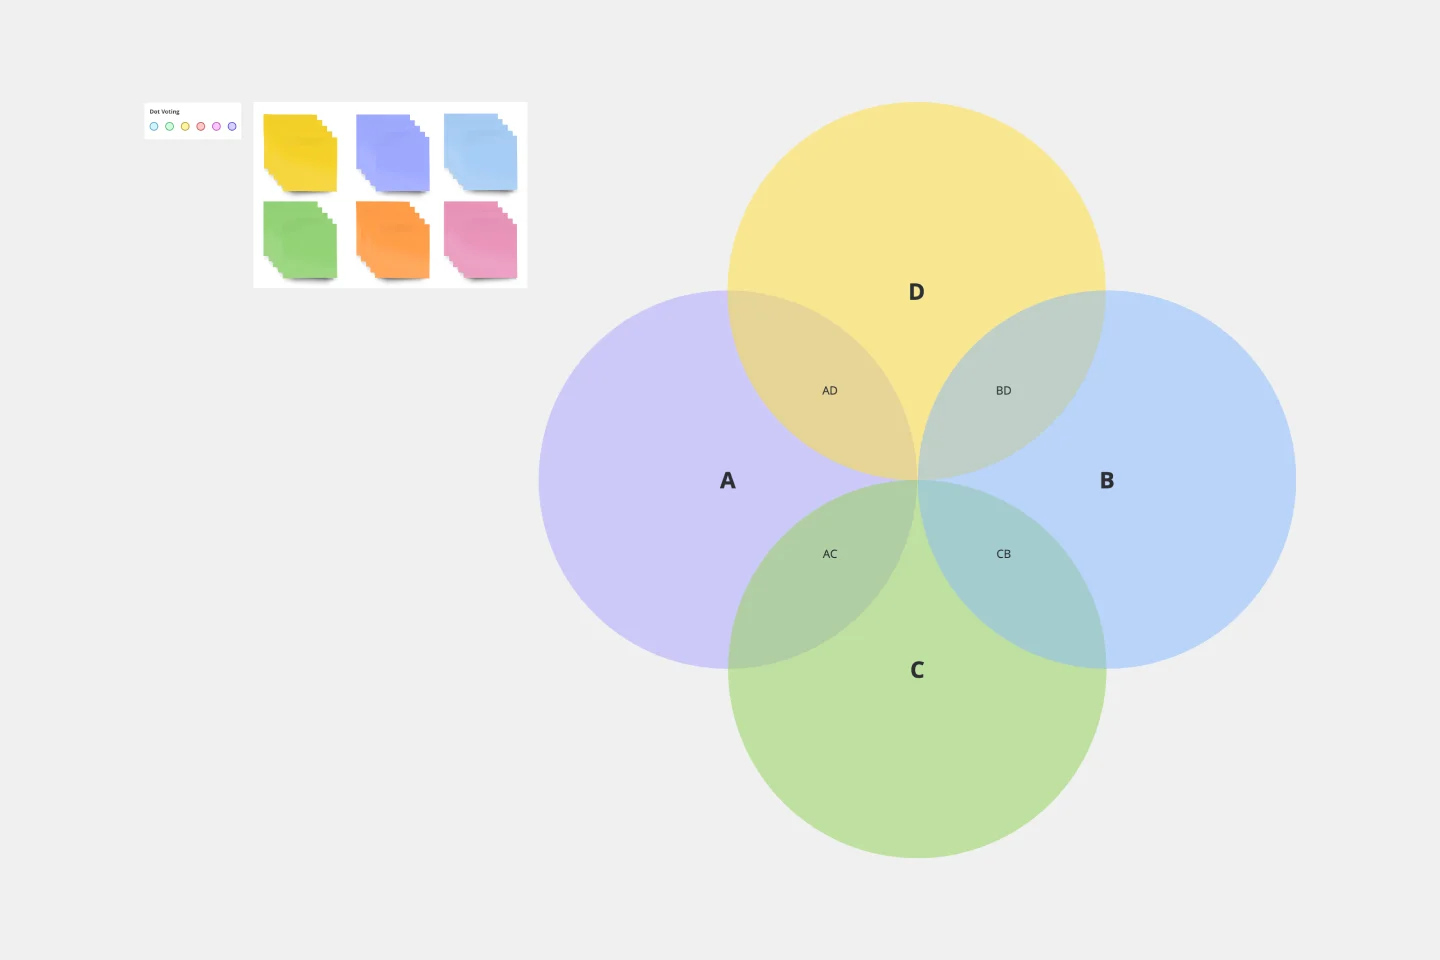
The 4-Circle Venn Diagram Template has an easy, interactive, and dynamic way to visualize complex relationships between data sets. Empower your team's collaboration and communication with this powerful tool.
Miro x AWS: Accelerate your cloud journey
Works best for:
Diagramming
The Miro x AWS: Accelerate your cloud journey template offers a visual framework for planning and executing cloud migration and optimization projects using Amazon Web Services (AWS). It provides elements for mapping out cloud architectures, migration strategies, and cost optimization initiatives. This template enables teams to collaborate effectively, align on objectives, and accelerate their cloud journey with AWS services. By promoting collaboration and alignment, the Miro x AWS template empowers organizations to leverage AWS cloud technologies efficiently and achieve their business objectives effectively.
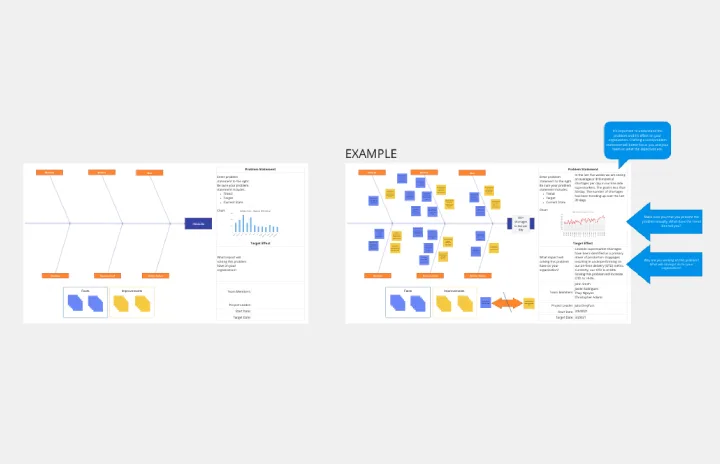
Crowd Sourced Cause and Effect
Works best for:
Fishbone Diagram, Problem solving
The Crowd Sourced Cause and Effect template leverages collective intelligence to identify root causes of problems. By involving multiple team members, you can gather diverse perspectives and uncover insights that might be overlooked. This collaborative approach ensures a comprehensive analysis and fosters team engagement.
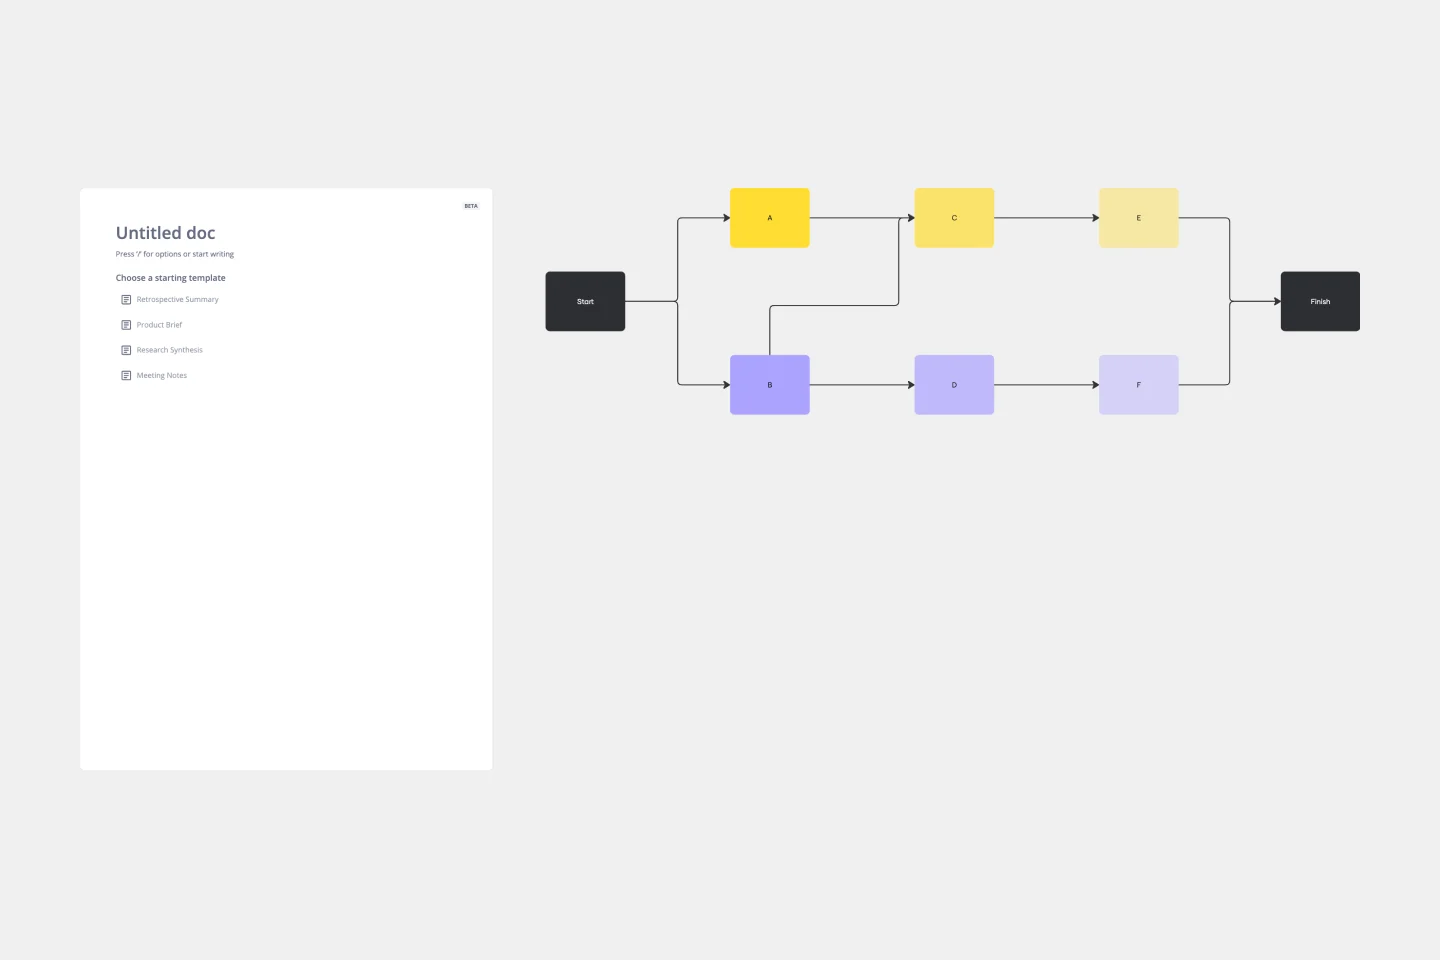
Precedence Diagram
Works best for:
Diagramming, Mapping
The Precedence Diagram Template offers a visual tool that maps out project activities and their interrelated sequences. This diagram empowers teams to recognize and anticipate workflow structures by illustrating the connections and dependencies among tasks.