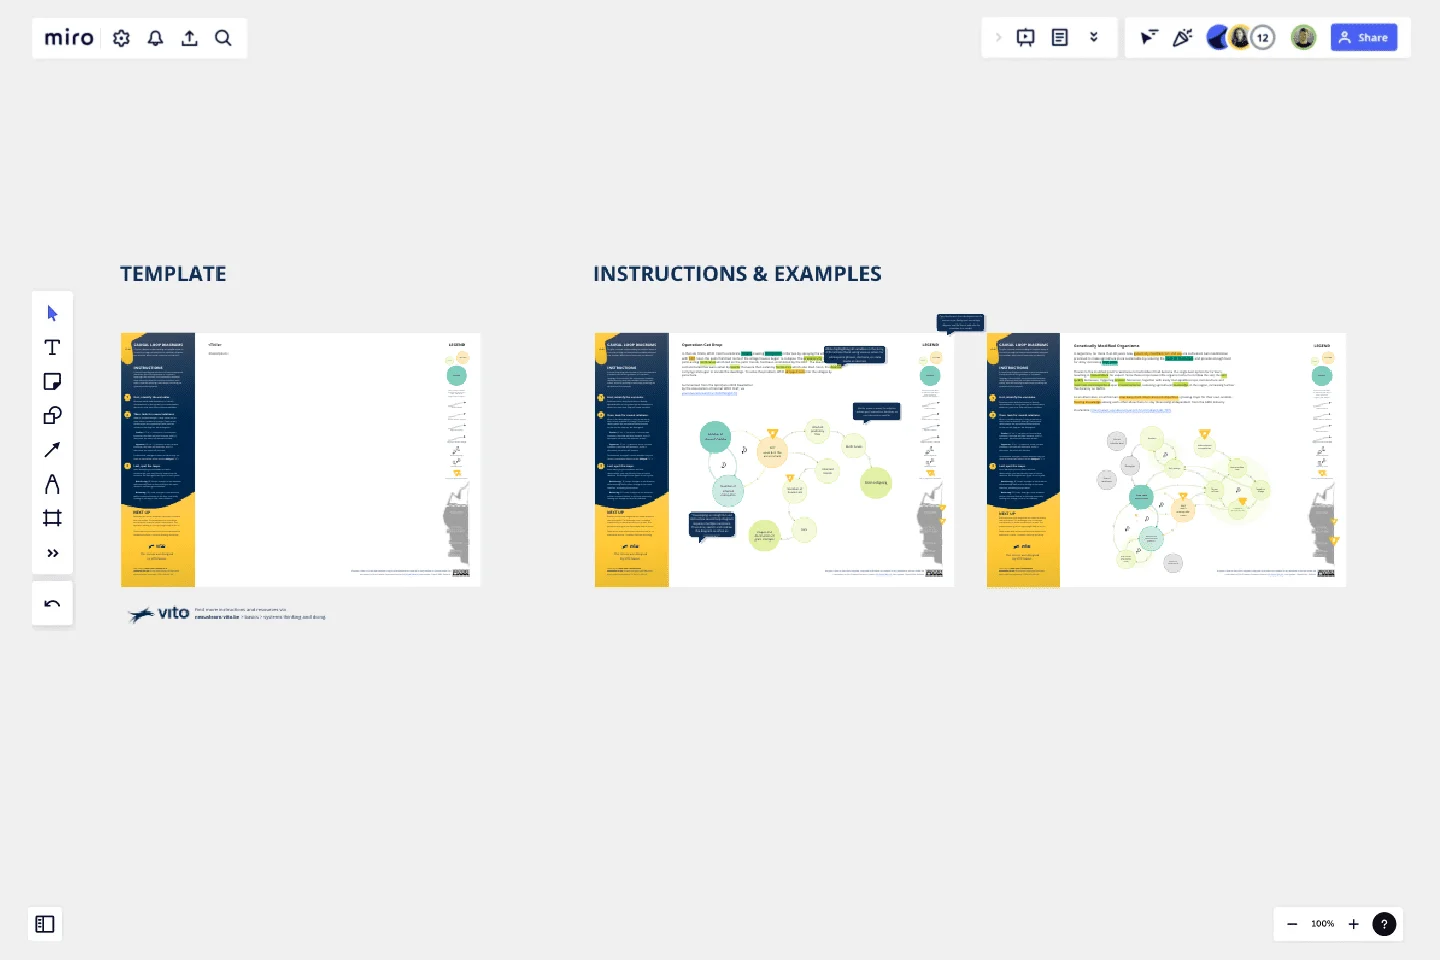
Causal Loop Diagrams (1.0)
To gain a deeper understanding of complex issues, it is crucial to map out how various variables influence one another. What causal loops can you identify?
To gain a deeper understanding of complex issues, it is crucial to map out how various variables influence one another. What causal loops can you identify?
A causal loop diagram consists of three fundamental elements, akin to the grammar of a system's language: the variables, the connections between them (depicting how the variables influence each other), and the resulting causal loops (revealing the dynamics of the systems).
This template offers a 3-step instruction, providing you with the basic building blocks to copy, and two inspiring examples. Let's begin mapping together!
Get started with this template right now.
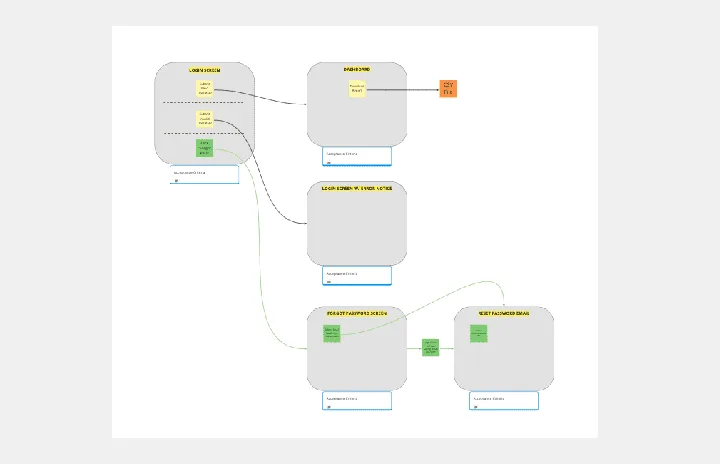
Breadboard (UI Flow Diagram)
Works best for:
Diagramming
The Breadboard (UI Flow Diagram) template offers a visual framework for designing and prototyping user interfaces (UIs) using the breadboard method. It provides elements for arranging UI components and defining user interactions. This template enables designers and developers to create interactive UI prototypes quickly and iteratively, facilitating user testing and feedback. By promoting rapid prototyping and experimentation, the Breadboard (UI Flow Diagram) empowers teams to design intuitive and user-friendly digital experiences effectively.
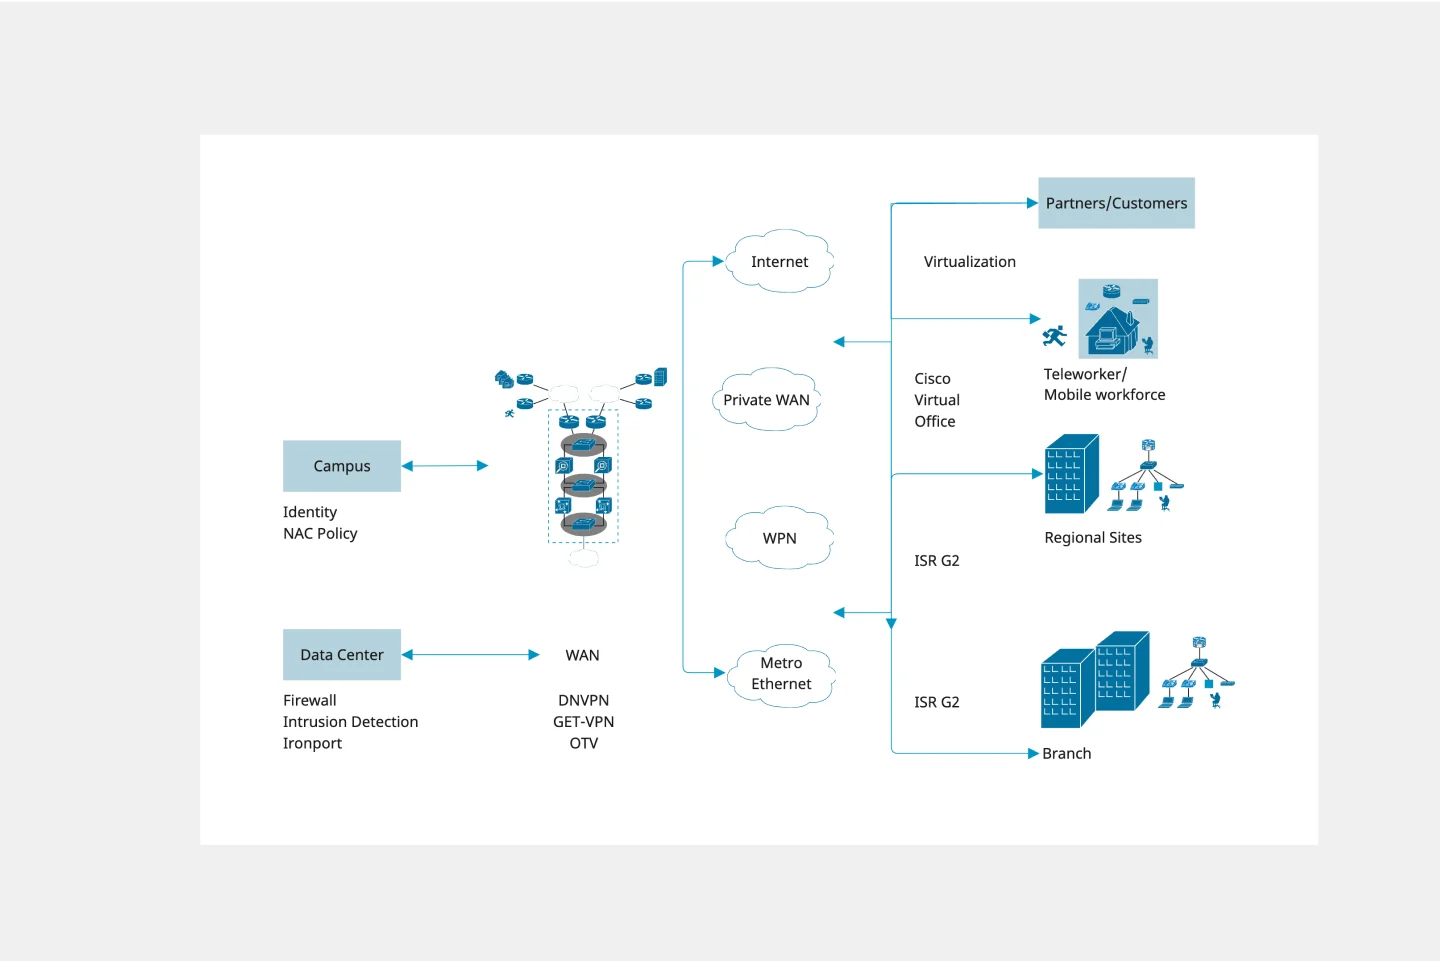
Cisco Recommended Security Architecture Template
Works best for:
Software Development, Diagrams
Cisco offers data center and access networking solutions built for scale with industry-leading automation, programmability, and real-time visibility. The Cisco Recommended Security Architecture uses Cisco elements to visually show the network design of Cisco networks.
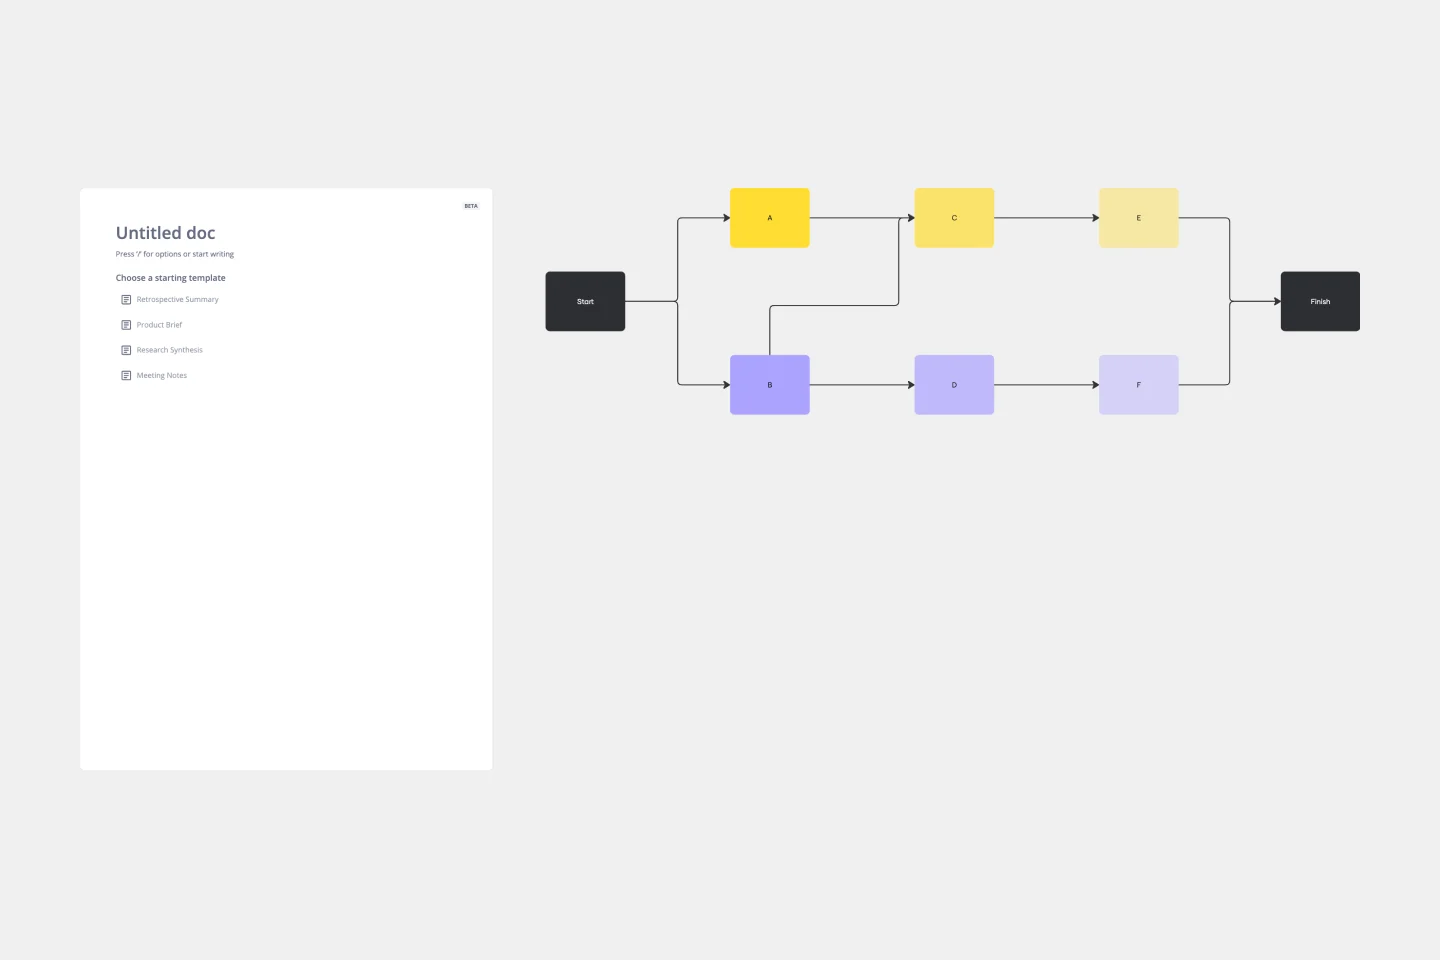
Precedence Diagram
Works best for:
Diagramming, Mapping
The Precedence Diagram Template offers a visual tool that maps out project activities and their interrelated sequences. This diagram empowers teams to recognize and anticipate workflow structures by illustrating the connections and dependencies among tasks.
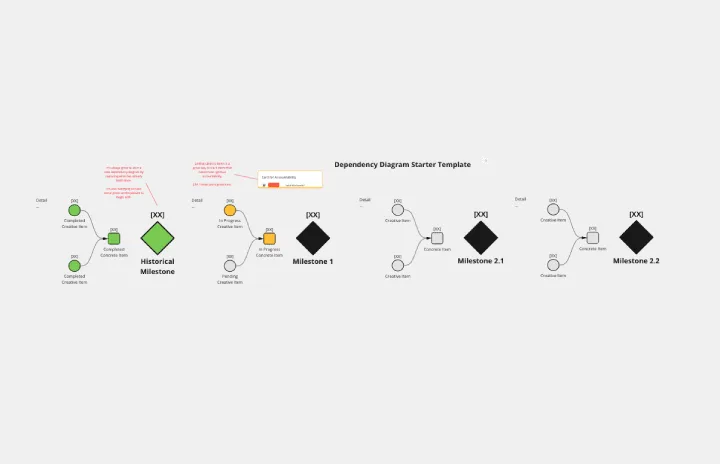
Dependency Diagrams Educational Board
Works best for:
Diagramming
The Dependency Diagrams Educational Board template provides a visual tool for teaching and learning about dependency relationships between components in systems. It offers a structured framework for illustrating dependencies, connections, and interactions within a system or process. This template enables educators to explain complex concepts effectively and engage learners in interactive activities. By promoting visual learning and understanding of dependencies, Dependency Diagrams empower students to grasp fundamental principles of systems thinking and analysis.
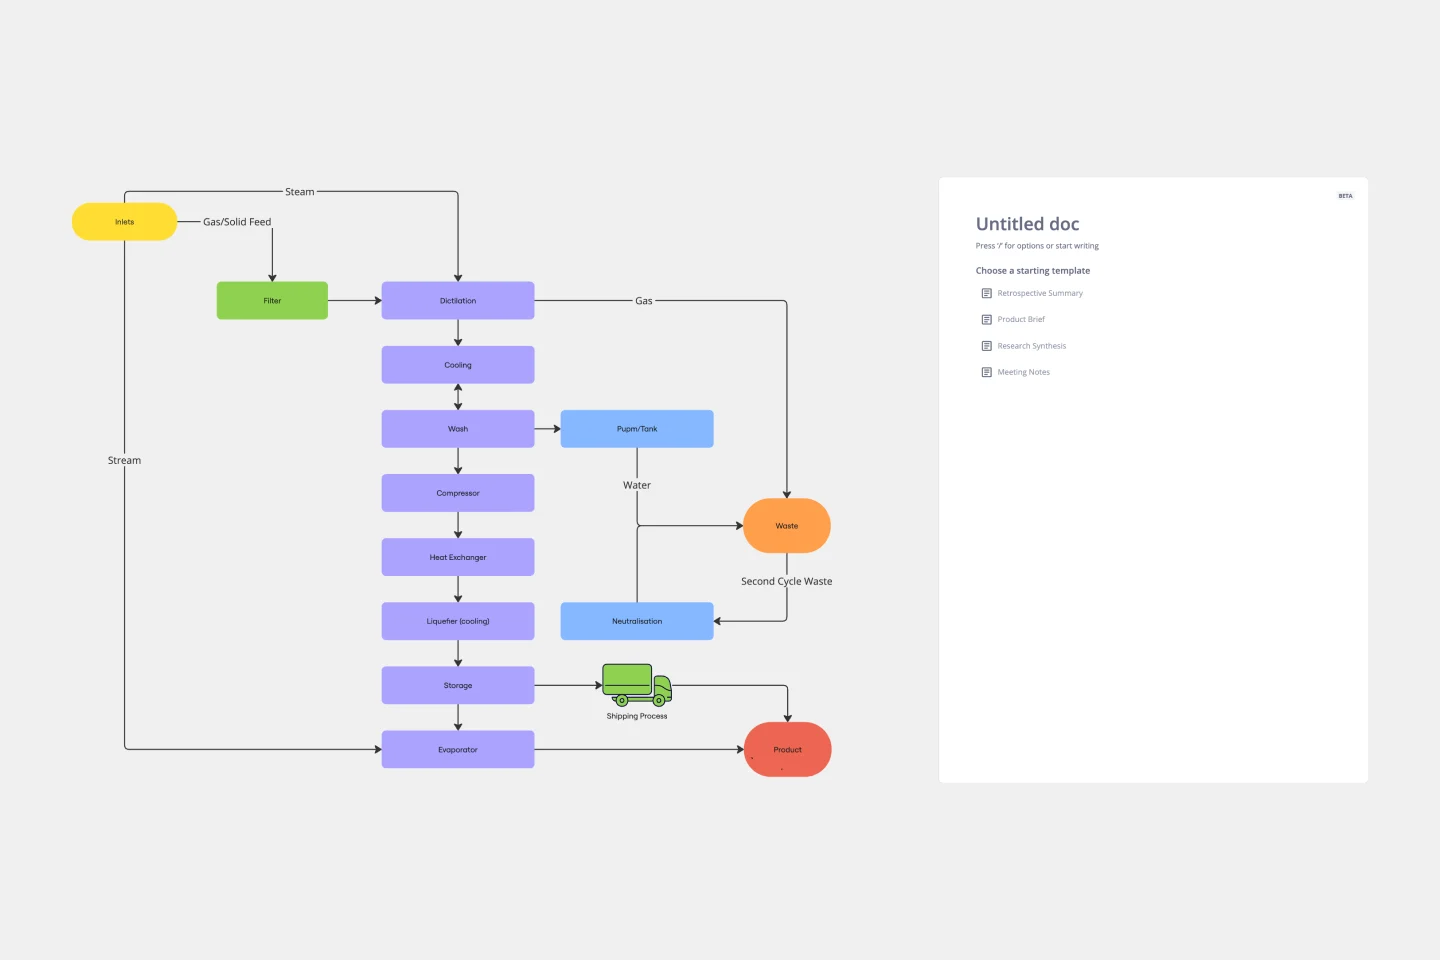
Block Diagram Template
Works best for:
Mapping, Software Development, Diagrams
Use this template to illustrate technical systems. Blocks represent important objects in the system, and arrows demonstrate how the objects relate to each other. Perfect for engineers, workflow managers, or anyone trying to build a better process.
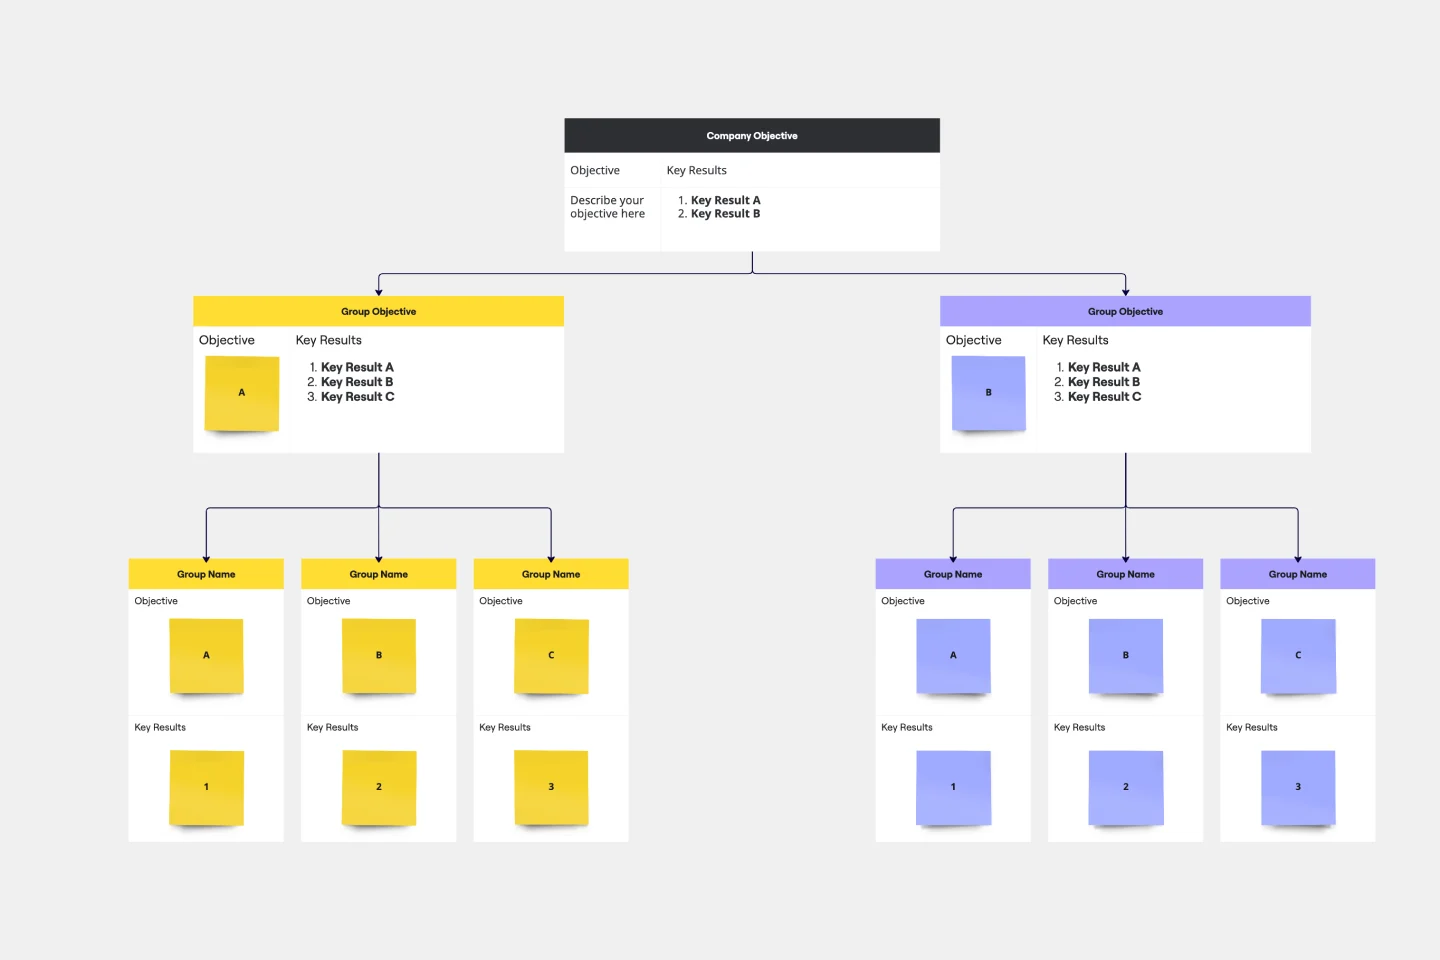
Objectives and Key Results (OKRs) Template
Works best for:
Leadership, Strategic Planning, Project Planning
Clarity, focus, and structure — those are the key ingredients to feeling confident in your company’s directions and decisions, and an OKR framework is designed to give them to you. Working on two main levels — strategic and operational — OKRs (short for objectives and key results) help an organization’s leaders determine the strategic objectives and define quarterly key results, which are then connected to initiatives. That’s how OKRs empower teams to focus on solving the most pressing organizational problems they face.